Introduction - Terrestrial carbon storage 9 have been simulated to cause an overall reduction in net primary production (FRIEDLINGSTEIN et al. 2006). It is very little involved in carbon exchange between global carbon stocks (GRINAND et al. 2012). Soil organic carbon therefore covers a wide range of very different organic compounds (STAHR et al. 2008).
The magnitude of the soil respiration response to increased temperatures also differs between ecosystems (PENG et al. 2009, SHAVER et al. 1992). Besides temperature, moisture or precipitation is another factor that greatly affects soil respiration (SCHIMEL et al. 1990). To study the link between climate change and the global carbon cycle, FRIEDLINGSTEIN et al. 2006) proposed to subtract the amount of carbon produced by heterotrophic respiration of the carbon from the net primary production.
Throughout historical times, agroforestry systems have formed key elements of the European landscape (EICHHORN et al. 2006). In Northern Europe, light is the limiting factor in most agroforestry systems (EICHHORN et al. 2006). A comparable style of silvoarable orchards in temperate Europe is the streuobst system (EICHHORN et al. 2006).
Streuobst plantations characterize the landscape and provide a sense of spatial depth and diversity (LUCKE et al. 1992).
Streuobst orchard B1
The grass on the orchard is cut twice a year, no fertilizer is and has been added. For the reference plot, the same area was measured away from a pasture close by, which is of the same soil type, but faces the other direction, southeast. The parent material is a carbonate-free quartz sandstone and is part of the Flysch zone.
The soil is a deep (> 70 cm), periodically wet pseudogley with intense root penetration but only minor earthworm activity (AMT DER NÖ.
Streuobst orchard K1
Unlike the first streuobst orchard, the trees here vary greatly in shape and size, with some trees being very old and large. At Streuobst Orchard M1, the trees are grown with only small spacings and are arranged in rows. The apple trees were planted in 1993 so that the size, except for a few replantings later, does not differ much.
The orchard is mulched twice a year and liquid organic manure is applied once a year, mainly to ensure sufficient water supply for the trees.
Streuobst orchard K2
Streuobst orchard M1
Materials & Methods - Streuobst Carbon Storage 32 Since there is a field next to the orchard, this was also included in the soil sampling. This has been conventionally managed for the last 100 years and is mainly planted with cereals. Remnants of last year's crop, maize (Zea mays L.), can still be found in the field.
Its area is 8711 m² and it was fertilized with diammonium phosphate and lime a few days before soil sampling. In the 5th streuobst orchard M2, the trees are planted in rows, with great differences in age, size and shape. There are large treeless areas in the orchard, so only a part of the entire orchard was measured and designated as a sampling site.
The orchard is used as pasture for around 60 cows during the summer and autumn months, with a turn-over applied once a year. The corresponding pasture, with 4176 m² of almost the same size, is managed in a similar way to the streuobst orchard: It is used as pasture during the summer and autumn, and is mowed once a year and fertilized with 100 kg of lime-nitrogen per ha.
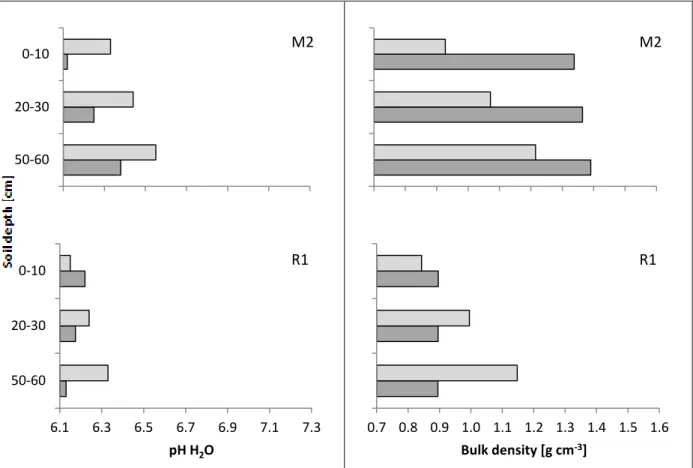
Streuobst orchard M2
At the point of soil sampling, spring barley (Hordeum vulgare L.) had reached growth stage 10 according to the BBCH classification (Lancashire et al. 1991). The soil is pseudogley on a siliceous sandstone belonging to the Laaber Decke in the flysch zone. It is a deep soil (> 70 cm) without carbonates and has a small to moderately coarse fraction (AMT DER NÖ LANDESREGIERUNG & . BA F.BODENWIRTSCHAFT 1994).
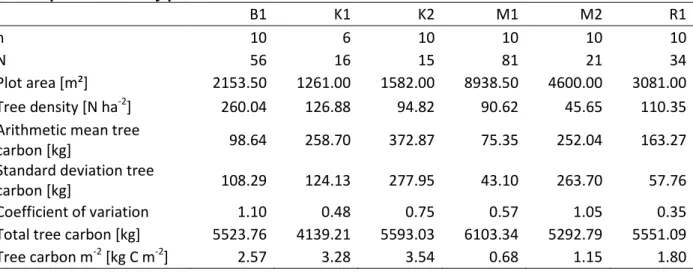
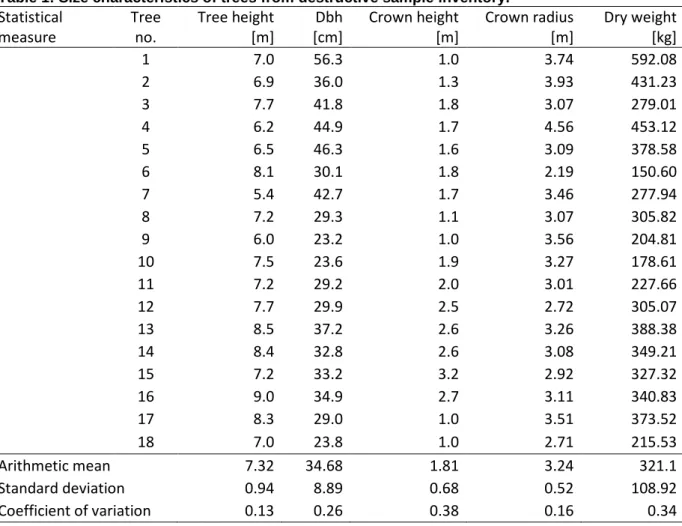
According to the owner, the groundwater level at the location is very low at approximately 4.30 m. For the soil samples, an area of 3081 m² for the streuobst orchard and 2552 m² for the meadow was measured, the streuobst orchard contained 34 scattered trees. 10 trees were measured in each orchard, with the exception of one orchard with only 26 trees of similar appearance where only 6 trees were randomly picked.
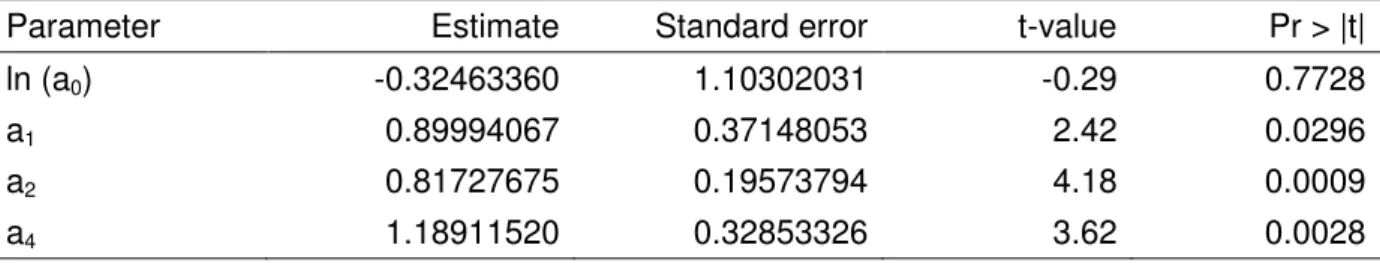
The mean value of the 10 and 6 trees, respectively, was entered into the previously derived equation to calculate dry biomass. To calculate the total wood carbon, the average carbon content per tree multiplied by the total number of trees on the plantation. The total tree carbon was finally divided by the area, resulting in kilograms of carbon per square meters.
Streuobst orchard R1
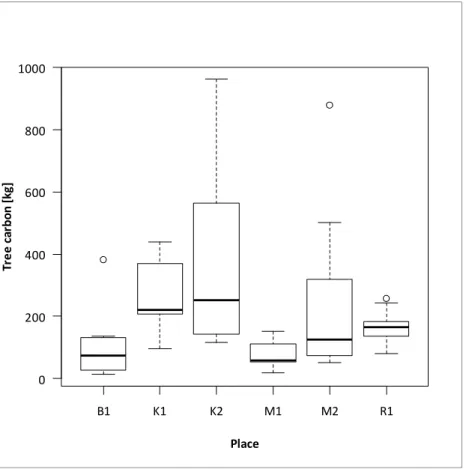
Arithmetic mean, standard deviation and coefficient of variation of carbon content per tree were calculated for each site. A box plot of tree carbon was created to visualize the variance and mean carbon content at each site. The unit of measure for soil carbon from the C/N determiner is the percentage of carbon in the sample.
A regression analysis was performed to quantify the effect that pH and bulk density have on carbon content. It showed no significant difference between the carbon content of soil samples taken within a tree line and samples taken between tree lines (p 0.5298). At the other sites, the soil carbon content of the pasture was similar to the streuobst content, which was not the case at the R1 site.
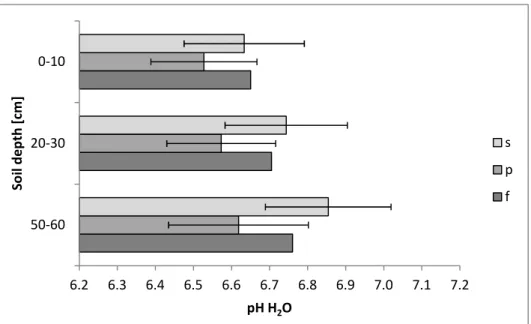
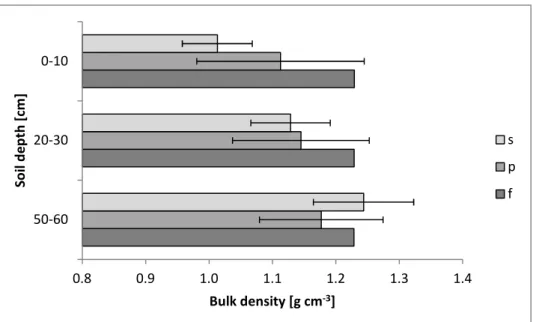
Soil organic matter functions as an ion-exchange component and is thus one of the most important buffer systems in temperate regions (JONES et al. 2005, SCHROEDER. 1992). The higher the baseline saturation of the exchange systems, the higher the buffering capacity (BLUME et al. 2010). The range of bulk density values is consistent with values commonly observed for grasslands in Austria (GERZABEK et al. 2005).
The higher deviation of the streuobst and grazing carbon values compared to the field values was also observed by GERZABEK et al. The waste biomass, the quantity as well as the quality, is one of the main explanations for differences in soil organic carbon content between land uses. The root system in temperate grasslands is very shallow, with about 83% of the root biomass in the top 30 cm of soil (JACKSON et al. 1996).
Another reason for variation in soil carbon storage across land and pasture uses may be the effect that fruit trees have on the microclimate. Apart from the reduction of litter, another reason for the lower soil organic carbon content in the field compared to streuobst pastures and orchards is soil disturbance. Furthermore, one of the six sites, R1, had separate values not only for soil carbon, so soil organic carbon values from R1 could have skewed the results.
A striking feature at K2 was the decreasing pH with increasing soil depth of the pasture which could have negatively affected the soil's organic carbon content. This suggests that most of the soil organic carbon is derived from tree components (C3 plants) and not from grasses (C4 plants), including the soil carbon contained in the fraction < 53 µm, which is generally accepted to be more stable than carbon in other fractions (NAIR et al. 2009).
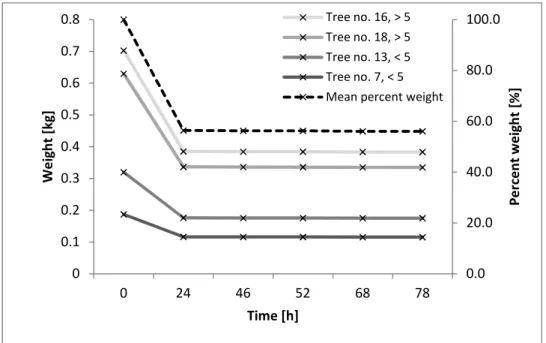
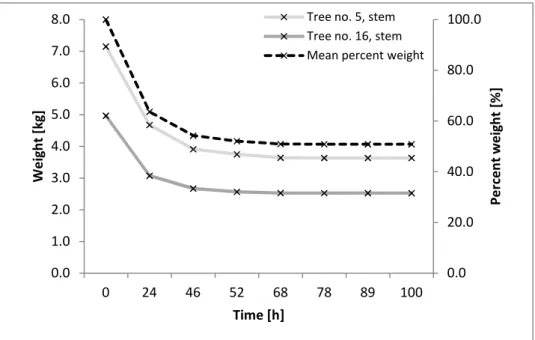
Four examples for streuobst trees from destructive sample inventory
The fragility of the carbon cycle in the 21st century: an assessment of carbon-climate-human interactions. In: Journal of Environmental Quality 37, p. Topography on soil organic carbon storage in the Northern Loess Plateau, China. Contribution of Working Group I to the Third Assessment Report of the Intergovernmental Panel on Climate Change.
Contribution of Working Group I to the Fourth Assessment Report of the Intergovernmental Panel on Climate Change. Contribution of Working Groups I, II and III to the Fourth Assessment Report of the Intergovernmental Panel on Climate Change. Contribution of Working Group I to the Fourth Assessment Report of the Intergovernmental Panel on Climate Change.
Contribution of Working Group III to the Fourth Assessment Report of the Intergovernmental Panel on Climate Change. In: Philosophical Transactions of the Royal Society B 363, p. variation within and among 41 North American species. Soil organic matter transport as a function of soil clay content: implications for model use.
In: Global Change Biology 6, p. 1990): Changes in soil organic carbon and nitrogen as a result of cultivation. In: Forest Ecology and Management 138, p. 2009): Contrasting soil pH effects on fungal and bacterial growth suggest functional redundancy in carbon mineralization. New data on the Flysch zone of the Eastern Alps in the Austrian sector and new aspects related to the transition to the Flysch zone of the Carpathians.