As the host of choice for biopharmaceutical manufacturing, Chinese Hamster Ovary (CHO) cells have been in the spotlight for process optimization in recent years. In addition, I developed a new approach based on concepts of convex analysis for the characterization of an organism's phenotypic capabilities (production envelopes). In 2011, the genome of CHO became available, marking a turning point for the development of metabolic modeling approaches for CHO.
The focus of this thesis is on metabolic modeling of CHO cells and, more specifically, on constraint-based modeling for the characterization of CHO metabolic capacities and the potential discovery of metabolic targets.
CHO cells as protein factories
Constraint-based approaches have been developed for 30 years and have proven to be a valuable tool for predicting the metabolic behavior most successful in microorganisms under a variety of experimental conditions [12]. The following parts of this thesis describe how I used methods based on linear algebra and computational geometry to investigate the metabolic constraints of CHO cells under different experimental conditions and establish computational tools to find new potential engineering targets.
Metabolism
Glycosylation of recombinant proteins in CHO
This modification has a major impact on protein folding and secretion, as well as the clinical properties of proteins, such as clearance or antigenicity [35]. More than twenty enzymes participate in glycosylation along the endoplasmic reticulum (ER) and the Golgi apparatus (Figure 1.2). This has challenged the application of glycoengineering techniques to a process once thought to be a result of random biochemical effects.
Systems Biology
Biochemical reaction networks
Reaction networks represent the genotype-phenotype relationship (genes to enzymes to substrate and products) and are an important aspect of systems biology. The increased availability of high-throughput data in recent decades has enriched the field of systems biology with the simultaneous generation of high-quality genome-scale metabolic models.
Metabolic network reconstruction
These networks provide the scaffolding into which omics data can be integrated and enable mathematical representation and, consequently, computational modelling. These models allow us to predict phenotypic states based on the genetic content of an organism [21]. These reconstructions arise from the integration of omics data along with biochemical and physiological information.
These reconstructions of all the metabolic knowledge of an organism can then be represented as mathematical models, making them suitable for computer simulation (Figure 1.3). In silico methods have been widely applied to metabolic models of microorganisms [63, 64] and humans are now rapidly evolving for CHO cells (see section 1.4).
CHO metabolic model
However, kinetic information on reaction rates is scarce, limiting the applicability of these methods to small networks. In this thesis, I applied these so-called constraint-based methods to the recently published metabolic model for CHO, iCHO1766 [69].
Mathematical models of CHO metabolism and glycosylation
- Modelling CHO metabolism
- Glycosylation
- Parameters and general assumptions
- Mathematical principles of constraint-based modelling
FBA can be combined with isotopomer analysis to improve the accuracy of the predicted fluxes. Metabolism modeling aims to reduce the metabolic burden on the cells caused by the recombinant production of the protein of interest. In another case, Gerkenet al.[133] considered the inhibitory effect of the presence of glycan structures at adjacent sites of glycosylation.
Liu et al.[145] presented a reaction network for the formation of O-glycosylation of the Lewis-X sialyl epitope.
Biased approaches
- Flux Balance Analysis
- Flux Variability Analysis
- Parsimonious Flux Balance Analysis
- Flux scanning based on enforced objective flux
Reduction of the solution space to a flux polyhedron by linear constraints in a small sample network. The potentially optimal cell behavior lies within this polyhedron, as does the actual cellular state of the organism. Methods to analyze this set of biochemically "allowed" fluxes are divided into two main groups: the biased approaches, which apply linear programming to obtain a set of optimal fluxes, and the unbiased approaches, which aim to analyze the entire set analyze steady-state flux distributions [106].
In the following, we include a list of constraint-based methods (biased and unbiased) that we have applied to the analysis of the CHO metabolic model. Despite its growing popularity, FBA has its limitations: there are several possible flux distributions that result in the same objective optimum; FBA is unable to predict flux distributions in the case of parallel metabolic pathways. Other quantitative approaches such as 13C Metabolic Flux Analysis (MFA) [74] can be used to estimate intracellular fluxes.
Omics data can also be used to obtain flux distributions consistent with experimental observations: this is the case of the Gene Inactivity Moderated by Metabolism and Expression (GIMME) algorithm, in which reactions are considered to be inactive if the expression values of genes stay below a certain threshold. [170]. FBA is the oldest and most widely used method for constraint-based analysis of metabolic networks for its simplicity and utility [106] and provides the basis of subsequent computational tools. For this reason it can be used to estimate the metabolic capabilities of the constraint network, sampling from the edges of the phenotypic space (Analysis of the phenotypic phase plane - see section 2.3.2).
As already mentioned, there are multiple flux distributions that satisfy the maximum objective function in (2.6). To address this degeneracy, parsimonious flux balance analysis (pFBA) performs a stepwise linear programming optimization: first maximization of the objective function (as in 2.6), then this maximum, e.g.
Unbiased approaches
- Elementary Flux Modes
- Phenotypic Phase Planes
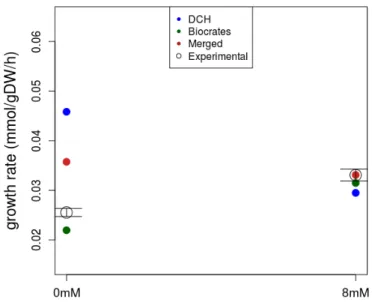
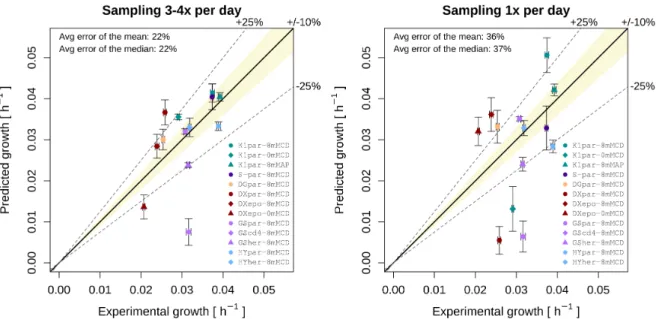
- FBA predictions on cell growth
- FSEOF with literature data
Semispace: Either of the two parts into which a hyperplane divides the affine space, i.e. the set of all pointsx such that aTx≤b for some ∈Rnandb∈R. Geometrically, they correspond to the projection of the flux polyhedron onto the reactions of interest. A toy network with constraints (panel a), its flow polytope along with a projection onto planar1,r2 (panel b), and a list of EFVs and EPs (panel c) of the flow polytope.
In the following iterations (B and C), hyperplanes (lines) containing these vertices (indicated by dashed black arrows) are mimicked/maximized until all facets of the projection are terminal, i.e. optimization does not lead to a new extreme. Note that (i) the projection of a polyhedron is also a polyhedron, and (ii) the components of an element of PE do not necessarily sum up to zero (herer1+r2=r3≥0), although r1andr2 are components of a possible steady-state flux distribution of the full network. This approach exploits geometric features of the bounded flux polyhedron and focuses exclusively on the projection onto a specific set of dimensions.
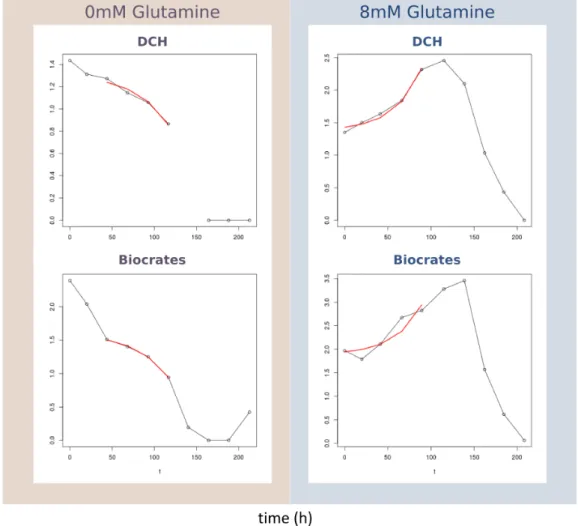
Time points were added or removed from the exponential phase when the standard error of the regression did not increase significantly. In the presence of glutamine, aspartate is secreted, as it is one of the by-products of glutaminolysis. Vertical error bars on predicted values are the result of sampling-experimental rates (1000 FBA runs) within the experimental standard error of the measurements.
The flux of the latter, identified as R_r0358, is plotted as an example of flux decreasing with increasing protein production in Figure 3.6. A complete list of the subsystems for the pathways found to correlate with protein production can be found in appendix B.
Unbiased approaches
EFM analysis for energetically efficient pathways
In the first steps, transport reactions that are inactive due to the absence of metabolites in the media are removed from the model. These cofactors are considered to be redundant in the cellular environment, so I artificially set the exchange reactions to be cofactor independent. Protected reactions are those considered to be part of the main CHO metabolism and should not be omitted.
It is assumed that if a response has a small flux range under the given conditions, it can be removed from the network without greatly affecting the overall flux variability of the system. This reproduces the FBA results for biomass and protein production in the generic model (6,663 reactions). I then compared the union of the supports (active responses in each EFM) of the two most efficient EFMs with the intersection of the sets of responses in the two least efficient modes; ditto for the three most and least efficient modes, and so on (up to 20).
Our goal was to find reactions that are linked to an efficient utilization of the metabolic substrates and that could potentially be used as metabolic engineering targets. I found no responses in the most and not in the least efficient modes of ATP-producing EFMs. They are colored according to the sum of the fluxes over ATP-consuming reactions (normalized).
Two of these pathways contain α-ketoglutarate, which is a key metabolite of TCA and is known to play a key role in cellular energy metabolism. However, the pathways I have found to be energy efficient are not part of TCA, but phenylalanine and tyrosine.
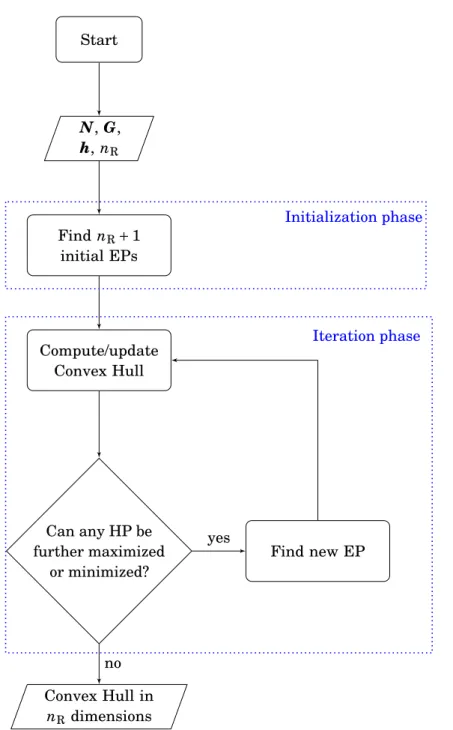
The convex hull method
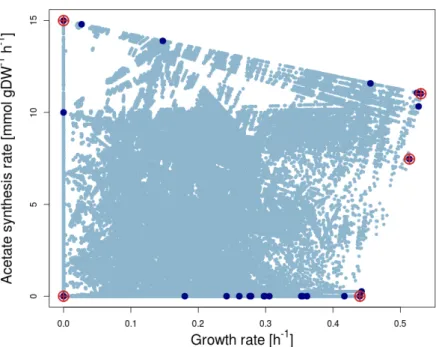
The coordinates of the first EP (point 1 in Figure 2.4a) are obtained by maximizing the first flux of interest [max(r1)=3] in a standard FBA problem; then the maximum of the second relevant reaction is computed by FBA with r1=3 fixed at its maximum [max(r2)=3 ifr1=3]. I calculated the PE for acetate with respect to growth in EColiCore2 [209] with our implementations of the CHM. I compared runtimes of our implementations of the CHM with current alternatives such as sampling the CH with FVA [187].
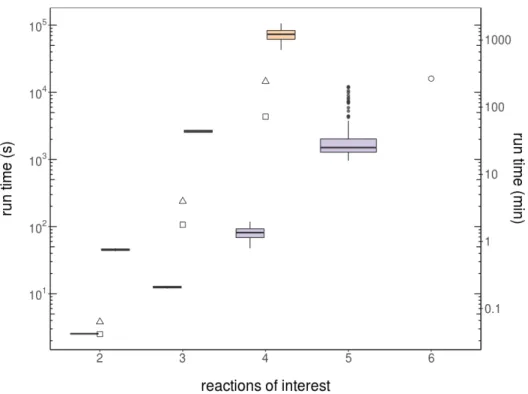
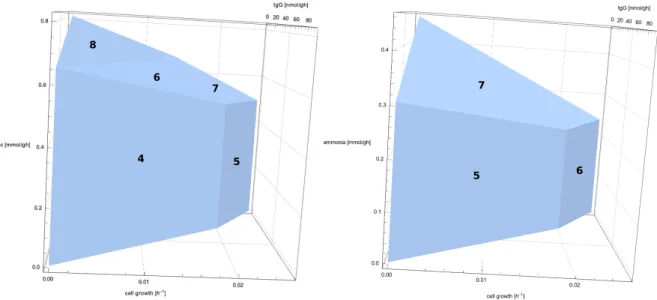
However, the performance of CHM depends on the order of the reactions of interest, see Figure 3.15. CH (hyper-) terminal plans are referred to according to the lists in tables 3.3 and 3.4. In different shades of blue, the HPs (aspects) of the projection, listed in Tables 3.3 and 3.4.
On the other hand, downregulation of lipid synthesis that contradicts biological evidence, and reflects the limitations of the model. I have already mentioned that correct annotation of the genome is crucial for the reconstruction of the metabolic network [21]. Compared to other metabolic models, iCHO1766 still lacks gene annotation for many of the metabolic responses (only 1,766 of 6,663 have a gene ID associated).
CHM performs LPs to efficiently find only PE vertices for reactions of interest. Statistical methods for Chinese hamster ovary cell omic data acquisition: from differential expression to integrated multilevel biological system analysis. Genome-wide reconstruction and analysis of the metabolic network of Pseudomonas putida KT2440 facilitates applications in biotechnology.
EColiCore2: a reference network model of Escherichia coli central metabolism and relationships to its parent genome-scale model.