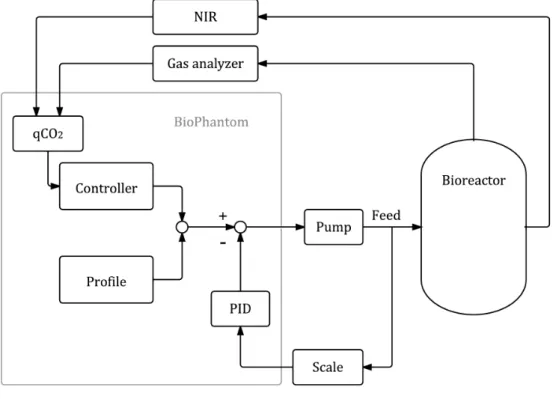
The goal of process analytical technology (PAT) is to monitor and control bioprocesses with powerful tools such as soft sensors. In this work a soft sensor consisting of two hardware sensors and an estimation algorithm was used to control the feeding of an Escherichia coli culture expressing recombinant green fluorescent protein. Online NIR probe and carbon dioxide measurements were successfully combined to estimate the specific rate of carbon dioxide that was used to control the feed.
Es wurden verschiedene Einstellungen für den spezifischen Kohlendioxidgehalt getestet, damit der verwendete Softsensor einen niedrigen Acetatgehalt aufrechterhalten konnte. Process Analytical Technology (PAT) zielt darauf ab, Bioprozesse mit leistungsstarken Instrumenten wie Softsensoren zu überwachen und zu steuern. Ein Softsensor wird verwendet, um die Fütterung einer Kultur von Escherichia coli zu steuern, die das grün fluoreszierende Protein GFP exprimiert.
Die Online-Biomassemessungen und die Kohlendioxidmessungen konnten erfolgreich zu einer bestimmten Kohlendioxidproduktion kombiniert werden. Darüber hinaus zeigten die Ergebnisse, dass der Overflow-Metabolismus keinen Einfluss auf das Wachstum und die Proteinproduktion des eingesetzten Stammes hatte und zu niedrige Futterdosen zu deutlich geringeren Erträgen führten.
Escherichia coli as a host
Green fluorescent protein
The cloning of a gfp10 cDNA, which encodes a 27 kDa protein (Prasher et al., 1992) and the demonstration that GFP could be used as a marker of gene expression in prokaryotes and eukaryotes (Chalfie et al., 1994) formed the basis for the use of GFP in molecular biology. In addition, there are several mutants of GFP with different excitation properties and emission colors, which can be used for e.g. Furthermore, it is detectable after a short delay phase, has a good signal-to-noise ratio and a low detection limit (Reischer et al., 2004).
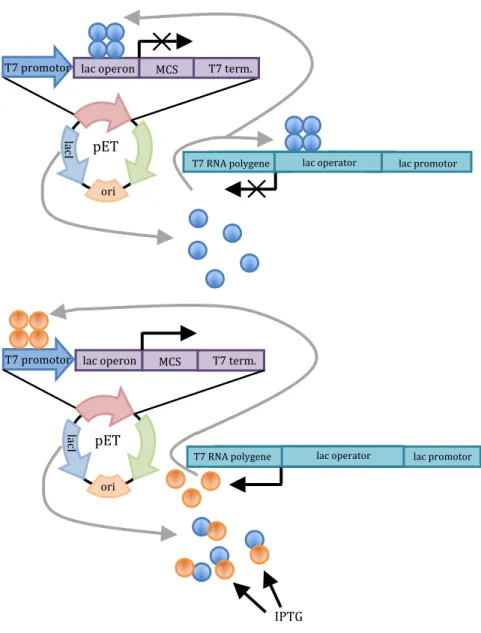
Regulation of the protein production with the T7/lac promotor
The synthesized T7 RNA polymerase can now bind to the T7 promoter and transcribe the mRNA for the cloned protein (Chmiel, 2011; Clark and Pazdernik, 2009).
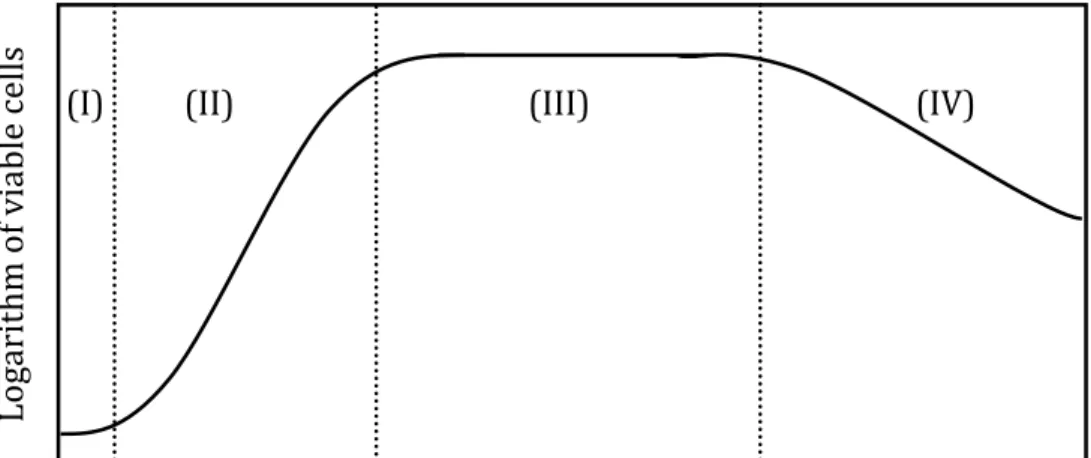
Bacterial growth
Bacterial Crabtree effect
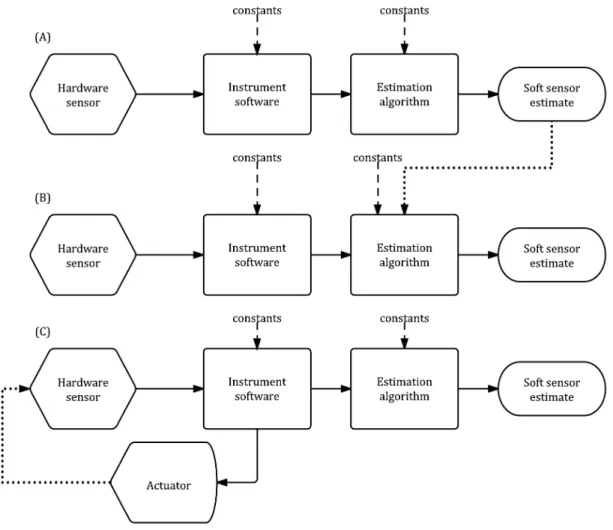
Soft sensors and process analytical technology
It is necessary to use hardware sensors that produce reliable measurement results and estimation algorithms that provide estimates in line with the real values of unmeasured variables (Chéruy, 1997). To meet PAT requirements, it is of great value to use soft sensors to keep a process on track. This type of feedback control leads to reproducible batches and also has a positive effect on downstream processing due to smaller variances of input materials (Gnoth et al., 2007).
To incorporate these features, soft sensors can be improved with appropriate statistical correction factors (Warth et al., 2010).
Strain
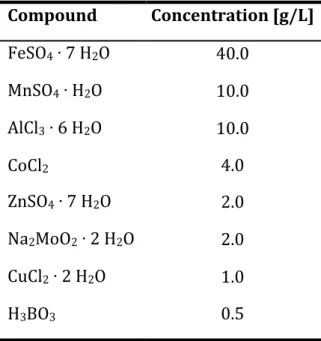
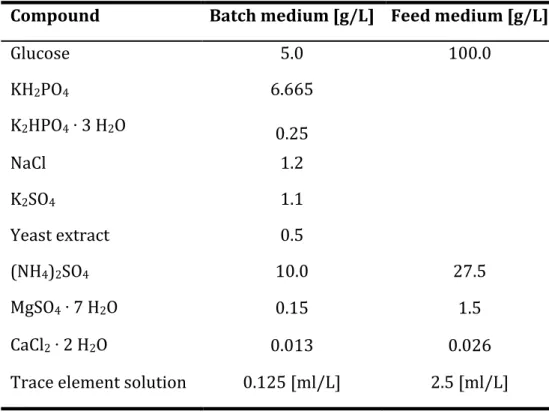
Media
The trace element solution was added to the feed solution through a filter after autoclaving to avoid precipitation.
Cultivation
Pre-culture
Batch cultivation
Fed batch cultivation
Analysis
- Near infrared monitoring
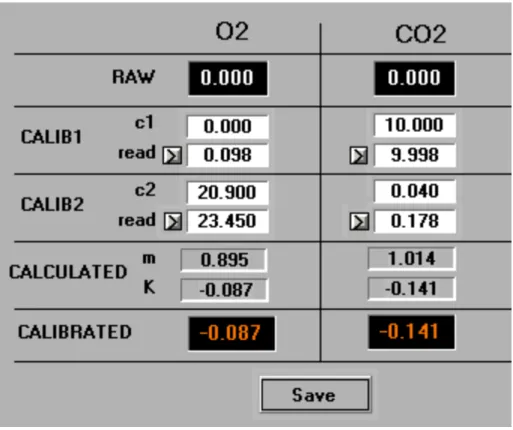
- Gas analysis of CO 2 and O 2
- High performance liquid chromatography (HPLC)
- Optical density (OD)
- Biomass dry weight (BDW)
- Fluorescence measurement
In this experiment, the specific carbon dioxide evolution rate was applied as a process value to control the feed rate. To find what specific carbon dioxide set point would result in a low acetate level and most GFP, set points between 0.2 and 0.5 g/g/h were tested. Cultivations B and C were run at a low set point for the specific carbon dioxide rate to test the control system and see if the acetate level could be kept lower than in cultivation A.
This is because the proportional band at the beginning is different and that the strain used can grow on acetate and produce carbon dioxide without consuming glucose. In both cultivations, it took some time until the set value of 0.2 g/g/h specific carbon dioxide evolution rate was almost reached. This cultivation showed that the strain used was not sensitive to acetate concentrations around 8 g/L and that induction had a large effect on carbon dioxide production.
In a final operation, it was tested whether a specific carbon dioxide rate of 0.35 could increase biomass and GFP production. There was no need to feed glucose because the cells consumed acetate and thus produced enough carbon dioxide. In addition to the DOT, these changes also affected the carbon dioxide measurements with the gas analyzer.
Agitation influenced the results of carbon dioxide measurements in all cultures. Nevertheless, it is possible to use the specific rate of carbon dioxide evolution to control feeding and to keep acetate levels low. An advantage of using carbon dioxide results is that they can be produced quickly and continuously.
Using only the amount of carbon dioxide produced to control feed would result in overfeeding or underfeeding. A high setpoint for carbon dioxide produced would result in a very high feed rate at the start of the feed. Since the cell concentration at this time of the process would not be high enough to produce a very large amount of carbon dioxide, the culture would be fed.
Feedback control with a soft sensor
Biomass estimation with near infrared spectroscopy
To convert this signal into a biomass concentration in g/L, ANIR is multiplied by a predefined factor KNIR (see 4.1).
Carbondioxide evolution rate
Specific carbon dioxide evolution rate
Feeding
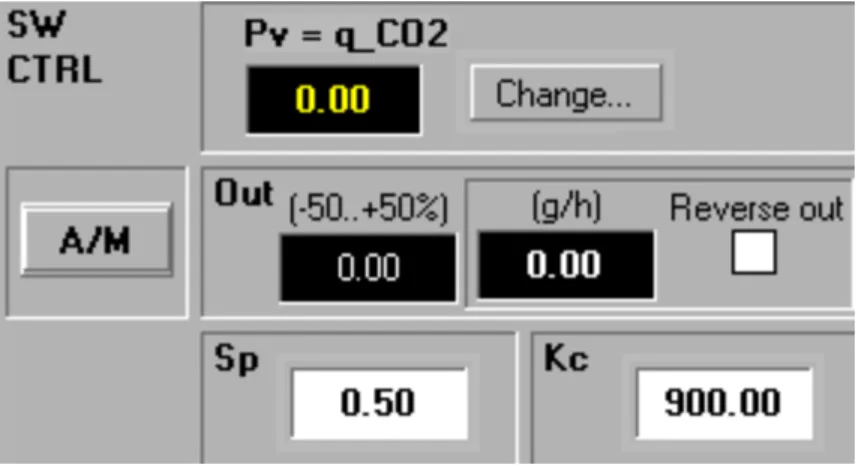
Feedback control with a proportional controller
This section presents data from five fed-batch cultivations and data for determining the calibration factor for the NIR probe.
Calibration of biomass estimation
Cultivation A
The results shown in Figure 12 show glucose consumption in the batch phase and glucose overfeeding after 10 hours. Bacteria grow slower than calculated in the exponential profile due to protein expression. The protein production that is induced after 6.5 hours is a burden for the cells and the pET30 expression system used with the T7/lac promoter and the synthetic inducer IPTG forces them to produce a large amount of GFP.
Cells consume less glucose and the post-induction phase would require a different feeding profile than the one below.
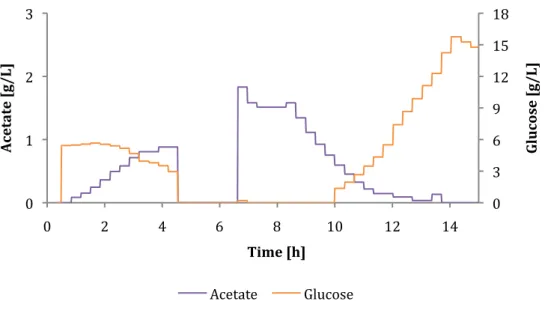
Cultivations B and C
After the batch of glucose is consumed, the cells begin to consume acetate and the small amount of glucose that is fed. The two graphs show that there is no glucose in the broth for about 6 to 7 hours. In this case, they get little glucose and consume acetate on the side, which leads to delayed growth.
For cultivation B, the value for proportional band was increased from 200 to 900 in the first 1.5 hours of feeding, while the feeding of cultivation C had a proportional band of 900 from the beginning. Comparing the two feeding rates shown in Figures 18 and 19, we can see that cultivation B starts with a low feeding rate, while cultivation C has a feeding rate of zero for the first 1.5 hours. As shown in Figures 20 and 21, the proportional controller could not reach exactly 0.2 g/g/h but remained constant at 0.25.
Due to the low setpoint and low feeding rates, bacterial growth was slower than in the A culture and resulted in later induction and generally less GFP over comparable time intervals.
Cultivation D
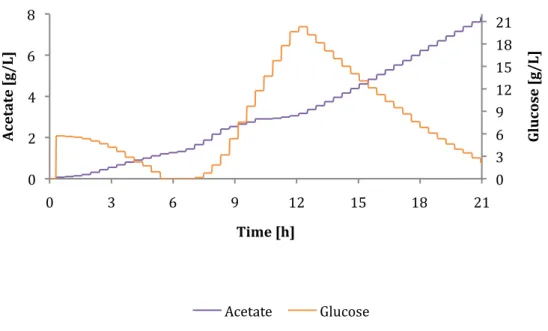
Due to the high loading rate, glucose started to accumulate after only 7.5 hours, which is 2.5 hours earlier than cultivation A. The high glucose concentration of 19 g/L started to decrease after 2 L of loading medium was pumped into the reactor and without, more fresh glucose was provided. Despite the high concentration of acetate, more biomass and GFP were produced than when growing A.
This means that the strain used can grow and produce recombinant proteins even though the concentration of acetate in the culture medium is high. As shown in Figure 24, the feed rate was increased over a period of 2.5 hours to a maximum value and continued at 400 g/h until the medium feed was finished. Although the feeding rate was so high and glucose had already accumulated, it was impossible to maintain a qCO2 level of 0.5 g/g/h after induction at 7.5 hours (see Figure 25).
Cultivation E
It seems that the glucose consumed from 7.5 to 8.5 is exactly the amount that the cells need. The solubility of gases in stirred vessels depends on the gas flow rate and the speed of the stirrer. The higher the stirrer speed, the smaller the bubbles and the slower the rate of bubble rise.
If the speed is too low and the gas flow too high, the distribution of the gas will be poor (Doran 1995). Since the rudder speed controls the DOT, the settings for this PID regulation can be improved to get smaller responses.
Summary of results
General conclusions of the work
Why not to use carbon dioxide to control the feeding
Suggestions for future work
Chang Y Y, Wang A Y, and Cronan Jr J E, "Expression of Escherichia coli pyruvate oxidase (Poxb) depends on the sigma factor encoded by the rpoS (hatF) gene." Batch-to-batch reproducibility of fermentation processes through robust process operational design and control." Journal of Biotechnology. Gustavsson R, "On-‐line control of glucose feeding in an Escherichia coli fed-‐batch cultivation using a recombinant protein Express. " Master's thesis, Linköpings.
Luli G W, Strohl W R, "Comparison of Growth, Acetate Production, and Acetate Inhibition of Escherichia coli Strains in Batch and Fed-Batch Fermentation.". Nemecek S, Marisch K, Juric R, Bayer K, "Design of transcriptional fusions of stress-sensitive promoters and GFP to monitor Escherichia coli host overload during recombinant protein production." Bioprocess and biosystem engineering. Reischer H, Schotola I, Striedner G, Pötschacher F, Bayer K, "Evaluation of the GFP signal and its potential for new online monitoring strategies.
Santillan M, Mackey MC, "Quantitative approaches to the study of bistability in the lac operon of Escherichia coli." J. 34; Evaluation of Software Sensors for Online Assessment of Culture Conditions in Cultivation of Escherichia coli Expressing a Recombinant Protein.” Journal of Biotechnology.