As response variables are the board properties Internal Bond Strength (IB), Surface Soundness (SS), Modulus of Rupture (MOR), Modulus of Elasticity (MOR) and Thickness Swelling 24 h (TS), and also the press factor and resin fraction. is analyzed. Partial least squares regression (PLSR) was used to create 45 models. The main key sources of variation were determined 1) by the frequency with which variables appear in models and 2) by weighting the regression coefficients according to the technological relevance of the plate properties. The models show that the plate properties were influenced by the raw material variables with an average of 21%, and the rest by process variables.
HDF manufacturing
Medium- and High-density fiberboard
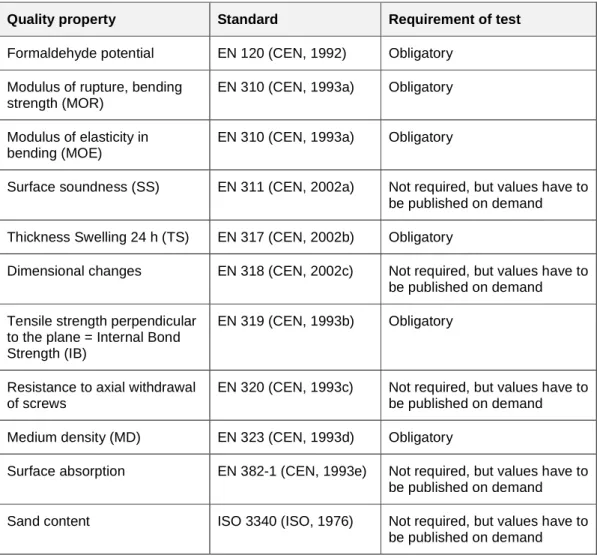
Standards in MDF/HDF manufacturing
Concepts in Quality Management
Less variation resulting in less rejects
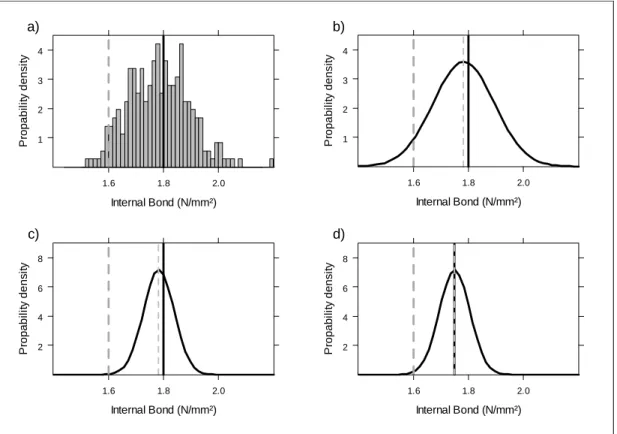
11 method and the actual tested property in accordance with the standard (sample size is 32 plates per product type) is at least 0.70. The current lower specification limit (and 5% quantile of the normal property of distributed plates) is 1.6 N/mm² and the target value is 1.8 N/mm². The target value could therefore be reduced to 1.75 N/mm², and still less than 1% would fall below the lower specification limit (Figure 2d).
Exploratory Data Analysis and Data Mining
In this work, the selection of variables has been of greater importance than the precision of long-term predictions, because the main objective was to find process and raw material variables of the plant that have significant influences on the produced HDF boards under the given production -institutions. Moreover, this work focuses on an explanation of the system, where linear relationships between variables can be assumed (Lobenhoffer, 1990). In this work, the emphasis in model building is primarily on the sign and relative significance of parameters, and only secondarily on the actual regression coefficients.
Models for MDF manufacture (literature review)
Fiber processing
The performance of IB affected by wood fiber acidity, size distribution and bulk density was investigated by Xing et al. Models of laboratory-made MDF panels with special focus on the wood and fiber properties were developed by Li Shi et al.
MDF/HDF process
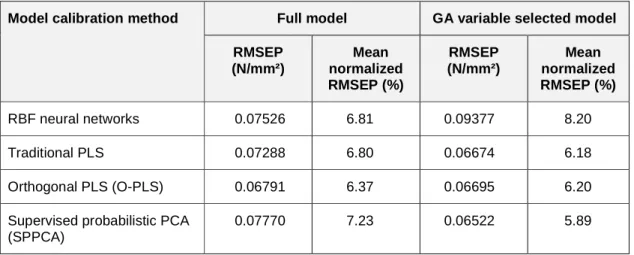
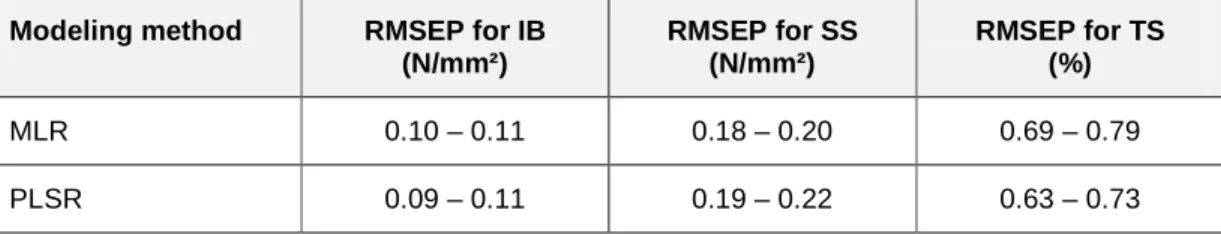
RMSEP of PLSR models on spectroscopic data with MOR and IB as predictor variables (Dolezel-Horwath et al., 2005). Multivariate calibration models for predicting Internal Bond Strength (IB) of MDF process variables were developed by André et al. 17 Multiple linear regression (MLR) and quantile regression (QR) models for IB of MDF were developed by Young et al.
Research question
The literature further emphasizes the suitability of projection methods such as PCA, PLSR and its extensions, in order to predict the product quality parameters of MDF/HDF (Hasener, 2004; Dolezel-Horwath et al., 2005; André et al. ., 2008).
Industrial production plant
Production process
Data
- Sampling routines
- Process and raw material data sources
- Lag time
- Missing values
Ion (exchange) chromatography analyzes on anions were performed on the liquid extracts of the fiber material to quantify the amount of organic and inorganic anions. The amount of anionic groups on the fiber surface was determined by sorption of methylene blue. Methylene blue sorption is an easy and simple method for the determination of ionizable anionic groups on the surface and in the fiber.

Variables
- Response variables
- Predictor variables
- Special events
For the raw material, the time delays were estimated and considered when taking samples for the laboratory analysis. For the modelling, the predictor variables were further distinguished between raw material variables sensu lato (raw), and process variables (proc). 26 categories "raw material" sensu stricto and "fiber" from Table 9, and "proc" included the remaining categories, with the exception of category "product property".
Statistical fundamentals
- Sample Standard Deviation (s)
- Coefficient of variation (CV)
- Pearson correlation coefficient (r)
- Coefficient of determination (R²)
Pearson's correlation coefficient r, also known as the sample correlation coefficient, can be used to estimate the linear relationship between x and y. In the case of multiple regression, the coefficient of determination can be seen as the square of the correlation coefficient between the observations y and the estimates "< (equation 6). Different models can be compared with the coefficient of determination if the response variable is the same and the number of parameters is the same (Fahrmeir et al., 2007 ).
Multivariate analysis (MVA)
- Multiple Linear Regression (MLR)
- Principal Component Analysis (PCA)
- Principal Component Regression (PCR)
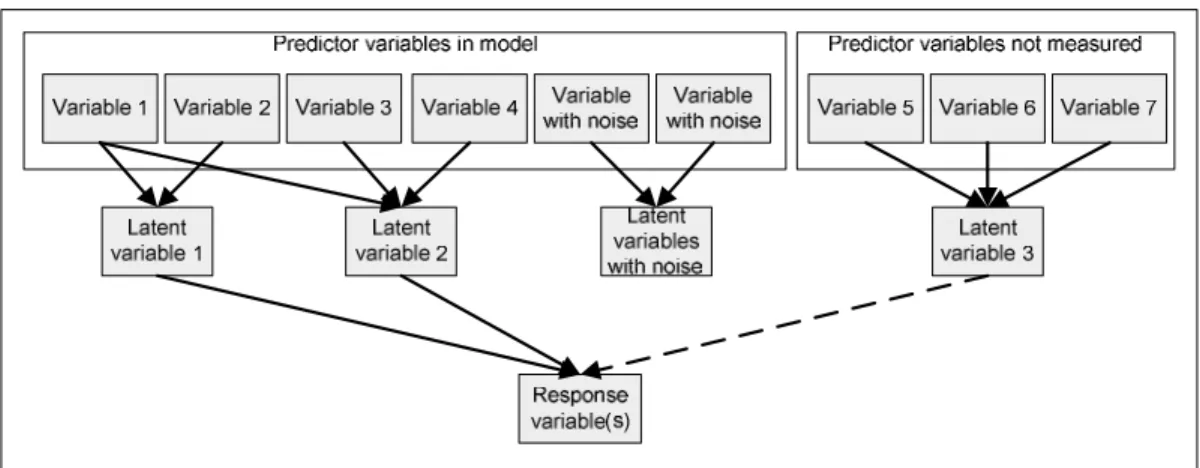
- Partial Least Squares Regression (PLSR)
- Principle
- Regression output
- Calibration and validation
- Important statistics
- Miscellaneous issues
- Variation of data
- Summary of regression modeling methods
With this factor some of the variables can be chosen to be excluded from the model. It consists of several vectors (principal components, PC), which are linear combinations of the original variables X. The sum of these variances can be used to estimate the uncertainties and significance of the model parameters.
Statistical Models
Outlier detection
Outline for Modeling
Correlation and causality
Statistical Process Control (SPC)
Variation
- Controlled variation
- Uncontrolled variation
- Possible states of a process
Controlled variation is characterized by a stable and consistent pattern of change over time, while uncontrolled variation features a pattern of change that changes over time. The variation present in the process consists only of that which belongs to the process itself. On the other hand, if a process exhibits uncontrolled variation, it changes from time to time ie.
The first step to improving process output behavior is to identify the attributable causes of large variation. In SPC, the concept of "zero defects" is insufficient, and more effort is required than just meeting certain specifications. The states of complete chaos and the edge of chaos below the line contain attributable causes of uncontrolled variation.
Eliminating the causes using control charts as an identification tool can move the process to the threshold and further to the ideal state. Thus, control charts can be used for continuous improvement to achieve the ideal state. 48 The process that forms the basis of this work can be considered to be in a threshold state.
Therefore, efforts should be made to bring it to the ideal state.
Control Charts
- Univariate Control Charts
- Multivariate Control Charts
Multivariate control charts, such as Hotelling's T2 control charts and principal component control charts, can be applied to handle variables simultaneously (Fuchs and Kenett, 1998). Regression residuals and principal component scores can be plotted on multivariate SPC plots, which are essentially univariate Shewhart plots, yet more powerful in detecting anomalies (Nomikos and MacGregor, 1995).

Correlation of board quality parameters
Number of rejects
In plane gradient of properties perpendicular to the production direction
- Gradient of IB across the board width
- Gradient of SS across the board width
- Gradient of MOE across the board width
- Gradient of MOR across the board width
- Gradient of thickness swelling across the board
- Summery for the gradient across the board width
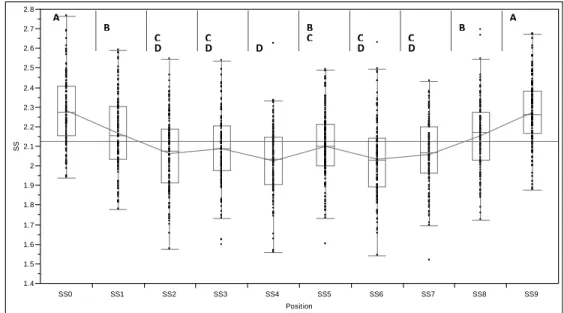
The Tukey-Kramer HSD test reveals four homogeneous groups in the SS gradient (Figure 12). The dip in the center is similar to IB, but the maxima are at the very edges. As for SS, the edges have higher mean values and even build their own homogeneous group.
However, in contrast to IB and SS, values dropped to a relatively uniform level of only one homogeneous group after the maximum found at the edges. It is also noted that position 7 shows a slight drop, which may be due to a local error in the press configuration. Overall, quality parameters show minima in the center of the board, so significantly better values were found closer to the edges.
This can be explained by the sealing of the ends to avoid the escape of gas, which prevents the loss of moisture and heat. The closure has as a side effect that profiles with different densities are created at the edges that are in the center of the table, which, however, was not studied in this paper. The behavior of the TS is different however, as there is no drop in the center of the table.
For MOE and MOR, the drop at position 7 can be explained by an error in the configuration of the press.
Results of PLSR models
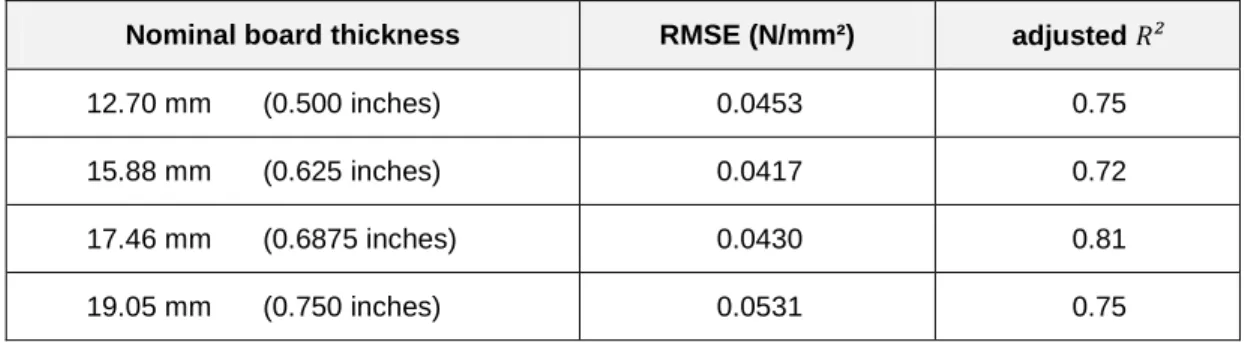
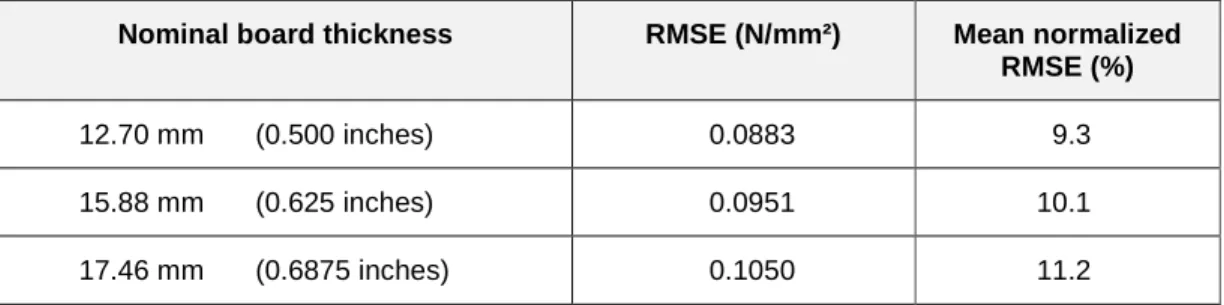
Models by major board thicknesses
Models for raw material and process variables
Models for IB on positions across the board width
Detailed results of the models
- Most important variables for internal bond strength (IB)
- Most important variables for surface soundness (SS)
- Most important variables for modulus of rupture (MOR)
- Most important variables for modulus of elasticity (MOE)
- Most important variables for thickness swelling (TS)
- Most important variables for press factor (PF)
- Most important variables for resin fraction (RF)
- Most important variables on all models by frequency of occurrence
- Most important variables on all models by B w , weighted by the technological
Models show somewhat worse results compared to MOR in terms of the amount of significant variables. In general, TS in winter tends to be higher compared to the rest of the year. This can be explained by generally higher moisture content (MC) in the raw material in winter.
The pressure on system 10 of the press is relevant, as high pressures in this system result in low thickness swelling. However, a higher PF is not desirable in relation to the economically important production rate, which is why the signs must be interpreted the other way around. A high buffering capacity of the fiber on the forming band generally has a positive effect on the curing and results in a low PF.
Furthermore, this is indicated by the positive coefficient of the wood input of part material flow P1. High pressure, residence times and fill levels of the digester result in less resin consumption. This applies except in the case of IB, where the models of the single values of IB and with a nominal thickness of 7.4 mm are also included in the frequency column.
Notably, only process variables and no raw material-related variables are included in the list of Table Most important variables in all models according to Bw, weighted by .. technological importance of table properties.
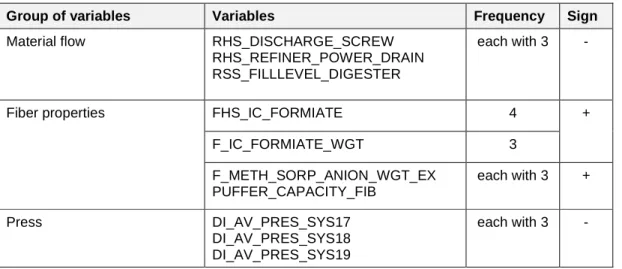
Summary of the press
Example control charts for thickness swelling
Further possible analysis
Improvements with existing data
Better statistical methods
Use and collection of further data
Validity of the hypotheses
Further analysis
The main focus of this work is to study the interaction between the raw materials, the process and the plate quality parameters with the aim of determining the main sources of variation. Subjective variables on evaluation of the process and formaldehyde perception, recorded by the factory staff. Wet chemistry data for the raw material and processed fibers, containing the amount of hemicelluloses/extractives determined by methanolysis.
With the thickness of 7.4 mm, the average values of the properties of the table of quality parameters show significant correlations (p<0.05), except for TS and IB. 84 In-plane gradients for board properties perpendicular to the direction of manufacture (across the board width) show that quality falls in the center of the board, thus having significantly better quality properties at the edges. TS tends to behave differently though and doesn't fall in the center of the table.
The most important variables were determined by two methods: (1) by determining the frequency of occurrence with the variables from the models and (2) by weighting the regression coefficients Bw of the selected models according to the industrial importance of the panel properties. With information from the models, the impact of raw material variables on panel quality parameters is estimated at an average of 21% per Q². Examples of control charts for TS reveal that multivariate control charts for all available variables have a better ability to detect changes in the process than control chart data for only the TS panel property.
CEN (1993b) EN 319: Particleboard and fiberboard - Determination of tensile strength perpendicular to the plane of the board.
Abbreviations and Terms
Abbreviations used in this document and within variable names
Synonyms of terms in regression
Descriptive Statistics of the Variables
Descriptive Statistics of all observations
104 FHS_METH_SORP_ANION_EX µmol/g fiber chips methylene blue sorption of anion groups extr. 119 FSS_METH_SORP_ANION_EX µmol/g fiber sawdust methylene blue sorption of extracted anion groups. 129 F_IC_ACETATE_WGT mg/kg DM fiber sawdust IC acetate weighted raw fiber raw material 1903.7.
Descriptive statistics for properties with thickness 7.4 mm
Descriptive statistics for properties with thickness 6.4 mm
Summary statistics of all models
Weighted regression coefficients (Bw) of all models
B w for IB
B w for SS
B w for MOR
B w for MOE
B w for TS
B w for press factor
B w for resin fraction
Frequency of occurrence of variables in models