The last part, section 3.4, summarizes and discusses the above findings and shows their implications for the analysis of the case study. The following two sections present the data (section 4.3) and the methodological framework and models (section 4.4) for the empirical analysis.
The reasons for focusing on the agricultural sector
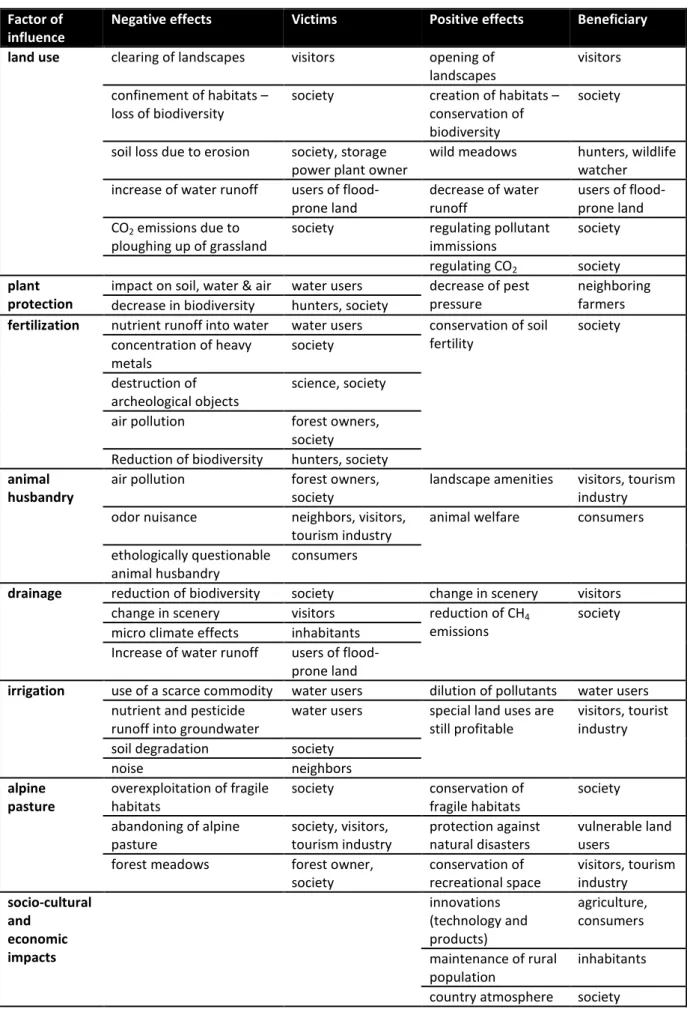
The environmental effects of agriculture
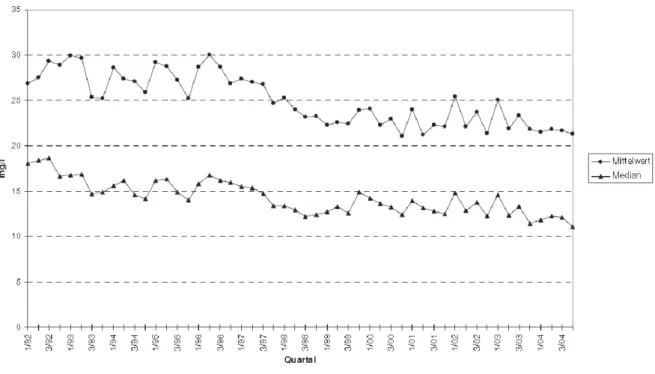
Due to the abundant availability of water in Austria, this is only a regional concern (eg in Marchfeld; see section 4.2). Nitrate concentration levels then began to decline steadily until 2000, most likely due to less fertilizer use (more efficient production techniques).
Trade distortions in the agriculture sector
The European Commission (2010b) seems to accept that agricultural trade is likely to be more liberalized in the future. The effects of trade liberalization are said to be potentially greater in the agricultural sector than in the manufacturing sector (Ferrantino, 2000, p. 133).

Reasons for assessing local environmental impacts
Similarly, a more recent statement can also be found in the Cartagena Protocol on Biological Safety (Secretariat of the Convention on Biological Diversity, 2000). Environmental issues continue to be a concern in the current WTO negotiations, the Doha Development Agenda (DDA).
Deriving trade-environment linkages from economic theory
Individual countries liberalizing trade
Concretely, this means that transaction costs must be low enough (ie, the benefits of implementing a policy must be higher than its transaction costs) and that sufficient information is available to both consumers and producers to value the externality accurately. It is therefore not surprising when Perman, Ma, McGilvray, & Common (2003, p. 341) state that 'the world is one in which distortions are widespread, environmental pollution problems are rarely if ever fully internalized, and it is almost impossible to design fully effective pollution control programs'.

Decomposing the environmental effects of trade liberalization
Drawing their conclusion in an in-depth literature review, Jayadevappa & Chhatre (2000, p. 182) state that “the EKC nexus provides no information about the actual chemistry of interactions between development and the environment that is crucial for policy measures”. As will be shown in Section 3.3, the net environmental outcomes of trade liberalization are unclear and current empirical findings do not allow for generalization.
Other trade-environment linkages
The 'pollution haven' hypothesis states that heavily polluting production will move from countries with high environmental standards to countries with weak environmental protection. Moreover, Copeland & Taylor (2004) make a distinction between the pollution haven hypothesis and the 'pollution haven effect'.
Trade and sustainability
Production is expected to shift from high-income countries to low-income countries due to the reduction of high trade barriers in the former (Maltais, Nilsson, & Persson, 2002). Conceptual framework for sustainable assessment of the impact of trade negotiations in the agricultural sector (adopted by Maltais, Nilsson, & Persson (2002, p. 18) The most important issue regarding the economic dimension is the effect of trade on welfare (Maltais, Nilsson, & Persson20, 20).

Review of empirical studies
General trade-environment studies
Strutt and Anderson (2000) conducted a GTAP (Global Trade Analysis Project)23 application (version 3) to assess the environmental impacts of trade liberalization in Indonesia. They conclude that their findings argue for better domestic environmental policies to minimize the negative environmental impacts of trade liberalization. Policy coordination between high- and low-income countries is needed to minimize the negative environmental impacts of trade (challenges differ: low-income countries want to minimize environmental degradation, while high-income countries want to reduce it).
Environmental impacts of agricultural trade policies
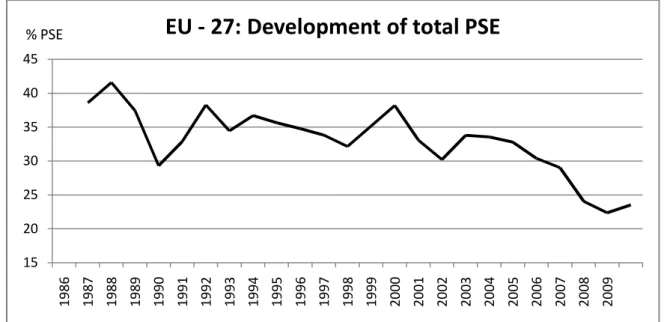
Maltais, Nilsson, & Persson (2002, p. 145) conclude that "the weight of evidence does not [original emphasis] suggest that production changes from trade liberalization and expansion will cause broad sustainability impacts in developed countries". This partial liberalization scenario represents "the most likely implementation of the negotiations agreed at the Doha Ministerial Conference". In the EU, the reduction of trade barriers ('the three pillars') will lead to a fall in domestic prices, more trade (exports will increase by 10%), and all member states will gain economically due to the reduction in aid (but only in the order of 0.1% of GDP).

Summary
Therefore, it is assumed that the impact of trade liberalization on crop diversity will vary widely across regions and commodities. Another important implication of this study is that a general theory of international trade may be too prescriptive and should consider context-specific variables that mediate the effects of trade liberalization (Fraser, 2006). Cooper, Johansson and Peters (2005) also concluded that the environmental effects of agricultural trade liberalization cannot be generalized.
Conclusion
It again showed that the net results of trade policy can be ambiguous and highly heterogeneous between regions. In section 3.3, a literature review of numerous empirical studies has confirmed the assumption that no generalizations can be made about the environmental effects of agricultural trade policy. Marchfeld advocates examining the environmental impacts of trade policies for two reasons.
Objectives of the case study analysis
The next part of the thesis will provide such an assessment for the Marchfeld region. Concrete answers to questions two to four will be derived from the results of the model scenario (Section 4.6). Therefore, the results of the case study should show whether we can expect more or less pollution in the selected trade policy scenarios.
The region Marchfeld
Regional characteristics
I should point out that some of the scenarios described for the case study are quite hypothetical and so are some of the model assumptions (eg I have not included other factors that are likely to influence land use decisions such as: farmers' risk behaviour, climate change, institutional effects, macroeconomic effects, etc.). However, it is not the ultimate goal of this exploratory case study to predict very precisely the magnitude of effects for the scenarios, but rather to show in which direction the change will go. According to Liebhard, Schmid & Sinabell (2004, p. 2) it is "one of the most important and intensive Austrian arable production regions".
Environmental problems
In the medium- or long-term, agriculture is expected to contribute the most to nitrate pollution. Data on nitrate concentrations by municipality, which were observed in the winter of 2004/2005, were used to calculate the parameters for the regression equation. The best fitting equation indicated which variables could explain the high levels of nitrate concentrations.
Data
Environmental data
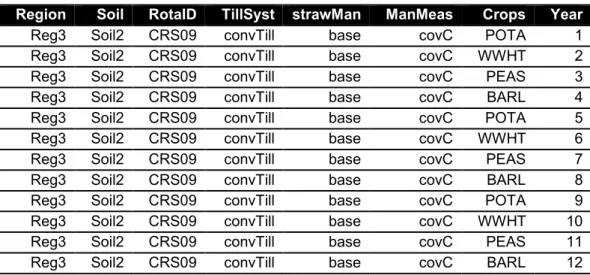
To account for differences, similar land use characteristics (eg crop rotation mixes, participation in environmental programs) are represented by five representative sub-regions (see Figure 9). Data on the observed distribution of crop rotation systems by region and soil were also available (Schmid. & Sinabell, N.A.). Additional crop rotation mixes are created to allow for more land use choices in policy scenarios.

Economic data
Crops included in the case study that were eligible for FKF are: winter barley, spring barley, maize, durum wheat, winter wheat, sunflower, triticale, winter rapeseed, winter rye, sweat soil, potatoes (if not used for starch), early potatoes (if not used for starch) and peas. Premiums for agri-environmental measures are taken from the "Austrian Program for Rural Development BMLFUW, 2007). In the next part I will present the methodology which will be used to analyze the effects of the policy scenarios.
Method
Methodological challenges
Usually, it is quite challenging to obtain precise causal links between trade policies and environmental impacts (Perrin, 2000). The latter effects are omitted in the case study as they are assumed to be exogenous and constant in the short run. Having addressed the important methodological issues, it is now time to present my methodological framework in the previous section.
The methodological framework
The physical characteristics of each field are represented in the vector !,# (which can also account for stochastic effects due to weather), where index is regions and $ is bottoms. First, I'm just focusing on one of the most important environmental indicators in the region, which is nitrogen leaching. Second, the theoretical frameworks above and in the preceding section are believed to be sufficiently representative of how trade policy changes may influence farmer behavior in this region (Antle & Capalbo, 1998).

The Marchfeld model
The environmental impact, -, is determined by CD,E as well as by the choice of management options and crop rotation systems. It can thus be used to simulate the environmental effects of different land use decisions. The average annual gross margin for each crop rotation mix can be derived by dividing the gross margin for each year of the crop rotation by the duration of the crop rotation system (ie 12 years).
Policy scenarios
Development of the CAP
As will be shown in the following sections, the political structure of the CAP has changed profoundly due to several market-oriented reforms since 1992. Therefore, the CAP underwent its most profound reform since it came into existence with the "MacSherry reform" in 1992. This brief overview of the development of the CAP paves the way for the final part.
The Scenarios
It can be seen that whatever policy path the CAP will follow after 2003, the measures will become more and more market oriented. In relation to direct payments, this depicts a situation before the CAP 2003 reform when many linked direct payments were still in place. The next and last section of the case study part presents and discusses the results for the scenarios obtained from the Marchfeld model.
Results
- Economic effects
- Environmental effects
- Effects on land use and management decisions
- Sensitivity Analysis
The choice of rotation system combines only changes in the producer support scenario (4) for region 2. Significant changes are found in the producer support scenario (4.1), where the share of combined measures (mCov) drops to 66% (compared to 83% in the baseline scenario). In the most realistic case (i.e. agri-environmental premiums are in place), support to producers results in higher nitrate pollution in Marchfeld.

Modeling approaches
The modeling approach chosen for the case study falls into both the categories of "mathematical programming models" and "economic-environmental simulation models". I have developed a land use optimization model which will be linked to estimates from the EPIC environmental simulation model. Since many of them analyze the environmental effects of trade liberalization in agriculture at the national or global level, they usually use partial or general equilibrium models.
Commodity prices
Production costs
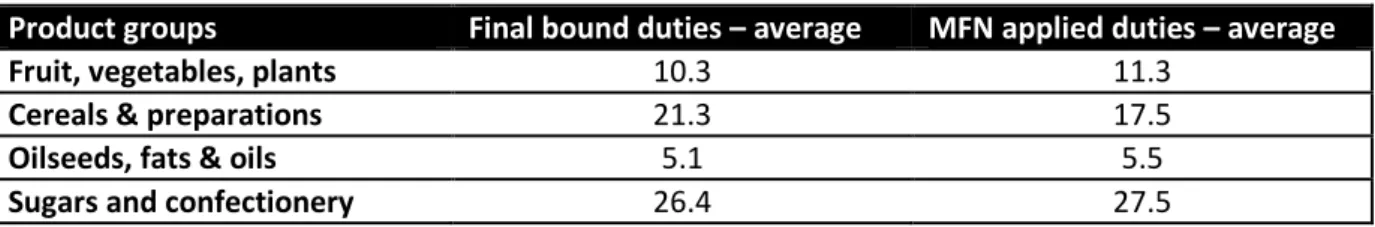
Tariffs and producer support
The World Bank uses the concept of the nominal rate of aid (NRA48) as an indicator of total support to producers. 48 Total NRA by product = NRA on marginal price support + NRA on domestic price support (eg direct production subsidy) + NRA on input.
Land use and management decisions
In CEC, Bewertung der Umweltauswirkungen des Nordamerikanischen Freihandelsabkommens (NAFTA): ein analytischer Rahmen (Phase II) und Problemstudien (S. 65-182). Schmid, Landwirtschaft und Wasser – Verbrauch, Kostendeckung und Schadstoffentwicklung (Österreichische Landwirtschaft und Wasser – Verbrauch, Kostendeckung und Schadstoffentwicklung) (S. 5-46). Landwirtschaft und Wassernutzung, Kostendeckung und Schadstoffentwicklung (Österreichische Landwirtschaft und Wassernutzung, Kostendeckung und Schadstoffentwicklung) (S. 75-84).