Empirical data confirm that increasing yield levels hold great potential for improvement in crop water productivity. The evaluation showed that a model simulation using SWAP can be a suitable tool to check the potential for improving crop water productivity in an agricultural measure at a local scale.
Relevance and Background
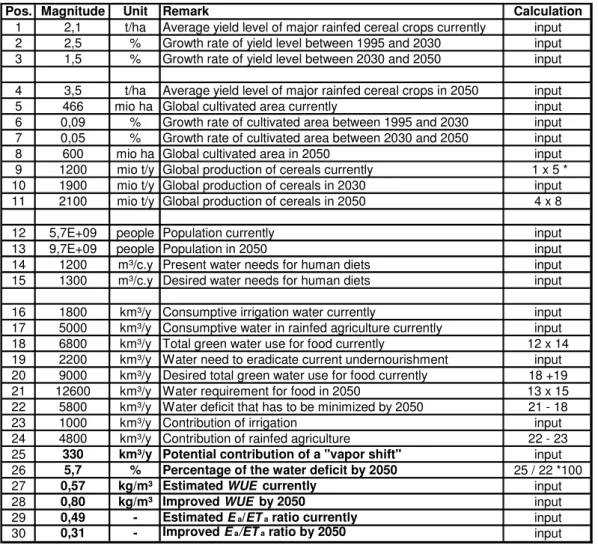
To further explain the “yield per droplet” improvement, a so-called vapor shift term must be introduced. This would represent about 6% of the total global water deficit of 5800 km³/year that needs to be identified to prevent malnutrition (Falkenmark et al. 2004).
Research Objectives and Questions
Frequently used crop and water balance terms will be denoted by their abbreviations further on, except for the conclusions and the summary and the outlook.
Research Methodology
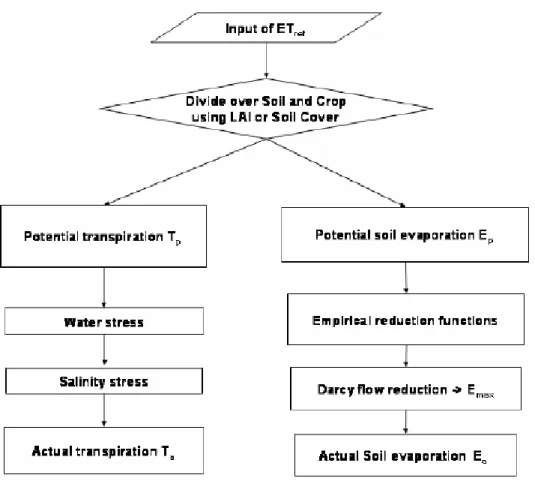
The Soil Water Atmosphere Plant (SWAP) model is used as a tool for evaluation on a local scale. With the implementation of WOFOST (a dynamic explanatory model for crop growth with descriptive elements) in SWAP version 2, it became possible to describe the dynamics of plant growth with its physiological and physical processes more realistically (Dam and Malik 2003).
Introduction
Physical Process Description concerning Plant Transpiration and Soil
Furthermore, the term evaporation in this thesis always refers to the actual soil evaporation Ea. Soil evaporation is thus limited only by the supply of energy to the surface (solar intensity, wind, humidity).
Approach of viewing Crop Water Productivity respectively Water Use
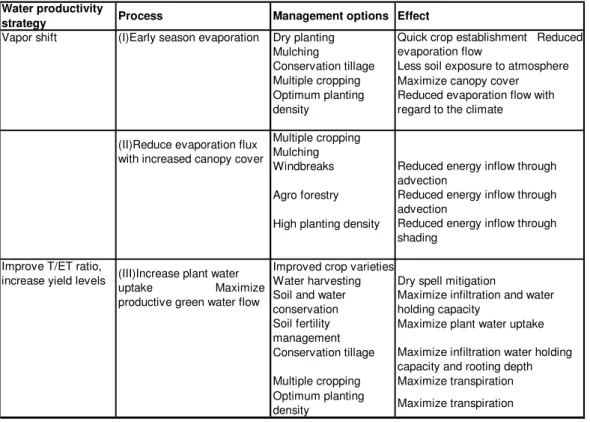
The Vapor Shift Concept
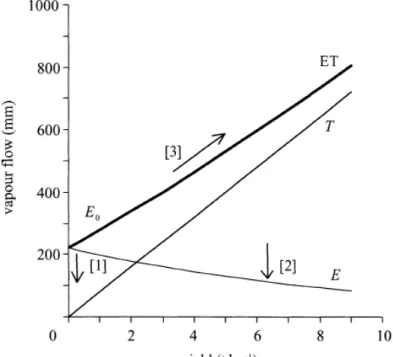
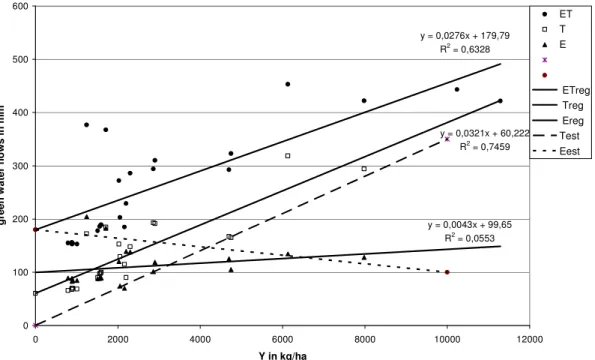
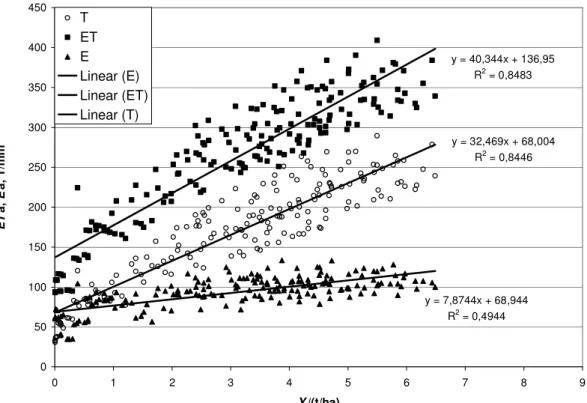
Falkenmark et al. (2004) argue that a reduction in the non-productive evaporative flow may serve to achieve this improvement. The size is determined by the intersection of the evaporation line with the ordinate in figure 3.
Introduction
Basic Approach
With Ea, an attempt is made to distinguish in detail the developmental stages (early, crop development, mid-season, post-season) of the plant. Potential shortcomings of the concept and estimation respectively will be analyzed and an attempt will be made to provide a perspective for further research on this subject.
Analysis and Discussion
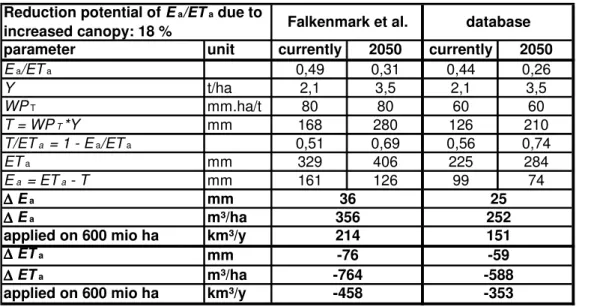
Below, possible ranges for WUE and Ea/ETa from other authors give an idea of the order of magnitude and are useful for comparison with the database. These wide ranges indicate the difficulty and uncertainty associated with a global estimate of the savings potential of Ea. The database season total Ea is 120 mm, which is still 20% lower than the early season Ea suggested by Falkenmark et al. (2004).
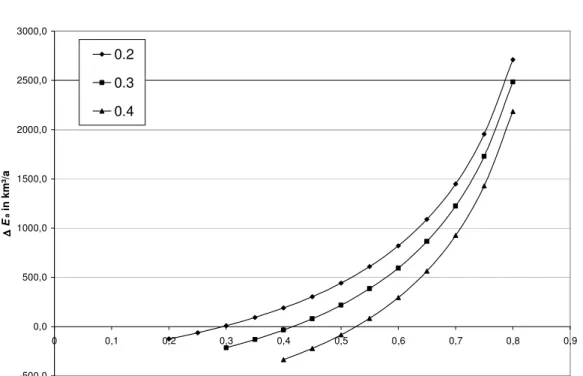
Above this threshold, the assumption of decreasing the absolute value of Ea is valid. 600 m³ t-1 according to the database improves the quality of the fit, but still the function lies above the data points. To support the "dynamic" character of the CWP - Y relationship with numbers, examples will be given for the function located in the database in Figure 9.
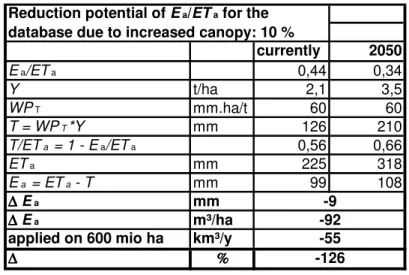
Thus, comparing the estimate by Falkenmark et al. 2004) with the database confirms the assumptions regarding the magnitude of the "vapor shift potential" due to an increased canopy cover. Although there is no definition for a certain LAI threshold value and it is set arbitrarily, the above investigation removes the uncertainty of the reduction potential regarding Ea/ETa.
Conclusions
If actual evapotranspiration varies, it is difficult to relate an improvement in water use efficiency to a vapor shift trade-off (soil evaporation shifts to plant evaporation) or an improvement in relative evapotranspiration (T/ETa). Taking into account the reduction of malnutrition as the main goal, additional water resources must be generated for agriculture anyway, because the contribution of a vapor shift is only a fraction of the total deficit. So it is irrelevant whether or not greater canopy cover is a "true" vapor shift option.
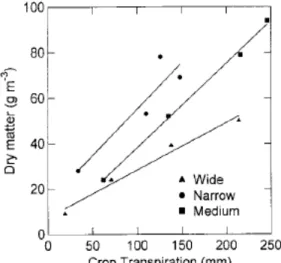
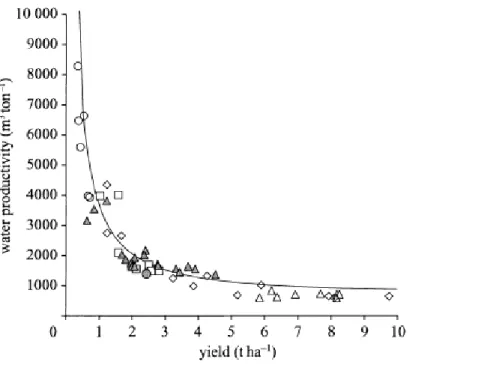
Increasing yield rates or the yield function of water for crops. The collected experimental data confirm the exponential shape of the yield function of crop water biophysical productivity (CWP(Y)). Experimental data show that the low yield range contains a greater potential for improving water use efficiency or crop water productivity than the high yield range. Depending on climate and environmental conditions, it may be valid to assume that crop water productivity is constant above a certain yield level.
It is somewhat difficult to treat increased canopy cover and improved crop water productivity by increasing yield as separate possibilities. If vapor displacement is to be taken seriously as a production and management option, it must be analyzed experimentally and theoretically.
Constraints and Recommendations concerning the practical Evaluation
- Methodology of evaluating the global Estimates of the Vapor Shift
- Methodology of evaluating the Vapor Shift Concept with a
- Evapotranspiration, Canopy Interception, Plant Transpiration and
- Partitioning between Transpiration and Soil Evaporation
- The Influence of the Clothesline Effect on Transpiration and Soil
- The basic Idea of shifting Soil Evaporation towards Plant
- Management Possibilities to reach a Vapor Shift
- Analysis and Discussion: general
- Analysis and Discussion: early Season Soil Evaporation
- Analysis and Discussion: increased Canopy Cover
- Analysis and Discussion: increasing Yield Levels
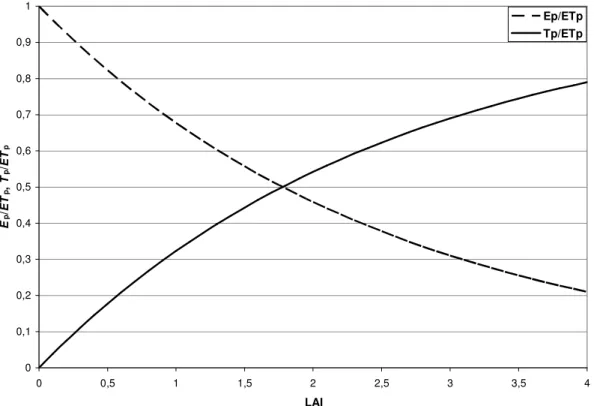
- Analysis and Discussion: Leaf Area Index
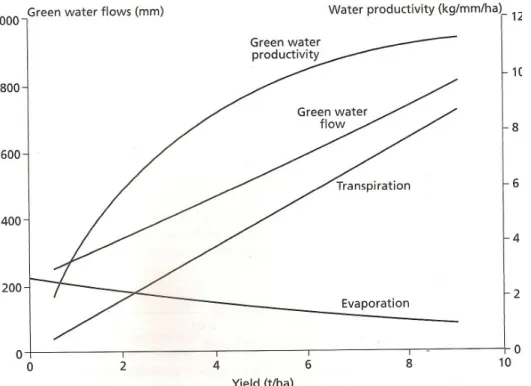
Data for different climate regions. 2004) argue that their concept is useful for global predictions; there would be a need to obtain information about different climate regions. Lack of explicit explanation of time and space scale in the basic concept. Due to different climatic and environmental conditions, there is a large dispersion of green water streams.
Applying the theoretical linear rates on a global scale constitutes a questionable simplification. 2004) define transpirational water productivity as the amount of water transpired to produce a unit of biomass, but within their calculations they correspond to yield and not to total biomass. 4 Practical evaluation of the Vapor Shift concept at a local scale using the hydrological model SWAP.
Introduction
Basic Approach
The method of determining the evaporation flux is essential for the simulation performed, so the calculation procedure in SWAP is described below. Although there remains a great uncertainty in the simulation runs as there was no information on the magnitude of the empirical coefficients for the site-specific situation in Sirsa. The challenge of the empirical approaches is their wide application because of their site-specific nature.
Rewetting of the soil starts for Boesten- Stroosnijder from pF = 3.7 and for Swart from pF = 4.2 to field capacity. This demonstrates the large uncertainty of the magnitude of simulated soil evaporation when data are lacking to determine β empirically. In this chapter, the most relevant settings of the parameters for the simulation runs are described.
Variation of the variables is used for research into the water balance and the growth of crops. The initial groundwater level is prescribed at 300 cm below ground level and free drainage of the soil profile is chosen as the lower boundary condition.
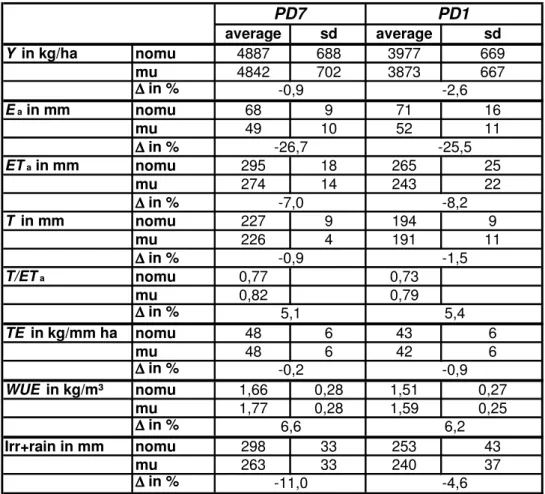
Analysis and Discussion: varying Planting Density
The increasing course of the 12-year average with increasing PD can be described with a logarithmic function (R2 = 0.97). The simulation results suggest a similar progression of CWP with increasing Y when looking at the dynamics of the CWP-Y relationship, see Figure 20. With increasing PD and watering criteria (well watered corresponds to I1 and I2), the data points shift to the lower right section of the graph.
The vertical dispersion of Ea/ETa on PD can be seen as the influence of seasonal changes in climate conditions. The model results can be explained by increased light extinction at high stand density. These jumps correspond to changes in irrigation amounts and can be explained by the chosen irrigation criteria.
Due to the chosen irrigation criteria, it is not possible to analyze the dynamics of the water flows with a constant ETa. For well-watered conditions (pF = 3.0 and 3.6), the optimum in WUE is suggested to be in the high PD ranges.
Analysis and Discussion: mulching
A mulch is "any material such as straw, sawdust, leaves, plastic sheeting, loose soil, etc., that is spread or formed on the surface of the soil to protect the soil and/or plant roots from the effects of raindrops, crusting, freezing, evaporation, etc." (Soil Science Society of America 1997). Mulching reduces the energy load through reflection and absorption of the incoming net radiation and therefore influences the soil temperature. Mulch reduces the temperature and vapor pressure deficit of the air above the ground.
In addition to the effect on Ea, mulch also has a positive effect on the physical protection of the soil surface and thus aggregate stabilization. The principle of roughness and openness of the topsoil applicable to seepage must also be considered for Ea. To minimize the negative effect of the watering criterion, a second run is performed with the lower plant density PD1.
Due to the variation in the amount of irrigation water, it is difficult to clearly determine the reduction in ET. Although Y and therefore the harvest index is assumed to decrease, the simulation shows that WUE will improve due to the stronger influence of T/ETa.
Conclusions
The course of soil evaporation as a function of yield contradicts the proposed theoretical approach to the vapor shift concept, and soil evaporation increases with increasing yield. In other words, the simulation suggests that absolute values of actual soil evaporation decrease with a denser canopy. On a 12-year average, the simulation suggests that relative transpiration (T/ETa) and relative evaporation (Ea/ETa) respectively improve by 7% due to increased plant density.
Considering crop water balance terms with the more differentiated approach, transpiration efficiency shows to increase with increasing plant density. Simulation results with well-watered conditions indicate a continuous increase in water use efficiency with increasing plant density. Twelve season average values of water use efficiency at water scarcity point to an optimal plant density in the low yield range (see Figure 26).
We can conclude that, from the point of view of yield or harvest index, it is not recommended to increase the planting density if there is little water and no additional irrigation is available. The simulation results show an improvement in water use efficiency of about 6% due to the mulch layer at both low and medium planting densities.
Constraints and Recommendations concerning the Model Simulation89
- Research Questions
- Theory of describing the Calculation Procedure of Evaporation in
- Site Description of Sirsa in Haryana State, India
- Parameterization of SWAP for the specific Conditions in Sirsa
- Introduction
- Aspects from Literature concerning Planting Density and expected
- Investigation of a varying Planting Density with regard to the Vapor
- Investigation with Regard to the Crop and Water Balance Terms of
- Aspects from Literature concerning mulching and expected
- Discussion of the Mulch Simulations
- Constraints and Recommendations concerning the Model
- Constraints and Recommendations concerning the
Currently it is not possible in SWAP to prevent root growth in the mulch layer. Due to the one-dimensional nature of the model, it is not possible to take into account the effect of a horizontal water flow that may occur in the root zone during a vapor shift. The aim of this thesis was to evaluate the suggested potential of vapor shift and improvement of crop water productivity by Falkenmark (2004) and Rockstrom (2003).
The global estimate is made with the results of the database and compared with the calculations of Falkenmark et al. The practical evaluation of the vapor shift concept on a local scale showed that the more differentiated approach (Chapter 2.3 b) of looking at crop water productivity and water use efficiency, respectively, is sufficiently accurate. The simulation suggested that the savings potential for early season soil evaporation for winter wheat is only 10% of the value reported by Falkenmark et al.
An optimum of the expected crop water productivity yield ratio was only shown for the irrigation criterion based on permanent wilting point. With regard to a pure shift from soil evaporation to transpiration, the chosen irrigation criterion with its fluctuating water supply complicated the analysis of the simulations.