Today, variations of this cell line are widely used for the production of therapeutic proteins, above all glycosylated or multimeric proteins, since glycosylation of proteins has a strong impact on structure, in vivo biological activity and immunogenicity. Cold stress can also produce changes in the properties of the lipid bilayer, some of which (such as phase transitions) are simply due to the decrease in temperature, while others (such as changes in the fatty acid composition of the membrane) likely reflect a physiological cellular response to cold stress [29]. To learn more about the change in intracellular protein expression during hypothermic cultivation of CHO cells, the chosen proteomic analysis method was 2D DIGE (differential in gel electrophoresis).

Objectives
Materials
- Cells
- Medium for the cell cultures
- Other reagents used in the cell culture
- Kits for the protein sample preparation
- Mass spectrometric analysis
- Reagents for the gels
- Equipment used
- Prepared solutions
- Solutions for cell wash and lysis Preparation of Cell Wash Buffer
- Solutions for the IEF
- Solutions for the SDS-PAGE Preparation of the 10x Running Buffer
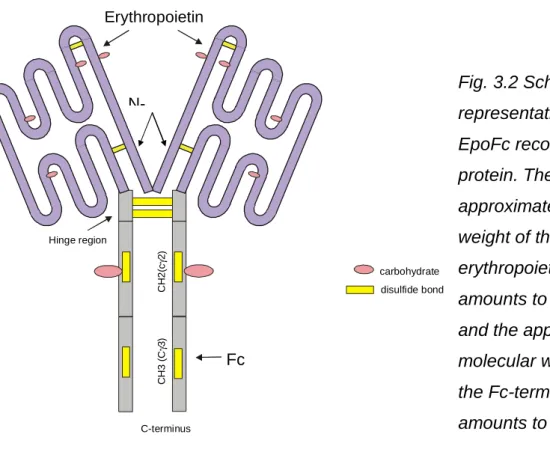
The drug-induced increase in DHFR mRNA levels may be due to increased transcription, decreased mRNA degradation, or mRNA accumulation due to blockage of cells at the G1/S border of the cell cycle, when DHFR gene transcription is maximized. is [51] [52 ]. Due to the glycosylation variants of Epo and the many tools available to target the Fc portion, this fusion protein is a good model to study the production of complex glycoproteins. Preparation of the Standard Cell Lysis buffer – 50 ml substance add final concentration 1 M Tris / HCl 1.5 ml 30 mM.
![Fig. 3.1 [40] Schematic representation of the erythropoietin molecule, showing the glycosylation sites](https://thumb-eu.123doks.com/thumbv2/pubdocorg/274420.42929/14.892.157.669.862.1191/fig-schematic-representation-erythropoietin-molecule-showing-glycosylation-sites.webp)
Methods
Cell revitalisation
Cell cultivation process
Four days later, the cell number and viability of the spinner cultures were determined for the first time. 1 ml of that sample was used for the determination of estimated cell number and viability by the hemocytometer method. The remaining 3 ml of the cell suspension was centrifuged at 381 x g for 10 minutes at room temperature (RT).
![Fig. 4.1 [55] Composition of the biosensor – The YSI membranes consists of three layers](https://thumb-eu.123doks.com/thumbv2/pubdocorg/274420.42929/30.892.206.752.326.663/fig-composition-biosensor-ysi-membranes-consists-layers.webp)
Measurement principles for the special analytes [55]. 1) The D-glucose is oxidized in the presence of the immobilized glucose oxidase, which produces hydrogen peroxide and glucono-lactone.
- Cell wash and lysis
- Protein Clean-up
- Protein quantification
- Principle of 2D DIGE
- Protein minimal labelling by CyDye
- IEF – 1 st Dimension
- Rehydration of the IEF gel strips - procedure
- IEF – first dimension run
- SDS PAGE – 2 nd Dimension run
- Preparations
- Re-equilibration of the Dry strips
- The second dimension
- Gel scanning and storing
- Gel analysis by DeCyder
- Staining and picking of the gels
The electron flow is proportional to the concentration of H2O2 and, therefore, to the concentration of the substrate. The 2D purification kit from Amersham Bioscience was used to purify the protein samples. For the determination of the protein concentration in the samples, the 2D Quant Kit from Amersham Bioscience was chosen.
Important for the binding efficiency of CyDyes to the proteins is the pH value of the sample buffer (Standard Cell Lysis buffer). The anodic (+, pointed) end of the dry strip was directed to the pointed end of the strip holder. The contact of the metal needles with the surface of the copper wire was checked.
The anode of the dry strip was on the left side and the gel side faced the windshield. The separation was terminated just before the blue front (bromophenol blue) reached the end of the gel. Red areas indicated that the laser intensity was too high and needed to be lowered.
The gels were placed in the staining solution (see 3.8.4 for the preparation of the solution), and the container was transferred to a rotary shaker and the gels were incubated overnight.
![Fig. 4.2 [56] Schematic structure of the Ettan DIGE method, starting with the extraction of the proteins, their labelling and the two dimensional separation](https://thumb-eu.123doks.com/thumbv2/pubdocorg/274420.42929/35.892.151.797.110.433/schematic-structure-starting-extraction-proteins-labelling-dimensional-separation.webp)
Results and discussion
Description of the experimental setup
Batch cultures
- CHO K1PD
- CHO dhfr −
- CHO EpoFc 3F8
- CHO EpoFc 14F2
- Comparisons and general conclusion Host cell lines
1 The growth curve and viability of CHO K1PD during the 33 °C and 37 °C cultivation. 2 The concentration of glucose, lactate and glutamine in CHO K1PD during the 33 °C and 37 °C cultivation. 3 The glucose and glutamine uptake rate and lactate production rate of CHO K1PD during the 33 °C and 37 °C cultivation.
4 The growth curve and viability of CHO dhfr− during the 33 °C and 37 °C cultivation. 5 The concentration of glucose, lactate and glutamine in CHO dhfr− during the 33 °C and 37 °C cultivation. 6 The glucose and glutamine uptake rate and lactate production rate of CHO dhfr− during the 33 °C and 37 °C cultivation.
7 Growth curve and stability of CHO EpoFc 3F8 during 33 °C and 37 °C cultivation. 8 Glucose, lactate and glutamine concentration of CHO EpoFc 3F8 during 33 °C and 37 °C cultivation. 12 Rate of glucose and glutamine uptake and rate of lactate production of CHO EpoFc 14F2 during 33 °C and 37 °C cultivation.
The glucose and glutamine uptake rate and the lactate production rate of the 33 °C and the 37 °C culture were similar.

Experimental design of the 2D-gels
Results of the DeCyder analysis
- Analysis of all the samples
- Analysis of the host cell lines
- Analysis of the recombinant cell lines
- Analysis of the 33 °C cultures of the host ce ll lines compared to the 33 °C of the recombinant cell lines
- Analysis of the 37 °C cultures of the host ce ll lines compared to the 37 °C of the recombinant cell lines
- Analysis of each cell line by comparing the protein expression of the 33 °C culture to the 37 °C culture
- Analysis of the differences in protein expression between the two time points of sampling
This analysis was performed to obtain information about the different protein expression of the host cell lines. Comparison of protein expression of host and recombinant cell lines in tp 1. Comparison of protein expression of host and recombinant cell lines in tp 2.
26 Comparison of the protein expression of the host and the recombinant cell lines at tp 1 – These proteins were expressed higher in the host cell lines at tp 1. 27 Comparison of the protein expression of the host and the recombinant cell lines at tp 1 – These proteins were higher at expression in the recombinant cell lines at tp 1. 28 Comparison of the protein expression of the host and the recombinant cell lines at tp 2 – These proteins were more highly expressed in the host cell lines at tp 2.
29 Comparison of the protein expression of the host and the recombinant cell lines at tp 2 – These proteins were expressed higher in the recombinant cell lines at tp 2. 30 Comparison of the protein expression of CHO EpoFc 3F8 at tp 1 and tp 2 – These proteins were higher expressed at tp 1. 32 Comparison of protein expression of CHO EpoFc 14F2 at tp 1 and tp 2 – These proteins were higher expressed at tp 2.
33 Comparison of the protein expression of CHO K1PD at tp 1 and tp 2 - These proteins were more highly expressed at tp 1.
Results of the MS analysis
They participate in the correct folding and in the formation and transfer of disulfide bridges of proteins synthesized in the rough ER, imported into the lumen of this structure and intended for secretion or incorporation into the cell membrane. As chaperones, they are part of the quality control system for the correct folding of proteins on the rough ER, while as redox catalysts, due to their thioredoxin-like active sites, they are important for cellular redox homeostasis. In case of redox potential stress for cells, after treatment of cells with oxidants such as H2O2 or NAC (N-acetyl-L-cysteine), ERp57 was strongly increased [68].
Lipoamide dehydrogenase [70], a homodimeric FAD-dependent disulfide reductase, is usually described as the common component E3 of the mitochondrial 2-oxoacid dehydrogenase multienzyme complexes. These complexes catalyze the oxidative decarboxylation of 2-oxoacids (pyruvate, 2-oxoglutarate and the three short-branched 2-oxoacids produced by transamination of the amino acids leucine, isoleucine and valine) to the corresponding acyl-CoA derivatives. The lipoamide dehydrogenase has a redox disulfide and a tightly but non-covalently bound FAD cofactor, both of which participate in the electron transfer from dihydrolipoamide to NAD + [78].
It is encoded by the PDIA6 gene and a member of the protein disulfide isomerase family as described above.
Description and discussion of the proteomic results
Protein 1428 is more downregulated in the host cell lines with an average ratio of 2.58 than in the recombinant cell lines with an average ratio of 1.78. By comparing the up-regulated proteins, proteins 864 (with a difference of 50% in the expression level) and 1682 (with a difference of 36% in the expression level) were higher up-regulated and higher expressed respectively at 33 °C in the recombinant cells, while protein 1116 was up-regulated almost identically in both cell line groups. By comparing the two analyzes of the 33°C cultures 5.4.4 and the 37°C cultures 5.4.5, the following differences of the protein expressions emerged.
The recombinant cells in the 37 °C cultures had slightly higher protein expression of proteins 713 (with a 30% difference in expression level), 1043 (with a 38% difference in expression level) and 1475 (with a 27% difference in expression level) than the recombinant cells grown at 33 °C. Protein 849 was found in the analysis of the 33°C cultures and had a very high relative expression rate (mean ratio of -3.37) in the host cells compared to the recombinant cells. When comparing protein expression in the cell lines at 33 °C and 37 °C incubation temperature (5.4.6), the following differences in protein expression were found.
CHO EpoFc 3F8 had the highest down-regulation effect or the largest decrease in protein expression in culture at 33 °C with an average ratio value of 2.28, followed by CHO K1PD with a value of 2, CHO EpoFc 14F2 with a value of 1.78 and CHO dhfr- z a value of 1.55. CHO EpoFc 3F8 again showed the highest down-regulation with a mean ratio value of 2.21, followed by CHO K1PD with a value of 2.08 and CHO EpoFc 14F2 with an insignificant value of 1.32. The result of the analysis comparing the expression of proteins in the exponential phase and the stationary phase showed that all cell lines have different proteins expressed differently.
Concluding remarks
12] Active hypothermic growth: a novel way to increase total interferon-γ production by Chinese hamster ovary cells. 13] Maximization of interferon-γ production by Chinese hamster ovary cells by temperature shift optimization: experimental and modeling. 17] Effect of low culture temperature on specific productivity, transcript level and heterogeneity of erythropoietin in Chinese hamster ovary cells.
18] Effect of low culture temperature on specific productivity and transcription level of anti-4-1BB antibodies in recombinant Chinese hamster ovary cells. 19] Effect of culture pH on erythropoietin production by Chinese hamster ovary cells cultured in suspension at 32.5 and 37.0 °C. 20] Enhanced effect of low culture temperature on specific antibody productivity of recombinant Chinese hamster ovary cells: clonal variation.
23] Increased transcript level of RBM3, a member of the glycine-rich RNA-binding protein family, in human cells in response to cold stress. 32] Oxygen-regulated expression of RNA-binding proteins RBM3 and CIRP by a HIF-1-independent mechanism. 51] In vitro and in vivo analysis of transcriptional control of the dihydrofolate reductase gene in serum-stimulated mouse fibroblasts.
70] Interaction between the lipoamide-containing H protein and the lipoamide dehydrogenase (L protein) of the glycine decarboxylase multienzyme system.
![Fig. 4.3 [56] Principle of gel matching by internal standard.](https://thumb-eu.123doks.com/thumbv2/pubdocorg/274420.42929/36.892.158.804.112.459/fig-principle-gel-matching-internal-standard.webp)
![Fig. 4.4 [56] Binding of CyDye fluorochromes to the lysine residue of a protein with the NHS ester active group](https://thumb-eu.123doks.com/thumbv2/pubdocorg/274420.42929/37.892.188.770.124.319/binding-cydye-fluorochromes-lysine-residue-protein-ester-active.webp)
![Fig. 4.5 [56] Gel caster with the capacity for six gels.](https://thumb-eu.123doks.com/thumbv2/pubdocorg/274420.42929/40.892.272.669.615.993/fig-gel-caster-capacity-gels.webp)
![Fig. 4.6 [56] Preparation of the Ettan Dalt six apparatus. A The 1x Running Buffer / anode buffer was poured into the container up to the first fill line (B in picture D)](https://thumb-eu.123doks.com/thumbv2/pubdocorg/274420.42929/42.892.155.449.526.1142/preparation-ettan-apparatus-running-buffer-buffer-container-picture.webp)
