A Risk Assessment of Bluetongue Disease in Austria
Master Thesis
for the Degree of Master of Science (MSc), University of Natural Resources and Applied Life Sciences, Vienna, Austria
Presented by Katja Silbermayr
Mag.vet.med.; Bakk.rer.nat.
Vienna, February 2009
MSc Natural Resources Management and Ecological Engineering NARMEE - International Joint Master Programme -
Supervisor: Univ-Doz. Dr. Klemens Fuchs,
Austrian Agency for Health and Food Safety Co-Supervisor: Univ. Prof. Dr. Klaus Hackländer,
University of Natural Resources and Applied Life Sciences, Austria Co-Supervisor: Univ. Prof. Dr. Crile Doscher,
Lincoln University, New Zealand
Acknowledgements
This work could only be realized because of generous contributions of the people involved in this cooperative work. It was jointly conducted by the Austrian Agency for Health and Food Safety (AGES), the University of Natural Resources and Applied Life Sciences (BOKU) in Austria and Lincoln University in New Zealand.
In particular, I wish to thank my supervisor Dr. Klemens Fuchs, head of the Data, Statistics and Risk Analysis Division at AGES in Graz. He has supported and advised me during the entire course of this project and always assisted and encouraged me in my work. The positive outcome of this thesis can be attributed to his support and effort.
I would also like to thank my two co-supervisors. Dr. Klaus Hackländer, head of the Wildlife Biology and Game Management Institute at BOKU, has supported me in the collection of data and has inspired me consider different perspectives.
Dr. Crile Doscher, from the Environment, Society and Design Division at Lincoln University, has introduced me to the fascinating discipline of Geographic Information Systems. Without his motivating, exciting and encouraging tuition this project wouldn’t have been realized.
Furthermore, I would like to thank Dr. Josef Köfer, who has inspired the formulation of this thesis and has given rise to my enthusiasm for veterinary epidemiology.
I am much obliged to Peter Sehnal who provided me with fundamental data on Culicoides trapping and basic entomological advise.
My thank goes to Dr. Wilhelm Berg for his assistance and patience in sending spatial data from Austria to the other side of the world.
Throughout this thesis writing many people provided encouragement, sound advice and motivation.
Sincere thanks to all of you.
Table of Contents Page
1. Abstract - English 4
2. Zusammenfassung - Deutsch 5
3. Introduction 6
3.1. Surveillance and Monitoring 6
3.2. GIS in Epidmiology 6
4. Bluetongue Disease 7
4.1. Hosts of bluetongue disease 7
4.2. Vectors of bluetongue disease 7
4.3. GIS in bluetongue disease research 8
5. Objectives of this thesis 8
6. Material and Methods 9
7. Results 9
A spatial risk assessment of Culicoides spp. distribution and bluetongue disease risk areas in Austria.
Journal of Preventive Veterinary Medicine
8. Discussion and suggestions 24
9. References 25
10. Appendix 30
1. Abstract - English
Bluetongue Disease (BTD) is internationally recognised as a notifyable disease with great economical relevance. In the summer of 2006 this vector-borne disease was introduced into Northern Europe and has since affected most European countries.
Culicoides biting midges are cyclic vectors of the bluetongue disease virus (BTV). In
the recent outbreaks the main vector C. imicola was absent and palearctic
Culicoidesspecies like C. obsoletus and C. pulicaris were detected. In this study the distribution of
Culicoides spp. in Austria is analysed and the Bluetongue Disease risk zones aredetermined. Culicoides spp. abundance data was collected from weekly catches of 14 months originating from 54 trapping locations. The corresponding weather data of the trapping day derived from neighbouring meteorological stations. From the total of 7.523.947
Culicoides spp. caught, 90,3 % were classified to the C. obsoletuscomplex. To detect a correlation of weather and
Culicoides spp. distribution 186meteorological stations (years 1997 – 2007) were analysed. The regression model using R (R 2.8.0, http://CRAN.R- project.org) assigned a highly significant probability of mean temperature (P< 0.001) and wind (P< 0.001) and a significant probability of relative humidity (P=0.019) and altitude (P=0.059). The majority of catches (>1000 individuals) were found at temperatures above 10° C and at relative humidities between 65 to 80 %. The point data of the significant parameters mean temperature and relative humidity were subsequently interpolated using the ESRI ArcGIS
TMversion 9.3 Geostatistical Analyst tool Kriging. In a raster analysis those regions providing optimal temperature and humidity conditions were separately investigated in all four seasons. In addition data of cattle density were included to create a risk map. The season of summer holds the greatest risk of a BTD epidemic with 25.9 % of the analysed area providing optimal conditions for vector abundance and 12.4 % providing contact risk with ruminant host.
The results of this project provide fundamental data on the distribution of Culicoides
spp. in Austria, determine limiting climatic parameters, model most favourable Culicoides habitats and identify risk areas by including possible host interaction.2. Zusammenfassung - Deutsch
Die Blauzungenkrankheit (BTD) ist aufgrund ihrer hohen wirtschaftlichen Relevanz international als anzeigepflichtige Tierseuche anerkannt. Im Sommer von 2006 ist diese, durch Vektoren übertragene Krankheit, erstmals in Nordeuropa aufgetreten und hat seitdem in die meisten Europäischen Länder Einzug gehalten.
Culicoides Gnitzen sindzyklische Vektoren des Blauzungenvirus (BTV). Überträger der letzten Ausbruchsserie war allerdings nicht der Hauptvektor
C. imicolasondern palearktische Culicoidesarten wie
C. obsoletus und C. pulicaris. Diese Studie analysiert die Verbreitung von Culicoides spp. in Österreich und identifiziert Risikozonen für einen potentiellenAusbruch der BTD. Daten über das Vorkommen von
Culicoides wurden mit Hilfe von51 wöchentlich aufgestellten Gnitzenfallen über 14 Monate hinweg erhoben. Die entsprechenden Wetterdaten des Fallentages wurden von benachbarten Wetterstationen der Zentralen Anstalt für Meteorologie und Geodynamik (ZAMG) angefordert. In Summe wurden 7.523.947
Culicoides Individuen gefangen wobei 90,3 % dem C.obsoletus Komplex zugeordnet werden konnten. Klimadaten von 186 Wetterstationen
der Jahre 1997 bis 2007 wurden analysiert um mögliche Korrelationen mit der
Fanghäufigkeit der Gnitzen zu ermitteln. Das Regressionsmodell mittels R (R 2.8.0,
http://CRAN.R-project.org) konnte eine hoch signifikante Korrelation zur mittleren
Tagestemperatur (P< 0.001) und Wind (P< 0.001) sowie eine signifikante Korrelation
zur relativen Luftfeuchtigkeit (P=0.019) und Seehöhe (P=0.059) festgestellen. Die
meisten Fänge (>1000 Individuen) wurden bei Temperaturen über 10° C und einer
Luftfeuchtigkeit zwischen 65 – 80 % verzeichnet. Die Punktdaten der signifikanten
Parameter Tagestemperatur und Luftfeuchtigkeit wurden mit Hilfe der Funktion Kriging
des Geostatistical Analyst, ESRI ArcGIS
TMVersion 9.3 interpoliert. In einer
Rasteranalyse wurden diejenigen Regionen in denen optimale Temperatur- und
Luftfeuchtigkeitsbedingungen herrschen, in allen Jahreszeiten näher untersucht. Durch
Berücksichtigung der Populationsgrößen von Rinder-, Schafen-, und Ziegenpopulationen
wurden Risikokarten erstellt. Sommer ist die Jahreszeit mit der größten geographischen
Verbreitung der Vektoren (25.9 %) und den meisten Gebieten mit hohem Risiko eines
BTD Ausbruches (12.4 %). Diesen Risikogebieten kann in Zukunft durch die Installation von Überwachungsprogrammen verstärkt Aufmerksamkeit geschenkt werden.
3. Introduction
Animal Diseases have an enormous impact on public health, food supply, economies, environment and biodiversity (Kuiken et al., 2005). The Office International des Epizooties (OIE) was acknowledged by the World Trade Organization (WTO) Sanitary and Phytosanitary (SPS) Agreement as the “competent international organisation for developing international standards, guidelines and recommendations relating to animal diseases and zoonoses” (WTO, 1994; Schudel et al., 2004). All 172 member countries of the OIE are obliged to report any animal disease occurrence through the International Early Warning System of the Animal Health Information System.
Monitoring and surveillance systems (MOSSs) of animal diseases aim to manage and control animal pathogens (Doherr & Audige 2001).
3.1. Surveillance and Monitoring
MOSS are used to assess the level of infection prevalence, the efficiency of control measures and to document freedom of disease. Monitoring programs describe disease trends over time and therefore provide information of the current disease status. Surveillance programs interpret the collected information (Doherr & Audige 2001) and are integral parts of disease control programmes (OIE 1998, 2000a; European Commission 2000). The OIE is a platform for standardized monitoring and surveillance design and provides quality measures for international trading partners (OIE Chapter 8.3; Schudel et al., 2004). Contingency plans for disease outbreaks include culling policies to control pathogen spread and to protect the international trade. Sound monitoring and surveillance methods facilitate effective measures to counteract epidemics and thereby contribute to animal welfare.
Vector surveillance programms are installed to assess the occurrence and distribution of Arboviruses (OIE - Terrestrial Animal Health Code, Schudel et al., 2004). In Article 8.3.19. the OIE states that the main purpose of vector surveillance is to isolate high-, medium-, and low risk zones and is particularly important for defining potential areas of spread. Vector surveillance can be used to optimize vector suppression strategies (OIE Chapter 8.3).
3.2. GIS in Epidemiology
Geographic Information Systems have been increasingly used throughout the field of Epidemiology for the recording of disease information, modelling of disease spread and the design of surveillance and monitoring programs. GIS is used when data needs to be connected with geographical locations to provide a picture of epidemiological processes (Norstrom 2001). Renowned international organizations like the World health Organization have established GIS based programmes for disease prevention and elimination (WHO, 2006). The benefits of visualisation, spatial data generation and sharing with other relevant public health institutions are particularly useful (Shuai et al., 2007).
In veterinary epidemiology GIS is advantageous in case of a disease outbreak for the prevention of spread and management of epidemiological strategies for eradication. In the last decade GIS use in veterinary medicine has evolved to become an integral part in decision support systems for the control of animal diseases and real-time animal disease surveillance systems (WHO, 1993). Among the animal diseases, BTD has received great attention in recent years as the latest epidemic in Europe demonstrates (Meiswinkel et al., 2008, Mehlhorn et al., 2007, Saegerman et al., 2008, Wilson & Mellor 2008).
4. Bluetongue Disease
Bluetongue disease (BTD) is a non-contagious disease caused by the Bluetongue disease virus (BTV). This vector-borne animal disease was first introduced into northern Europe and is noted due to its great economical relevance since it entails international restrictions in trade of animals and their productions (OIE, 2006). BTD was first introduced into Central Europe in August 2006 when the exotic serotype 8 of Bluetongue Virus was establish in the area of Maastricht, Holland. The disease, which up to then was thought to be limited to regions between latitudes 35° South and 40°
North (Gómez-Tejedor, 2004), suddenly appeared at latitudes of more than 50° North, in Belgium, Germany and the Netherlands (Anonymous 2006a, b, c). Subsequently the virus has spread to the adjacent countries of France, Luxembourg and Germany and has presently affected most European countries (Mehlhorn et al., 2007; Saegerman at al., 2008)
4.1. Hosts of bluetongue disease
BTV infection has high rates of morbidity and mortality in sheep, whereas in cattle the disease tends to be subclinical (Bowne, 1971, Mellor & Boorman, 1995). The recent outbreak of serotype 8, however demonstrate a more severe virulence in cattle towards cattle (Thiry et al., 2006).
BTD introduces the name-giving cyanotic blue tongue due to an oedema in the pharyngeal cavity and ambiguous symptoms like fever, swelling of the face and excessive salvation (Mehlhorn et al., 2007).
In North America, mortality and morbidity due to the infection with BTV have been documented in wild ruminants (Stallknecht & Howerth 2004) and in Australia BTV specific antibodies have been recorded from buffalo (St George, 1985; Ward 1994). In Spain BTD was detected in five different ruminant species (Ruiz-Fons et al., 2008) and in Belgium captive yaks were tested positive for BTD (Mauroy et al, 2008). This information suggests that European wild ruminants can be associated with the epidemiology of BTD. However, little work has been carried out on the involvement of the native wild ruminant species in BTV incursions into Europe.
According to Chapter 8.3 OIE wild ruminant populations should be included in surveillance programs but in contrast to domestic animals this not bound to a distinct international reporting convention (Kuiken et al., 2005).
4.2. Vectors of bluetongue disease
BTV infection of ruminants co incidents with the distribution of Culicoides biting midge species that are biological vectors of the virus (Gorman et al., 1983; Verwoerd & Erasmus 2004).
Culicoides biting midges are classified to the Diptera order and are tiny flies of about 1–3 mm in length (Meiswinkel et al., 1994). The transmission of BTV takes place via a bite of an adult female Culicoides which relies on a blood meal for the egg production (Wittmann et al., 2000). Infected midges remain infective for life (Gibbs and Greiner, 1994). The high concentration of virus in the salivary ducts of infectious vectors makes the BTV transmission extremely efficient and in most cases the bite of a single midge will result in the infection of a susceptible host (O’Connell, 2002).
Culicoides imicula is the main vector of BTD, however in some of the regions with recent outbreaks C. imicola was absent and Palearctic Culicoides species were detected (Purse et al., 2007).
The spread of BT in Europe led the European Commission to ask the Animal Health and Welfare Panel (AHAW) of the European Food Safety Authority (EFSA) to deliver advice on the BT vector species. The knowledge gaps in BTD vector occurrence promted EFSA to recommended Member States “to carry out analysis on the life patterns of bluetongue virus vectors” (EFSA, 2008). In Austria a Culicoides surveillance programme was initiated by the Ministry of Health, Family and Youth (BMGFJ) in June 2007 and implemented by the Museum of Natural History in collaboration
with the Agency for Health and Food Safety (AGES). For the first time an assessment on entomological trapping and classification of Culicoides spp. was conducted in Austria. The trapping was performed on a weekly basis with Onderstepoort light traps operated from dusk until down as described by Goffredo & Meiswinkel, 2004 (see Appendix 9.17).
The central role of the insect in BT epidemiology makes the prevalence of the disease dependent on ecological, climatic and environmental characteristics. These factors exert a substantial influence on the transmission potential of BTD. In Europe the disease has a seasonal occurrence (Purse et al., 2004) and temperature is the major factor influencing the vector capacity of Culicoides transmitting BTV. Temperature is the limiting parameter, which prevents the shift of C. imicula appearance to cooler regions (Sellers & Mellor, 1993; Purse et al., 2007).
Vector capacity provides a measure of disease risk including vector competence, vector abundance, biting rates and incubation period (OIE Chapter 8.3)
4.3. GIS in bluetongue disease research
In the last decade, a number of studies have attempted to evaluate and model the effect of climate on the presence and distribution of BTD and its vectors. Recent studies have demonstrated that GIS can be an accurate tool to classify territories in relation to their suitability to harbour Culicoides species. In Italy, for instance, GIS based prediction maps were drawn to comparison with methods using Culicoides light-trapping and counting to analyse the insect’s favourable habitat (Conte et al., 2003, 2007). Koslowsky et al (2004) has successfully used GIS to identify risk zones for the transmission of BTV in Germany. In Switzerland (Racloz et al., 2008) GIS was used in the design of a larger and targeted national BTD surveillance program. These models have especially focused on climate factors to discriminate the vector habitat. The study of Purse published in 2007 incriminated bluetongue virus vectors across southern Europe by using climate envelope models.
His study indicated that the presented models are broadly consistent with recent subcontinental studies of Culicoides distribution (Conte et al., 2003; De Liberato et al., 2003; Purse at al., 2007;
Wittmann et al., 2001). The successful outcomes of these studies verify the usefulness and importance of geographic information systems in the further investigation of BTD throughout Europe.
The examination of climate and vector population patterns reveals potentially powerful predictive relations for all vector-borne diseases. These associations can be used to make forecasts of vector hot-spots on a spatial scale using real-time climate data (Anyamba et al., 2009).
5. Objectives of this thesis
Investigations about the occurrence of Culicoides spp. in Austria have started in June 2007 (Sehnal, 2007). The findings provide a basis for the understanding of the effects of climate on Culicoides distribution, timing and abundance. However, not only the knowledge on the local occurrence but also the geographic distribution of indigenous Culicoides species in Austria is essential to ensure effective measures can be applied to counteract the spread of Bluetongue Disease. This project draws from the information gathered in the trapping project to map out the distribution of Culicoides spp.
Previously no data was available on the distribution of Culicoides habitat in Austria. The aim of this thesis was to create a model that pinpoints flag areas of increased suitability for Culicoides spp.
habitats by analysing preferred climate conditions.
The understanding of environmental parameters that influence the distribution, seasonality and abundance of BTD vectors, could guide surveillance and control measures at local and national level. This analysis of spatial information is going to be an important resource for animal health officials in the design of a targeted BTD surveillance program. High-risk areas can be provided with special attention in order to avert an endemic of Bluetongue Disease in Austria.
6. Material and Methods
The provided trapping data from June 2007 until October 2008 was analysed in conjunction with the corresponding daily weather data from meteorological stations in close proximity to the trapping locations (Austrian Central Institute for Meteorology and Geodynamics – ZAMG). The weather data was provided in Excel sheets, each containing the information for one meteorological station.
After literature review it was decided to use the absolute minimal daily temperature, mean daily temperature, wind speed, mean daily relative humidity and mean daily precipitation out of 30 provided parameters (see 9.1). Each trapping day was attached with the corresponding weather measurements. Incomplete trapping or weather data was omitted resulting in a total of 2588 entries.
For the regression and correlation analysis in R 2.8.0 (http://CRAN.R-project.org), the exact altitude of the trapping location was included into the data matrix.
For each trapping location the median of catches and of the climatic parameters was calculated for each month and three months averaged to form one season. The seasonal data was used for the subsequent spatial analysis.
To create a climate map of Austria the monthly averages of weather data originating from 186 meteorological stations were used. The median for the same five parameters as for the statistical analysis was calculated from the years 1997 to 2007. The exact locations of all 186 meteorological stations were georeferenced and incorporated into ArcGISTM Version 9.3 (Redlands, CA, USA).
Following experimental analysis with the interpolation techniques Spline and Inverse Distance Weighted (IDW), the interpolation tool ordinary Kriging of the Geostatistical Analyst module of ESRI ArcGIS was used to estimate the values for each grid cell. Thereby a continuous surface from the meteorological sample points and the trapping locations was created. For the altitude a digital elevation model in the Lambert Conformal Conic coordinate system and a 100 m resolution was used. Interpolating the vector occurrence of all four seasons created the Culicoides spp. distribution map. Altitudes above the threshold of 1300 m were excluded.
Culicoides abundance maps were created using the climate parameters identified in the statistical analysis. The climatic preferences of endemic Culicoides spp. were defined as 10 - 20.03 °C temperature with an average of 65 – 80 % relative humidity respectively. The cell value of one was assigned to Culicoides spp. existence and optimal vector abundance ranges of temperature and relative humidity. The three reclassified binary layers were weighted according to their parameter (slope) values and joined using the Map Algebra function “addition” for the creation of abundance maps. For the construction of risk maps stock density data of cattle, sheep and goats was obtained from “Statistic Austria”. After combining the layers into a 1km² resolution possible points of contact could be determined. The risk maps visualize areas of Culicoides spp. abundance combined with areas of domestic ruminant host contact. Those regions are hosting a high risk of a potential BTD outbreak.
7. Results
The overall result of this Master thesis was the writing of a scientific paper for the Journal of Preventive Veterinary Medicine.
Preventive Veterinary Medicine
A Spatial risk assessment of Culicoides spp. distribution and bluetongue disease risk areas in Austria
K. Silbermayr a,b*, K. Hacklaender b, C. Doscher c, K. Fuchs a
a Austrian Agency for Health and Food Safety (AGES), Division of Data, Statistics and Risk Management, Beethovenstrasse, 8010 Graz, Austria
b University of Natural Resources and Applied Life Sciences, Institute of Wildlife Biology and Game Management, Gregor Mendelstrasse, 1180 Vienna, Austria
c Lincoln University, Environment, Society and Design Division, P.O. Box 84, Canterbury, New Zealand
________________________________________________________________________________
Abstract
Bluetongue Disease (BTD) is internationally recognised as a notifyable disease with great economical relevance. In the summer of 2006 this vector-borne disease was introduced into Northern Europe and has since affected most European countries. Culicoides biting midges are cyclic vectors of the bluetongue disease virus (BTV). In the recent outbreaks the main vector C.
imicola was absent and palearctic Culicoides species like C. obsoletus and C. pulicaris were detected. In this study the distribution of Culicoides spp. in Austria is analysed and the Bluetongue Disease risk zones are determined. Culicoides spp. abundance data was collected from weekly catches of 14 months originating from 54 trapping locations. The corresponding weather data of the trapping day derived from neighbouring meteorological stations. From the total of 7.523.947 Culicoides spp. caught, 90,3 % were classified to the C. obsoletus complex. To detect a correlation of weather and Culicoides spp. distribution 186 meteorological stations (years 1997 – 2007) were analysed. The regression model using R (R 2.8.0, http://CRAN.R- project.org) assigned a highly significant probability of mean temperature (P< 0.001) and wind (P< 0.001) and a significant probability of relative humidity (P=0.019) and altitude (P=0.059). The majority of catches (>1000 individuals) were found at temperatures above 10° C and at relative humidities between 65 to 80 %.
The point data of the significant parameters mean temperature and relative humidity were subsequently interpolated using the ESRI ArcGISTM version 9.3 Geostatistical Analyst tool Kriging. In a raster analysis those regions providing optimal temperature and humidity conditions were separately investigated in all four seasons. In addition data of cattle density were included to create a risk map. The season of summer holds the greatest risk of a BTD epidemic with 25.9 % of the analysed area providing optimal conditions for vector abundance and 12.4 % providing contact risk with ruminant host. The results of this project (1) provide fundamental data on the distribution of Culicoides spp. in Austria, (2) determine limiting climatic parameters, (3) model most favourable Culicoides habitats and (4) identify risk areas by including possible host interaction. These high-risk areas can subsequently be given special attention for precautionary monitoring measures.
Keywords: Culicoides, biting midge, vector, Bluetongue Disease, risk assessment, GIS, Austria.
_____________
*Corresponding author at: Austrian Agency for Health and Food Safety (AGES), Beethovenstrasse 8, 8010 Graz, Austria
Phone number: +43- 0-50555
E-mail address: [email protected]
1. Introduction
Animal Diseases constitute an enormous risk factor concerning public health, food supply, entire economies, the environment and biodiversity as a whole (Kuiken et al., 2005). Disease monitoring and surveillance systems (MOSSs) have developed into vital tools in our ongoing efforts to management animal pathogens (Doherr & Audige 2001). Recently, Geographic Information Systems (GIS) have increasingly and successfully been utilized in modern Epidemiology, since they provide realistic scenarios of epidemiological processes. Through the application of convenient and sophisticated tools of GIS, any given data can be conveniently brought into direct correlation with geographical locations, thereby allowing us to use it as an important method for research, monitoring and surveillance (Norstrom 2001). At this point, relevant public health institutions throughout the world value the benefits of visualisation, spatial data generation and data sharing across institutions as well as a variety of other institutional bodies (Shuai et al., 2007). Renowned international organizations like the World Organization for Animal Health (OIE) are known to be applying GIS applications for the creation of global surveillance networks (OIE-WAHIS). The EAST-BTNET project, a project implemented by the OIE, aims to create an international information network for the collection and dissemination of relevant epidemiological data on the Bluetongue Disease in Balkan countries (Calistri et al., 2007).
In the summer of 2006 we were led to grasp the severe impact an outbreak of a emerging disease can have when an epidemic of Bluetongue Disease hit in Northern and Central Europe (OIE, 2006).
The disease, which up to then was thought to be limited to regions between latitudes 35° South and 40° North (Gómez-Tejedor, 2004), suddenly appeared at latitudes of more than 50° North, in Belgium, Germany and the Netherlands (Anonymous 2006a, b, c). The exotic serotype 8 of the Bluetongue Virus has since spread within those countries, but also spilled into adjacent countries, like France, Belgium, Luxembourg and Germany (Mehlhorn et al., 2007). The danger of this non- contagious, vector-borne animal disease, lies foremost in its great economic impact, since its occurrence entails international restrictions in the trade and production of livestock and its various products. It primarily causes disease in sheep but other domesticated and wild ruminants can also be affected (Calistri et al., 2003).
BTV infection of ruminants generallycoincides with the distribution of haematophagous Culicoides, the species of biting midge, which is a biological vector for the virus (Gorman et al., 1983;
Verwoerd & Erasmus, 2004). More specifically, the species of Culicoides imicula is the main vector for BTD. However, in some of the regions where recent outbreaks occurred, C. imicola was found to be absent and instead Palearctic Culicoides, adopted to cooler climatic conditions, was detected (Purse et al., 2007).
Due to the central role these insects play in BT epidemiology, the successful spreading predominantly dependends on ecological, climatic and environmentally controlled factors. These factors exert a substantial influence on the transmission potential of BTD. In Europe the disease has a seasonal occurrence with temperature being a limiting factor (Purse et al., 2004 and 2007; Sellers
& Mellor, 1993).
In the last years, a number of studies have attempted to evaluate and model the effect of climate on the occurance and distribution of BTD and its vectors. In Australia Ward (1994) attempted to relate the increased abundance of Culicoides with 18 different climatic parameters. Due to the effect of multicolinearity he was able to isolate temperature and rainfall as explanatory parameters for variability of BTV infection. In more recent studies GIS was applied as an accurate tool to classify territories in relation to their suitability to harbour Culicoides species. In Italy, for instance, GIS based prediction maps were drawn to comparison with methods using Culicoides light-trapping to analyse the insect’s favourable habitat (Conte et al., 2003 and 2007). Similarly, Racloz et al., (2008) combined thematic maps of temperature, humidity and altitude to determine sustainable seasonal vector habitat locations. Previous studies in Italy, Spain, France, Netherlands and Switzerland demonstrate that the approach of combining mathematical models with spatial analysis as predictive
instruments has proven to be a reliable method (Purse et al., 2004; Cagienard et al., 2006; Guis et al., 2007; Racloz et al., 2007; Takken et al., 2008).
With the increasing awareness of the dynamics of the pathogen and the series of recent outbreak occurrences in neighbouring countries, the Austrian Ministry of Health, Family and Youth (BMGFJ) initiated a vector surveillance program, which was started in June 2007. The climate in Austria is known for its inhomogeneity, ranging from mediterranean regions with altitudes as low as 114 m a.s.l. to Alpine regions peaking at 3798 m a.s.l. Up to the beginning of this study the potential distributional and seasonal patterns of Culicoides were unknown. Therefore, this entomological study, which was conducted by the Austrian Agency for Health and Food Safety (AGES) and the Natural History Museum Vienna (NHMV; Loitsch et al. 2008, Sehnal et al. 2008), is aimed to gain a set of basic information regarding vector biology.
This present, ongoing study draws from the information gathered in the vector surveillance program and aims to map potential areas for providing adequate living conditions for the BTD vector Culicoides spp. In the course of this study we hope to establish an adequate model that grants us to pinpoint areas of increased suitability for Culicoides spp. habitats. In addition regions of high risk for hosting a potential BTD outbreak will be identified. It is understood that on a national and regional level this analysis is going to be an important resource for Austrian animal-health officials in their efforts to coordinate vector control, vaccination and diagnostics, that is for the design in general of a targeted BTD surveillance program.
During the process of research Bluetongue Disease was firstly introduced in the Austrian regions of Schaerding (Upper Austria) and Bregenz (Vorarlberg), both bordering Germany. In this most recent occurrence it was found that 2 cases were reported in Bregenz and 16 cases could be detected in Schaerding, which were found in 8 different farmsteads (OIE-WAHID, 2008). These occurrences underline how pressing it is for Austria to establish a concise model to predict the occurrence of Bluetongue disease vectors and identify flag areas and risk zones in which the disease can get established due to geographic, climatic and biological factors. Bluetongue disease is spreading and Austria needs a model able to identify flag areas and risk zones in which the disease can get established due to geographic, climatic and biological factors.
2. Material and Methods
2.1. Data collection
In order to map the distribution of Culicoides spp. multiple data sources were used in the detection of heightened risk zones for harbouring a possible BTD outbreak.
A set of Culicoides traps was distributed throughout Austria at locations chosen according to a 40 x 40 km raster scale. For installation of the 220-V Onderstepoort Blacklight Traps were set up, a type of trap known for its effectiveness according to the “Instituto Zooprofilattica Sperimentale dell'Abruzzo e del Molise (IZS)” Teramo, Italy (Conte et al., 2003 and 2007). A series of 54 locations were selected. In the selection process raster fields exclusively consisting of alpine area were excluded and following minimum criteria were taken into consideration:
• Livestock farmstead holding > 10 domestic ruminants
• Close proximity to water bodies
• Moderate altitudes (between 116m [Neusiedl am See] and 1190m [Tamsweg])
• Preferably farmsteads without Alpine transhumance
The traps were placed in weatherproof locations (Fig.1) outside the stable and activated every Monday from dusk until dawn as described by Goffredo & Meiswinkel, 2004. The so collected trapping data from June 2007 until October 2008 was used for this model in conjunction with the corresponding daily weather data from meteorological stations in close proximity to the trapping locations (Austrian Central Institute for Meteorology and Geodynamics – ZAMG).
The overall climate conditions in Austria were evaluated by analysing data collected from 186 meteorological stations (ZAMG). Monthly weather averages from the months January to December
of the years 1997 until 2007 were obtained and the following parameters were incorporated as independent variables into the statistical analysis:
• Absolute minimal daily temperature (in ° C)
• Mean daily temperature (in ° C)
• Wind speed (Monthly average of wind speed in 1/10 m/s)
• Relative humidity (Daily average in %)
• Mean daily precipitation (Sum of daily precipitation in mm)
In addition the altitude of trapping sites was recorded and used as an independent variable for the subsequent analysis.
For the spatial analysis the weather and trapping stations were georeferenced and imported into the Geographical Information System ArcGISTM, Version 9.3 (Redlands, CA, USA).
The monthly temperatures were classified into four seasons each consisting of three months. The interpolation tool ordinary Kriging of the Geostatistical Analyst module of ESRI ArcGIS was used to estimate the values for each grid cell and creates a continuous surface from the meteorological sample points.
The altitude for spatial analysis was obtained from a digital elevation model in the Lambert Conformal Conic coordinate system (100 m resolution) was used. According to Cagienard et al., 2006 most of the C. obsoletus abundance has been recorded in regions below 1109 m. Torina et al., 2004 has identified the highest location of C. obsoletus occurrence at 1211 m. Since the highest trapping station in our analysis is located in Tamsweg, Salzburg at 1190 m, all areas above 1300 m were not included in the spatial analysis.
Stock density data of cattle, sheep and goats was obtained from “Statistic Austria” and was then combined into a 1km² resolution ruminant data layer to determine possible points of contact with Culicoides spp. for the creation of high-risk maps.
2.2. Statistical analysis
A preliminary statistical analysis was performed using weather data and altitude as independent variables. The objective to determine the effects of these parameters on vector abundance and subsequently using significant parameters is to create a spatial model. All statistical analysis was carried out using R 2.8.0 (http://CRAN.R-project.org).
For the calculation of a monthly weather dataset for the five parameters (see 2.1.) from the years 1997 to 2007 the Median was calculated because it is not affected by outliers and thus can be used to determine a baseline of weather parameters optimal for the survival of Culicoides spp.
distribution (Armitage & Colton, 2005; Sreenivasaiah, 2007). For the combination to seasonal datasets the average of three months was used.
Multiple regression analysis was performed to investigate the effect of the climate parameters on the logarithm of vector numbers as the response value. For the selected parameters the Akaike Information Criterion was applied as a measure of goodness of fit for the selected statistical model (Armitage & Colton, 2005).
After the statistical analysis the parameters of the selected statistical model were weighted according to the corresponding parameter value (slope value) and incorporated into the spatial analysis.
2.3. Spatial Analysis
Initially, a Culicoides spp. distribution map was created by reclassifying interpolated vector existence and excluding altitudes above the threshold of 1300 m in a binary raster layer.
Secondly, climatic preferences of endemic Culicoides spp. were analysed (Fig.2) and the temperatures of optimal vector abundance was defined as 10 - 20.03 °C temperature with an average of 65 – 80 % relative humidity respectively. The cell value of one was assigned to Culicoides spp. existence. Optimal vector abundance ranges of temperature, relative humidity and
altitude were weighted according to their parameter (slope) value. Joining the three layers created abundance maps.
In a third step risk maps were created, which visualise those areas of Culicoides spp. abundance combined with areas of domestic ruminant host contact. The maps were combined in ArcGIS using the Map Algebra function “addition” of the raster calculator, Spatial Analyst tool. The regions meeting all proposed parameters can be considered as the high-risk areas of BTD establishment and spread.
3. Results
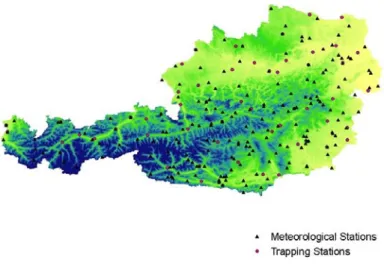
The geographical distribution of meteorological and trapping stations is shown in Fig. 1.
Figure 1: Meteorological Stations (▲) and Culicoides spp. Trapping Stations (●) in Austria.
3.1. Statistical Results
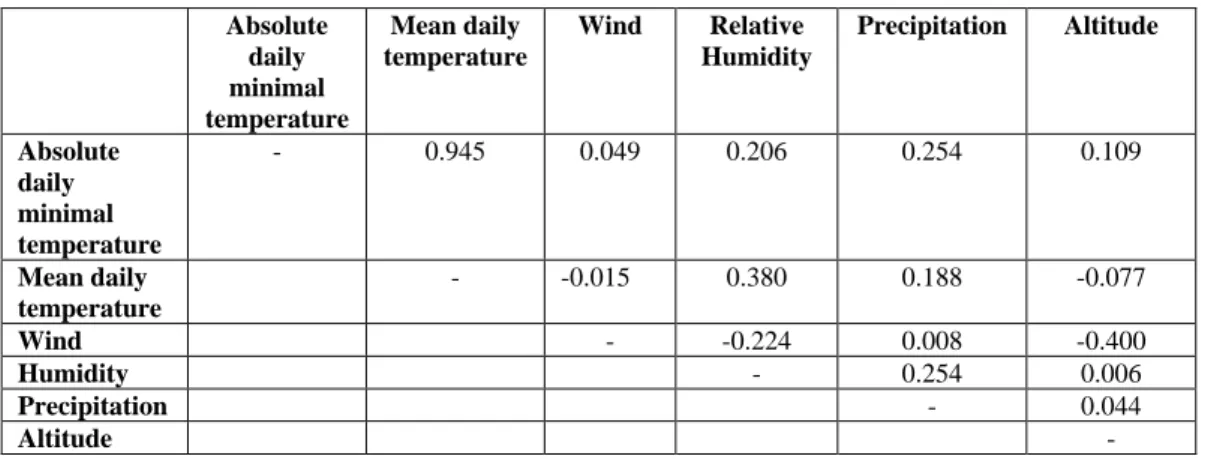
The correlation matrix of independent variables is shown in Table 1.
Table 1: Pearson correlation matrix of the independent variables Absolute
daily minimal temperature
Mean daily temperature
Wind Relative Humidity
Precipitation Altitude
Absolute daily minimal temperature
- 0.945 0.049 0.206 0.254 0.109
Mean daily temperature
- -0.015 0.380 0.188 -0.077
Wind - -0.224 0.008 -0.400
Humidity - 0.254 0.006
Precipitation - 0.044
Altitude -
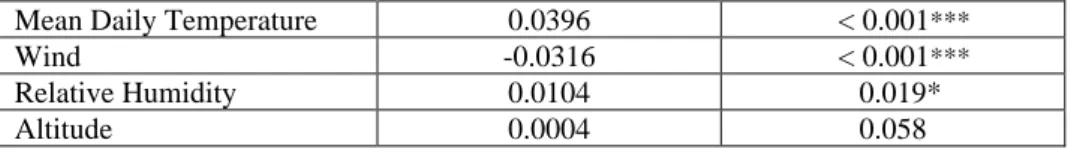
The multiple linear regression model using the five climatic and the altitude parameter as independent variables, led to the differentiation of four significant variables (Tab. 2)
Table 2: Significant parameters of the multivariate regression model.
Parameter Parameter Value b P Value
Mean Daily Temperature 0.0396 < 0.001***
Wind -0.0316 < 0.001***
Relative Humidity 0.0104 0.019*
Altitude 0.0004 0.058
Akaike Information Criterion (AIC) assigned the best fit to the model using the three variables temperature, wind and relative humidity. AIC = 10954.89. This model is able to assign 66.8% of all the variance to the influence of the climatic and geographic parameters (R2 = 0.668).
In the spatial analysis the parameter wind was omitted, since it offers no conclusive results on vector distribution and actual habitat preferences. Previous studies have demonstrated that daily Culicoides spp. abundance is dependent upon wind speed (Peng at al., 1992; Baylis & Rawlings, 1998). This is thought to be relevant for possible spread scenarios of the vector (Hendrickx et al., 2008), however, in this analysis, we focus on identifying seasonal distribution patterns and the inclusion of wind would provide misleading results. The parameters temperature, relative humidity and altitude were weighted according to their parameter value to identify areas of vector abundance.
In our model the parameter values of the variables parameters temperature (b=0.0405), relative humidity (b=0.0165) and altitude (b=0.0005) were used as weights for the map overlay.
3.2. Distribution of Culicoides spp. in Austria
The results of the analysis of 7,523,687 evaluated Culicoides spp. specimen in respect to the local climate parameters highlight the vector preference for moderate temperate climate conditions (Fig.
2).
Figure 2: Vector preference of 10 – 20.03 °C temperature and 65 – 80 % relative humidity.
The results of the Culicoides spp trapping programme from June 2007 until October 2008 show that the predominant majority of Culicoides spp found in the territory of Austria can be assigned to the Culicoides Obsoletus complex subgenera Avaritia (90.2 %), whereas the Culicoides pulicaris species subgenera Culicoides only comprise 5.3 % of the total catch. The species with the least occurrences found in Austria was C. nubeculosus subgenera Monoculicoides, with an appearance of 0.8 % (Anderle et al., 2008). For the creation of Culicoides spp. distribution maps, the factor of species distinction was neglected due to the predominant presence of the C. Obsoletus complex.
The distribution maps in Figure 3 highlight the high vector presence in the south-eastern regions of the country. The counties Burgenland, Styria, and Carinthia turned out to be the most affected regions. Some areas remain suitable for Culicoides spp. throughout the year, despite colder surrounding temperatures. Those parts of the country are situated at lower altitudes and experience Mediterranean climate influences. It is precisely in those areas that the vectors are also most
abundant during the summer months (distribution class of 5000 – 8000; Fig. 3). Here, the overwintering of the virus can easily occur. As the latest outbreaks of BTD in Austria have demonstrated, the risk of an outbreak and spread of BT does not only exist in the warmer seasons but also during the winter months (OIE-WAHID, 2008).
Figure 3: Modelled Culicoides spp. distribution in Spring, Summer, Fall and Winter in Austria.
3.3.
Culicoides spp. abundance and BTD high-risk areasAs illustrated in the temperature and relative humidity results (Fig. 2) Culicoides spp. are abundant at temperatures above 10° C mean temperature and between 60 - 80 % relative humidity. The value of low abundance was given to regions with vector existence and altitudes below 1300m. Medium abundance corresponds to low abundance areas in combination with either suitable humidity or suitable temperature conditions. High abundance indicates areas where all requirements can be regarded as optimal.
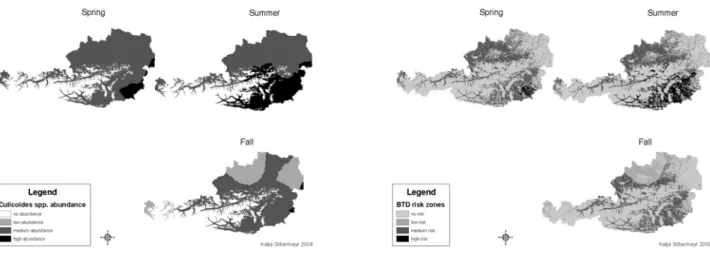
The areas of Culicoides abundance were subsequently topped with layers representing potential ruminant host appearance (Fig. 5). Regions of vector concentration and potential BT occurrence based on Culicoides spp. vector biology and ruminant host occurrence indicate risk areas for Austria. These high-risk areas represent regions where Culicoides spp. finds the most appropriate living conditions and has potential contact with BTD hosts. This provides the essential basis for the BT virus to continue its life cycle.
As expected, summer holds the greatest risk of a BTD epidemic with 25.9 % of the analysed area providing optimal conditions for vector abundance and 12.4 % providing contact risk with ruminant host. In spring only 0.5 % of the raster cells corresponded to optimal climate conditions and 0.2 % correspond to high-risk areas. In fall only 0.03% can be regarded optimal for vector abundance and no cells provide high-risk contact zones with potential hosts. The winter seasons did not provide suitable conditions for vector abundance nor BTD risk.
Areas of Culicoides spp. abundance (Fig. 5) and high-risk of BTD occurrence (Fig. 6) of Spring, Summer and Fall in Austria.
Fig. 5. Fig. 6.
3.4. Climate change scenario of
Culicoides spp. abundance and BTD high-riskareas
It is known that temperature not only influences vector distribution but also the transmission rates of Bluetongue Disease through its effects on vector-host interaction, biting rates and vector mortality (Gubbins et al., 2008; Wilson & Mellor 2008). BTV is bound to thermal limits for viral replication (Van Dijk & Huismans 1982; Mullens et al. 1995). Even different BT serotypes have shown to have different preferences for geographic and climatic conditions, as described for BTV-2 and Culicoides imicola in France (Breard et al., 2004).
The relevance of temperature on the epidemiological cycle of BTD raises thoughts of future challenges central European countries will have to face (Gould & Higgs 2009). In its assessment report of 2007 the International Panel on Climate Change (IPCC) estimates in its low impact scenario that the surface air warming in the 21st century will increase by a range of 1.1 to 2.9 °C.
IPCC predicts that “... effects of regional climate change are emerging such as changes in infectious disease vectors” (IPCC, 2007). To test this hypothesis we increased the temperature threshold by 3°C without changing the relative humidity range to see the effect on Culicoides abundance and high-risk areas for the year 2100 (Fig. 6).
Areas of Culicoides spp. abundance (Fig. 7) and high-risk of BTD occurrence (Fig. 8) of Spring, Summer and Fall in the year 2100 in Austria.
Fig. 7. Fig. 8.
Interestingly the seasons of fall experienced the greatest increase in terms of areas of vector high abundance with 18.6 % out of the total analysed area. In summer the hypothetical increase of temperature results in an increase in BTD high-risk areas of 2.3 % (Tab. 3).
Table 3: Comparison of vector abundance and high-risk areas 2008 vs. 2100 of analysed area.
Value Spring Summer Fall
Low - - 21.3 %
Medium 68.2 % 47.0 % 51.3 %
Culicoides abundance
High 0.5 % 25.9 % -
Low - - 20.1 %
Medium 53.5 % 40.6 % 34.1 %
Culicoides abundance +3°C
High 19.3 % 32.2 % 18.6 %
Low - - 0.9 %
Medium 32.5 % 22.0 % 25.1 %
High-risk areas
High 0.2 % 12.4 % -
Low - - 0.9 %
Medium 25.0 % 19.7 % 15.9 %
High-risk areas +3°C
High 0.9 % 14.7 % 0.9 %
4. Discussion
In its bulletin dating from July 2008 the European Food Safety Authority (EFSA) recommends
“Member states to carry out analysis on life patterns of bluetongue virus vectors” (EFSA, 2008). In this study we attempt to reveal the distribution of Culicoides spp. in Austria. The results indicate that the vector composition is comparable with other European countries (De Liberato et al., 2005;
Mehlhorn et al., 2007; Meiswinkel et al., 2008a; Racloz et al., 2007; Savini et al., 2005) as C.
obsoletus is the dominant species comprising 90.2 % of the total collected Culicoides spp.
specimen. Since Culicoides spp. is strongly dependent on micro-climatic conditions it might be advisable to adjust the trapping design and include different daytimes and locations outside the immediate range of ruminants. The parameter of altitude as limiting factor for vecor occurence has not been satisfyingly resolved because the highest trapping location of 1190m still recorded positive catches throughout spring, summer and fall. However, unlike approaches for the detection of Culicoides spp. in high-risk areas (Racloz et al., 2007 and 2008), the Austrian survey focused on evaluating a wide range of different climatic and geographic conditions. Thereby specific climatic preferences of temperature and relative humidity favourable for Culicoides spp. occurrence could
be identified. This information can be valuable for future studies aiming to create climatic envelopes for Culicoides species in Europe (Purse et al., 2007).
Previous outbreaks of BTD in Europe indicate that this disease is most likely to occur during the warmer summer months when biting midges are more active (Sellers & Mellor, 1993; Purse et al., 2007). These findings correlate to our results because the greatest Culcioides distribution, abundance and high-risk areas were observed during the summer months June to August. The south-eastern Alpine Foreland of Austria experiences the highest vector concentration influenced by mild climate conditions through Mediterranean high-pressure systems.
During winter no regions suitable for vector abundance could be identified thus no high-risk areas were detected. By looking at Culicoides spp. distribution it is notable that the south-eastern region of Austria experiencing the highest class of Culicoides (between 5000 to 8000 specimen) in summer also offers suitable conditions for winter distribution (1 to 5 specimen). Most other regions do not record any positive catches during the winter months December to February. We would like to point out one remarkable catch at the low temperature of – 5 °C. This catch occurred in December, at Graz Umgebung (Styria), with a relative humidity of 97 % and an altitude of 465 m. Graz Umgebung (Styria) was also the most successful trapping location during the winter months with 44.58 Culicoides spp. specimen caught. The second best trap location during the winter months in Liezen Gröbming (Styria) recorded about 12 times less specimen than Graz Umgebung. Those regions recording positive catches in winter could be valuable for the detection of virus circulation and insect activity in future surveillance programmes as they could be sites for possible vector overwintering. The massive re-emergence of BTV in Europe after the initial epidemic in 2006 in the following summer draws great attention to possible sites and mechanisms of overwintering of BTV (Meiswinkel et al., 2008b).
As future warming will enhance the distribution and vector potential of Culicoides spp. (Mellor and Leake, 2000; Paweska et al., 2002, Meiswinkel et al., 2008a) it becomes obvious that the
development of temperature in the risk areas and the expansion of the risk areas themselves should be monitored so as to be able to react quickly in case of an outbreak of BTD. In the course of this survey no individual of the exotic C. imicola was found, nevertheless, due to the ameliorating effects of global warming it is likely to expand to northern regions (Purse et al., 2007). Culicoides spp. are known to transmit other diseases like the African horse sickness virus (AHSV), epizootic haemorrhagic disease virus (EHDV) or Akabane virus (AKAV; Mellor & Boorman, 1995,
Meiswinkel et al., 2008b) which could potentially be introduced into central Europe in the near future (Meiswinkel et al., 2008a; Wilson & Mellor 2008). Our approach of risk assessments might therefore be useful for other emerging vector-borne diseases which are about to advance to Central Europe as the first report of West Nile Fever Virus in Austria last year impressively demonstrated (OIE-WAHIS Disease Report, 2008). Similar to West Nile Fever, BTD can affect European wildlife and hold a great challenge for counteractive measures in case of a disease outbreak.
In Spain (Ruiz-Fons et al., 2008) and Belgium (Mauroy et al., 2008) BTD could be detected in wild ruminant populations. Wild ruminants could comprise a serious threat as “silent carriers” and reservoirs providing a safe haven for BTV overwintering and thereby spoil vaccination and eradication efforts (Gortázar et al., 2007; Stallknecht & Howerth, 2004). However, in contrast to domestic animals the pathogen surveillance in wild animals is not bound to a distinct international reporting convention. A national Wildlife Disease Plan, which aims to manage existing and emerging diseases that originate from wild animals, should therefore be an integral part of reliable monitoring and surveillance measures.
The results of this study can be serviceable in surveillance programmes for determining ideal placing of sentinel cattle herds and serological testing. Similar to Switzerland (Racloz et al., 2008) the results of this model could be used for a geographically and seasonally ideal design of national targeted surveillance programs for optimal utilization of human and financial resources as well as optimal undertaking of adequate and timely measures in case of BTD outbreaks.
5. Acknowledgements
We thank the farm owners, veterinarians and official veterinarians for their participation. We are indebted of Peter Sehnal and his team at the Museum of Natural History (NHM) in Vienna, Austria for the challenging task of Culicoides trapping data analysis which was funded by the Austrian Ministry of Health, Family and Youth.
6. Conflict of interest
None of the authors K. Silbermayr, K. Hacklaender, C. Doscher and K. Fuchs has a financial or personal dependence that would result in an inappropriate influence of the paper entitled “A Spatial risk assessment of Culicoides spp. distribution and bluetongue disease risk areas in Austria”.
7. References
Anderle, F., Sehnal, P., Schneemann, Y., Schindler, M., Wöss, G., Mrschler, M. 2008. Culicoides surveillance in Austria (Diptera: Ceratopogonidae) - a snap-shot. Beiträge zur Entomofaunistik, 9, 67-80.
Anonymous (2006a) Bluetongue in the Netherlands. OIE, Disease Information, 34, 612. Derived from http://www.oie.int/eng/info/hebdo/AIS_03.HTM at 08/01/09.
Anonymous (2006b) Bluetongue in Belgium. OIE Disease, Information, 34, 616. Derived from http://www.oie.int/eng/info/hebdo/AIS_02.HTM at 08/01/09.
Anonymous (2006c) Bluetongue in Germany. OIE Disease, Information, 34, 618. Derived from http://www.oie.int/eng/info/hebdo/AIS_04.HTM at 08/01/09.
Armitage, P. & Colton, T. 2005. Encyclopedia of Biostatistics. John Wiley and Sons Ltd. Wets Sussex, England.
Baylis, M., Rawlings, P. 1998. Modelling the distribution and abundance of Culicoides imicola in Morocco and Iberia using climatic data and satellite imagery. Arch Virol Suppl., 14, 137-53.
Bread, E., Hamblin, C., Hammoumi, S., Sailleau, C., Dauphin, G., Zientara, S. 2004. The epidemiology and diagnosis of bluetongue with a particular reference to Corsica. Res. Vet. Sci.
77, 1-8.
Cagienard, A., Griot, C., Mellor, P.S., Dension, E., Staerk, K.D.C. 2006. Bluetongue vector species of Culicoides in Switzerland. Med. A. Vet. Entom. 20, 239-247.
Calistri, P., Goffredo, M., Caporale, V., Meiswinkel, R. 2003. The Distribution of Culicoides imicola in Italy: Application and Evaluation of Current Mediterranean Models Based on Climate. J. Vet. Med. B 50, 132–138.
Calistri, P., Savini, L., Ippoliti, C., Conte, A. 2007. Web-based geographic information system tools and international surveillance network for bluetongue in the Balkans and south-east Europe (East-BTNet). Vet. Ital. 43, 739-744.
Conte, A., Giovannini, A., Savini, L., Goffredo, M., Calistri, P., Meiswinkel, R. 2003. The Effect of Climate on the Presence of Culicoides imicula in Italy. J. Vet. Med. B. 50, 139-147.
Conte, A., Goffredo, M., Ippoliti, C., Meiswinkel, R. 2007. Influence of biotic and abiotic factors on the distribution and abundance of Culicoides imicola and the Obsoletus Complex in Italy. Vet. Parasitol. 150, 333–344.
De Liberato, C., Scavia, G., Lorenzetti, R., Scaramozzino, P., Amaddeo, D., Cardeti, G., Scicluna, M., Ferrari, G., Autorino, G.L. 2005. Identification of Culicoides obsoletus (Diptera:
Ceratopogonidae) as a vector of bluetongue virus in central Italy. Vet. Rec. 156, 301-304.
Doherr, M.G. & Audige, L. 2001. Monitoring and surveillance for rare health-related events: a review from the veterinary perspective. Phil. Trans. R. Soc. Lond. B. 356, 1097-1106.
European Food Safety Authority (EFSA). 2008. EFSA recommends Member States carry out analyses on life patterns of bluetongue virus vectors. Derived from
http://www.efsa.europa.eu/EFSA/efsa_locale-1178620753812_1211902016407.htm at 10/01/09.
Goffredo, M. & Meiswinkel, R. 2004. Entomological surveillance of bluetongue in Italy: methods of capture, catch analysis and identification of Culicoides biting midges. Vet. Ital. 40, 260-265.
Gómez-Tejedor C. 2004. Global situation. Brief overview of the bluetongue situation in Mediterranean Europe, 1998-2004. Vet. Ital. 40 (3), 57-60.
Gorman, B.M., Taylor, J., Walker, R.J. 1983. Orbiviruses. The Reoviridae – New York, London, S.
287-357.
Gortázar, C., Ferroglio, E., Hoefle, U, Froehlich, K., Vicente, J. 2007. Diseases shared between wildlife and livestock: a European perspective. Eur. J. Wildl. Res. 53, 241-256.
Gould, E.A., Higgs, S. 2009. Impact of climate change and other factors on emerging arbovirus diseases. Trans R Soc Trop Med Hyg. 103(2), 109-21.
Gubbins, S., Carpenter, S., Baylis, M., Wood, J.L., Mellor, P.S. 2008. Assessing the risk of bluetongue to UK livestock: uncertainty and sensitivity analyses of a temperature-dependent model for the basic reproduction number. J. R. Soc. Interface, 5, 363–371.
Guis, H., Tran, A., de La Rocque, S., Baldet, T., Gerbier, G., Barragué, B., Biteau-Coroller, F., Roger, F., Viel, J.F., Mauny, F. 2007. Use of high spatial resolution satellite imagery to characterize landscapes at risk of bluetongue. Vet. Res. 38, 669 – 683.
Hendrickx, G., Gilbert, M., Staubach, C., Elbers, A., Mintiens, K., Gerbier, G., Ducheyne, E. 2008.
A wind density model to quantify the airborne spread of Culicoides species during north- western Europe bluetongue epidemic, 2006. Prev Vet Med. 87(1-2), 162-81.
IPCC, 2007: Fourth Assessment Report – Synthesis Report. Lenny Bernstein, Peter Bosch, Osvaldo Canziani, Zhenlin Chen, Renate Christ, Ogunlade Davidson, William Hare and others. Adopted at IPCC Plenary XXVII (Valencia, Spain, 12-17 November 2007). Derived from
http://www.ipcc.ch/ipccreports/ar4-syr.htm at 14/01/09.
Kuiken, T., Leighton, F.A., Fouchier, R.A.M., LeDuc, J.W., Peiris, J.S.M., Schudel, A., Stoehr, K., Osterhaus, A.D.M.E. 2005. Pathogen Surveillance in Animals. Science 309 (5741), 1680-1681.
Loitsch, A., Sehnal, P., Herzog, U., Köfer, J. (Red.) 2008. Durchführung der Bluetongue
Überwachung in Österreich. Abschlussbericht 2007. – Österreichische Agentur für Gesundheit und Ernährungssicherheit GmbH, Wien, 52 pp.
Mauroy, A., Guyot, H., De Clercq, K., Cassart, D., Thiry, E., Saegerman, C. 2008. Bluetongue in captive yaks. Emerg. Infect. Dis. 14, 675-676.
Mehlhorn, H., Walldorf, V., Klimpel, S., Jahn, B., Jaeger, F., Eschweiler, J., Hoffmann, B., Beer, M. 2007. First occurrence of Culicoides obsoletus-transmitted Bluetongue virus epidemic in Central Europe. Parasitol. Res. 101, 219-228.
Meiswinkel, R., Goffredo, M., Leijs, P., Conte, A. 2008a. The Culicoides ‘snapshot’: A novel approach used to assess vector densities widely and rapidly during the 2006 outbreak of bluetongue (BT) in The Netherlands. Prev. Vet. Med. 87, 98–118.
Meiswinkel, R., Baldet, T., de Deken, R., Takken, W., Delècolle, J.-C., Mellor, P.S. 2008b. The 2006 outbreak of bluetongue in northern Europe—The entomological perspective. Prev. Vet.
Med. 87 (2008) 98–118.
Mellor, P.S. & Boorman, J. 1995. The transmission and geographical spread of African horse sickness and bluetongue viruses. Ann. Trop. Med. Paras. 89, 1-15.
Mellor, P.S., Leake, C.J. 2000. Climatic and geographic influences on arboviral infections and vectors. Rev. Sci. Tech. 19(1), 41-54.
Mullens, B.A., Tabachnick, W.J., Holbrook, F.R., Thompson, L.H. 1995. Effects of temperature on virogenesis of bluetongue virus serotype 11 in Culicoides variipennis sonorensis. Med. Vet.
Entomol. 9, 71–76.
Norstrom, M. 2001. Geographic Information System (GIS) as a Tool in Serveillance and Monitoring of Animal Diseases. Acta vet. scand. Suppl. 94, 79-85.
OIE (Office International des Èpizooties; 2006): World Animal Health In 2006, Reports on the animal health status and disease control methods and List A disease outbreaks-statistics.
Deroved from http://www.oie.int/wahis/public.php?page=single_report&pop=1&reportid=4286 at 20/12/08.
OIE-WAHIS 2008. Disease Report. Derived from
http://www.oie.int/wahis/public.php?page=country_reports&year=2008.
Paweska, J.T., Venter, G.J., Mellor, P.S. 2002. Vector competence of South African Culicoides species for bluetongue virus serotype 1 (BTV-1) with special reference to the effect of
temperature on the rate of virus replication in C. imicola and C. bolitinos. Med. Vet. Entomol.
16(1), 10-21.
Peng, R.K., Fletcher, C.R., Sutton, S.L. 1992. The effect of microclimate on flying dipterans. Int. J.
Biometeorol. 36, 69-76.
Purse, B.V., Tatem, A.J., Caracappa, S., Rogers, D.J., Mellor, P.S., Baylis, M., Torina, A. 2004.
Modelling the distributions of Culicoides bluetongue virus vectors in Sicily in relation to satellite-derived climate variables. Med. Vet. Ent. 18, 90–101.
Purse, B.V., McCormick, B.J.J., Mellor, P.S., Baylis, M., Boorman, J.P.T., Borras, D., Burgu, I., Capela, R., Caracappa, S., Collantes, F., DeLiberato, C., Delgado, J.A., Denison, E., Georgiev, G., ElHarak, M., De la Rocque, S., Lhor, Y., Lucientes, J., Mangana, O., Miranda, M.A., Nedelchev, N., Nomikou, K., Ozkul, A., Patakakis, M., Pena, I., Scaramozzino, P., Torina, A., Rogers, D.J. 2007. Incriminating bluetongue virus vector with climate envelope models. J.
Appl. Ecol. 10, 1365-2664.
R Project for Statistical Computing, Version 2.8.0. Derived from http://CRAN.R-project.org.
Racloz, V., Presi, P., Vounatsou, P., Schwermer, H., Casati, S., Vanzetti, T., Griot, C., Staerk, K.
2007. Use of mapping and statistical modelling for the prediction of bluetongue occurrence in Switzerland based on vector biology.Vet. Ital. 43 (3), 513-518.
Racloz, V., Venter, G., Griot, C., Staerk, K.D.C. .2008. Estimating the temporal and spatial risk of bluetongue related to the incursion of infected vectors into Switzerland. BMC Vet. Res. 4, 42.
Ruiz-Fons, F., Reyes-García, A.R., Alcaide, V., Gortázar, C. 2008. Spatial and Temporal Evolution of Bluetongue Virus in Wild Ruminants, Spain. Emerg. Infect. Dis. 14(6), 951-953.
Savini, G., Goffredo, M., Monaco, F., Di Gennaro, A., Cafiero, M.A., Baldi, L., de Santis, P., Meiswinkel, R., Caporale, V. 2005. Bluetongue virus isolations from midges belonging to the Obsoletus complex (Culicoides, Diptera: Ceratopogonidae) in Italy. Vet Rec. 30, 157(5), 133- 139.
Sehnal, P., Schweiger, S., Schindler, M., Anderle, F. & Schneemann, Y., 2008: Bluetongue: Vector surveillance in Austria in 2007. Wiener klinische Wochenschrift 120 [Suppl 4]: 34-39.
Sellers, R.F., Mellor, P.S. 1993. Temperature and the persistence of viruses in Culicoides spp.
during adverse conditions, Revue Scientifique et Technique de l’ Office Internacional des Epizooties, 12, 733-755.
Shuai, J., Buck, P., Chevalier, C., Sockett, P. 2007. Development of a geographic information- driven real-time surveillance system for disease surveillance. Vet. Ital. 43, 451-461.
Sreenivahaiah, P.V. 2007. Veterinary Biostatistics. International Book Distributing Co, Lucknow, India.
Stallknecht, D.E. & Howerth, E.W. 2004. Epidemiology of bluetongue and epizootic disease in wildlife: surveillance methods. Vet. Ital., 40: 203-207.
Takken, W., Verhulst, N., Scholte, E.-J., Jacobs, F., Jongema, Y., Van Lammeren, R. 2008. The phenology and population dynamics of Culicoides spp. in different ecosystems in The Netherlands. Prev. Vet. Med. 87, 41-54.
Torina, A., Caracappa, S., Mellor, P.S., Baylis, M., Purse, B.V. 2004. Spatial distribution of bluetongue virus and its Culicoides vectors in Sicily. Med. Vet. Entomol. 18, 82-89.
Van Dijk AA, Huisman. 1982. The effect of temperature on the in vitro transcriptase reaction of bluetongue virus, epizootic haemorrhagic disease virus and African horsesickness virus.
Onderstepoort J. Vet. Res. 49(4), 227-232.
Verwoerd, D. & Erasmus, B.J. 2004. Bluetongue. Infectious Diseases of Livestock. J. A. Coetzer and R. C. Tustin. Cape Town, Oxford University Press: 1201-1220.
Ward, M.P. 1994. The epidemiology of bluetongue in Australia - a review. Aus. Vet. J 71: 3-7.
Wilson, A. & Mellor, P. 2008. Bluetongue in Europe: vectors, epidemiology and climate change.
Parasitol. Res. 103, 69–77.