The purpose of this study was to confirm the published results and test viscotoxin A3 with bacteria and other fungi. The main objective of this thesis was to compare different methods to test the antimicrobial activity of AMPs using viscotoxin A3.
Antimicrobial peptides
Antimicrobial activity of viscotoxin A3 against Fusarium solani, Phytophthora infestans and Sclerotinia sclerotiorum has already been reported (Giudici et al., 2004). They are produced as preproproteins with an acidic prodomain N-terminal to the defensin (Daher et al., 1988).
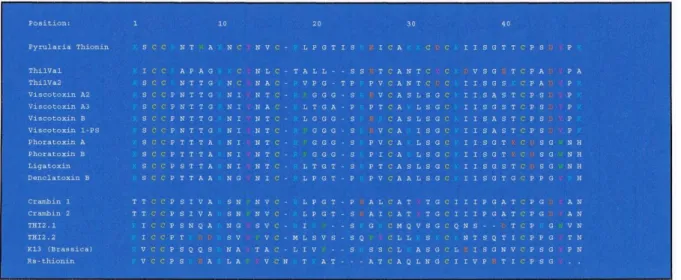
Thionins
Crambin is one of the well-studied thionines, the structure of which was first determined in the 1980s (Teeter et al., 1981). Trp8 is also another poorly conserved residue involved in the mechanism of toxicity (Fracki et al., 1992).
The fungicidal activity of viscotoxin A3 and viscotoxin B against F.solani, P.infestans and S.sclerotiorum was described in 2004 (Giudici et al., 2004). Another study was done to discover the target cells and mechanism of action of viscotoxin A3 (Giudici et al., 2006).
Viscotoxin
Cytosolic Ca2+ has an important role in cell signaling and is able to regulate a wide range of physiological functions in different organisms (Berridge et al., 2000). Viscotoxin A3 is also able to induce an internal Ca2+ increase (Giudici et al., 2004) similar to the plant defensins DmAMP1 and RsAFP2 (Osborn et al., 1995, Terras et al., 1992), the antifungal mechanism of which which is involved in inducing a set of relatively rapid responses in fungal cells, including increased potassium efflux and calcium uptake, ultimately leading to membrane permeabilization (Thevissen et al., 1996, Thevissen et al. al., 1999).

The result of the test was almost 4 times higher than aprotinin was used as a reference. Finally, to compare better results, use BSA as a reference, since in the paper that studied the mechanism of action of viscotoxin A3 and B (Giudici et al., 2003) BSA was also used to determine concentration of viscotoxin by methods described in the following papers are described (Böttcher et al., 1961, Edelhoch, 1967).

Bacteria
Bacteria Preparation
The best time to use bacteria is in the middle of the exponential phase. The figure below illustrates the structure of the Thoma Neu counting room with the correct width and height. The Thoma Neu counting room consists of 16 group squares placed in the middle of the glass.
The table below shows the summary of the MIC of the antibiotic used as a positive control and viscotoxin A3. The pictures below show the generation of hyphae in the well with the lowest and the highest concentration of viscotoxin A3. However, viscotoxin did not show any inhibitory effect even at the highest concentration of 63 µg1/ml in any of the species tested in this experiment.

Mediums for Bacteria
Calculation and determination of final concentration of bacteria
Fungi
Fungal mediums
To make the PDA medium, 31 grams of potato dextrose agar is mixed with 800 ml of distilled water and autoclaved. To prepare 100ml of 500x TE solution, make solutions 1 and 2 and mix them together, the pH should be re-adjusted to 6.5. For 100 ml, dissolve the listed salts in 80 ml of distilled water in the order listed.
For 100 ml, the listed salts are dissolved in 80 ml of distilled water in the order indicated. Bring the final volume to 100 mL with distilled water and store at 4-8 °C or autoclave and keep at room temperature. For 10 ml of solution, magnesium sulfate is dissolved in 8 ml of distilled water and the final volume is brought to 10 ml and autoclaved and stored at 4-8C.
Fungus preparation
To prepare 250 ml of MM, mix the following solution prepared in the last steps with glucose according to the following table. Note: 250 ml of MM is approximately sufficient to test 200 individual samples, depending on the total volume used in each well. The recipe for PDA medium used for growing fungi is described in the fungal medium section.
To collect spores, simply add 5 ml of autoclaved MM to a Petri dish with the desired fungi to be tested in the laminar. A heated metal rod is used to disperse and mix the spores with the MM in the Petri dish. Consequently only the spores pass the filter and the suspension is ready for counting, a step which is explained in the next section.
Calculation and determination of final concentration of spores
Due to the existing capillary effect in the gap between the cover glass and the chamber, it will absorb all the injected suspension. In the case of observing air bubbles on the liquid, which are located in the grooves, or exactly on top of one of the group blocks the chamber must be cleaned again and all feeding steps must be repeated. In this experiment, only the observed traces were counted in 4 group squares along the direction, which is illustrated in Figure 21 (counting should start at the upper left corner and follow the direction indicated by the arrow), and used in the related formula.
To find the actual concentration of the stock solution, the number of spores counted in 4 array squares is used in the following formula to obtain the final result. The advantage of using this method lies in the high sensitivity and accuracy of the bioassay. In the experiment below, the positive control is defined as fungicide or antibiotic + minimal medium + fungi or bacteria.

Preparation of Microtiter plate
- Preparation of Resazurin
- Preparation Benomyl
- Preparation of Kanamycin
- Microtiter plate (Nunc 96)
In this combination we expect to see an inhibitory effect of the antibiotic or the fungicide. The total volume used in each well can vary from 100-200 µl, depending on the availability of the stock peptides. A sterile Nunc 96 well plate was labeled and a volume of 100μL of test material with the highest concentration to initiate the assay was added to the first well of the row (benomyl, kanamycin for rows considered as positive control and viscotoxin A3 for rows dedicated for test extracted AMP).
In this step, each well should have 50 µl of test material in serially decreasing concentrations, except for the last two wells of each row, which only have 50 µl of minimal medium. As a final step, 48 µl of fungal suspension was added to achieve a final spore concentration of 2 x 10⁴ /ml in each well, except for the blank containing only 98 µl medium and 2 µl resazurin. In the bioassay where the effect of the protein on bacteria was to be tested, 48 µl of bacterial suspension was added instead of 48 µl of fungal suspension to achieve CFU/ml equal to 105/ml in each well except the blank.

Evaluation methods
Observation
The incubation time for fungal strains was 24-48 hours in the incubator at 26°C until the color change occurred. After the incubation period ended, the color change was visually assessed and photographs were taken.
Fluorescence intensity (FI)
Absorbance
When measuring absorbance, the negative control should always show the lowest resazurin absorbance, because due to high bacterial or fungal activity, all resazurin in the negative control is reduced and converted to resorufin. In contrast, the blank must have the highest resazurin absorbance because only fresh medium used in these wells and resazurin must remain untouched with the highest absorbance value compared to other wells.
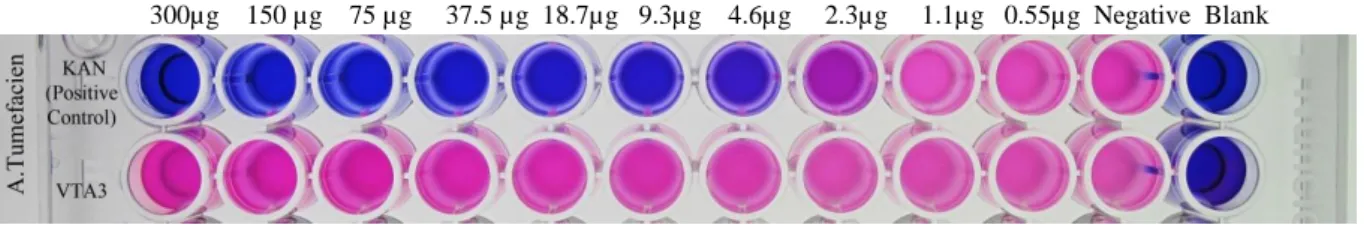
A higher absorbance in the following images indicates a higher level of resazurin detected in a particular well, demonstrating that bacterial activity is inhibited or did not occur. As can be easily seen in the following figure, all lines associated with viscotoxin from 300-0.6 µg concentration are approximately at the same height as the absorbance value of the negative control. The resazurin absorbance value for all viscotoxin-treated samples was between 0.7-0.9, which is close to the value of the negative control well, which is approximately equal to 1, and was plated with only 105 CFU/ml of fresh bacteria without any any antibiotics.
A strong minimum inhibitory effect of the positive control with kanamycin, which was equal to 1.2 µg/ml is a good proof that the bioassay went well in this experiment and. As it is shown in Figure 32, the resazurin absorbance value of the well with the highest concentration of viscotoxin (300µg) is 0.28, which is so close to the Negative control with absorbance equal to 0.3 for E. This means that due to bacterial activity all resazurin in the wells, which contained viscotoxin, was converted to resofurin.
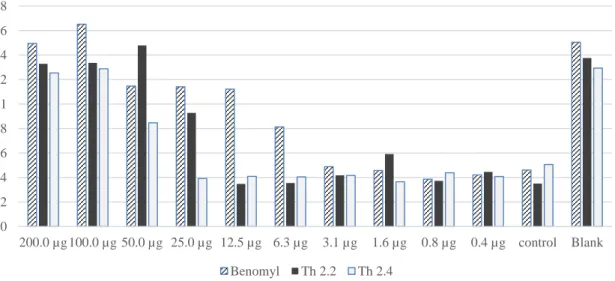
Based on this published research, the required concentration of viscotoxin A3 to inhibit the growth of F. Benomyl in this bioassay was used as positive control with serial dilution from 200 µg to 0.37 µg (first row). The concentration of viscotoxin A3 required to completely inhibit F.solani growth was 31 µg/ml (6.4 µM), which is slightly higher than the published result.
The biological test for different fungal strains was repeated several times and in most cases the same results were obtained for viscotoxin A3. As shown in the last graphs, the same results were obtained for F.oxysporum as for F.culmorum and V.Dahilae, but no antimicrobial activity was observed for viscotoxin A3. Figure 39 shows better growth of F.oxysporum and V.dahilae compared to F.culmorum in the blank or wells with lower concentration of Benomyl and the color change was easier to distinguish.

Fusion proteins bioassay results
Resazurin absorbance of the plate was measured after 48 hours and the following results were obtained. The Minimal medium used in that study had no negative effect on the growth patterns of the tested Aspergillus strains (Mania et al., 2010). It is difficult to describe why viscotoxin A3 did not show any antibacterial activity in this bioassay.
In contrast, the antifungal activity of viscotoxin A3 was expected in this experiment more because their activity in F.solani,S. The tested concentration of viscotoxin A3 against the 3 bacterial strains was much higher than the concentration used for fungi. Antifungal activity of viscotoxin A3 in F.solani was observed as we expected based on previous reports (Giudici et al., 2004, Giudici et al., 2003).
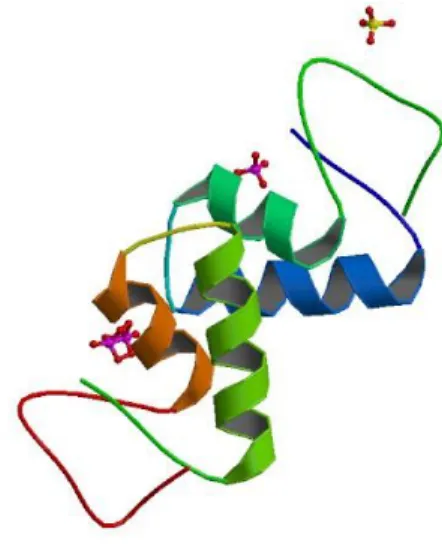
The resazurin-based bioassay has not been used in other studies to test the antimicrobial activity of viscotoxin A3 and was applied for the first time in this experiment. NMR structural determination of viscotoxin A3 from Viscum album L. Processing of thionine precursors in barley leaves by a vacuolar proteinase.