This approach is based on the trend of the share of Belgian industries in the total added value of the European Union (EU15). In fact, the goal is not to gain export market shares if the share of exports in local added value decreases because exporters call more often on foreign suppliers. The reason for maintaining the competitive position of the economy, especially the small economy, is rooted in the need to maintain the creation of added value within the borders of the country in order to ensure economic growth.
The purpose of this paper is to examine the determinants of the development of Belgian value added in the EU at the industry level to take into account industry-specific conditions such as the degree of competition, the presence of foreign multinationals or the technological mutation. The intuitive assumption, based on economic theory, is that falling prices below European allow industries to increase the share of European value added created in Belgium. The econometric results indicate that movements in relative prices were a significant determinant of the Belgian share of European value added for manufacturing and market services.
The second series of determinants is related to the main components of the evolution of the price of added value: the costs per unit of the factors of production, labor and capital. The results underline the importance of relative TFP as a determinant of the relative position of the European manufacturing and services market.
Introduction
Descriptive analysis
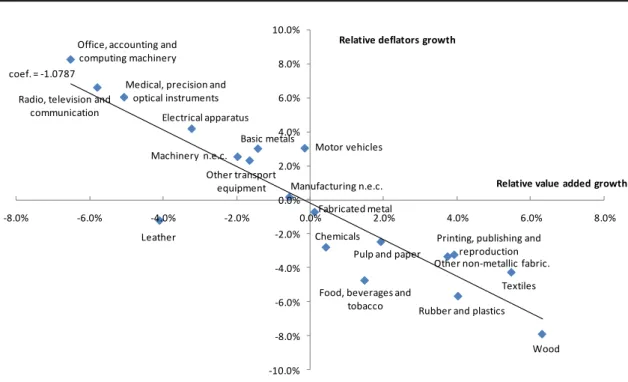
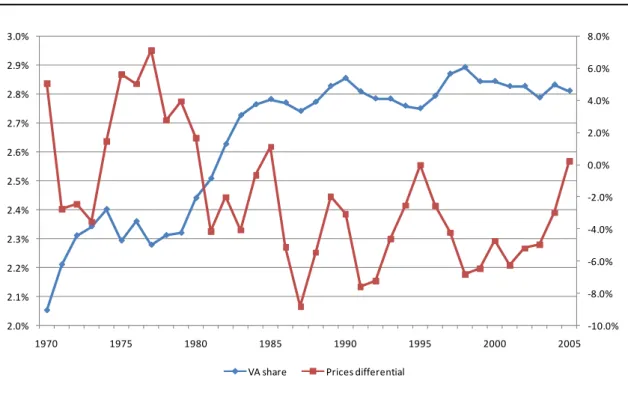
Manufacturing industries 2
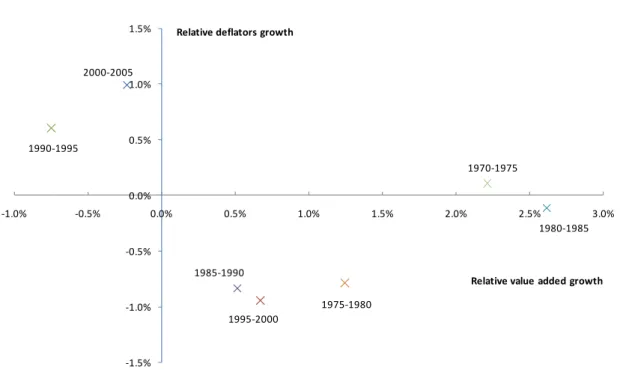
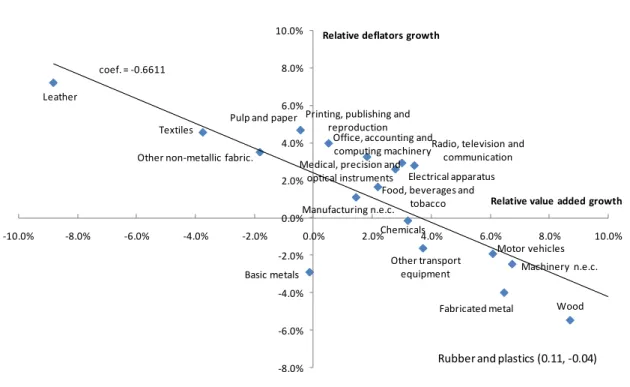
However, given the weight of the 7 industries registering an improvement, manufacturing as a whole was able to improve its relative position in the EU15. The negative relationship between the increase in relative added value and the increase in relative prices has been proven for all manufacturing industries except one (leather). As only 6 industries were able to improve their relative position, manufacturing as a whole saw a deterioration in its relative position in the EU15.
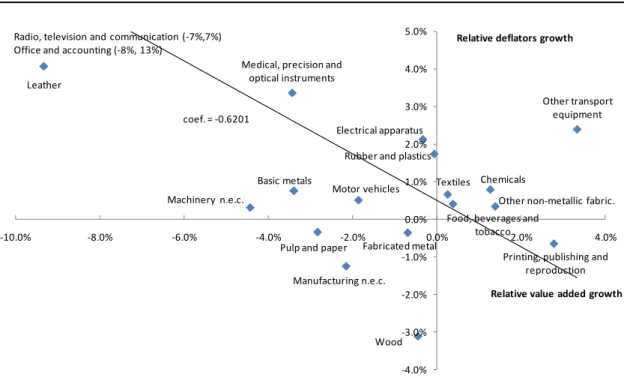
During this period, which also included the crisis caused by the collapse of the dot-com bubble, the manufacturing industry managed to improve both its relative position in the EU15 and its relative prices. Overall, the industry recorded a deterioration in both its relative position in the EU15 and its relative prices. The timber industry also achieved a constant improvement in its relative position in the EU15, except in the period 1990-1995.
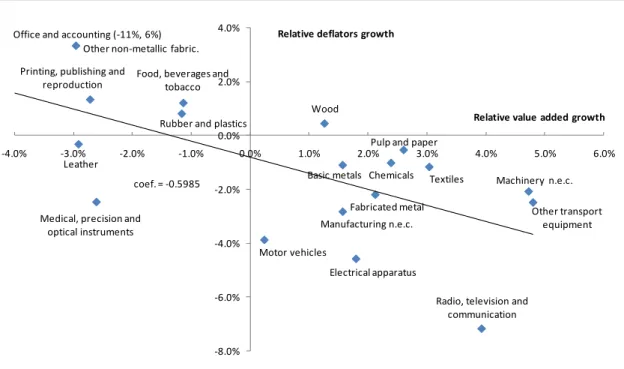
Since the mid-eighties, this industry has seen a deterioration in its relative position both in Belgium and in the EU15. Across all these industries, which accounted for 2.3% of Belgian value added in volume, they had an improvement in their relative position. Furthermore, 1% of the EU15 market's value added at constant prices is represented in the value added on the Belgian market.
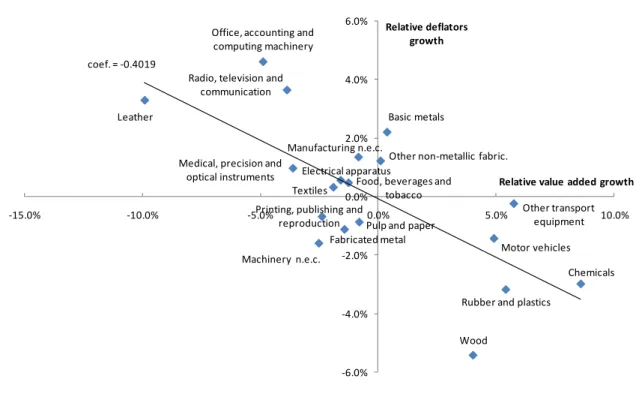
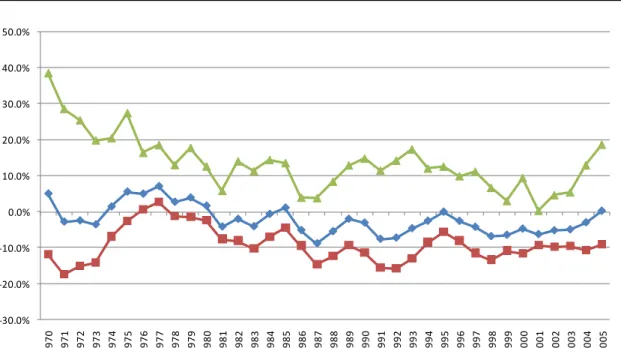
Supermarket services had a negative development of their relative added value combined with a deterioration of their relative prices. Overall, relative to the weight of industries that recorded a sharp deterioration in their relative position, Belgian market services recorded slightly slower growth in value added than market services in the EU15. The relative position of many market services has worsened, with industries accounting for 69% of the value added of Belgian market services experiencing slower growth in their relative value added and faster growth in their relative prices.
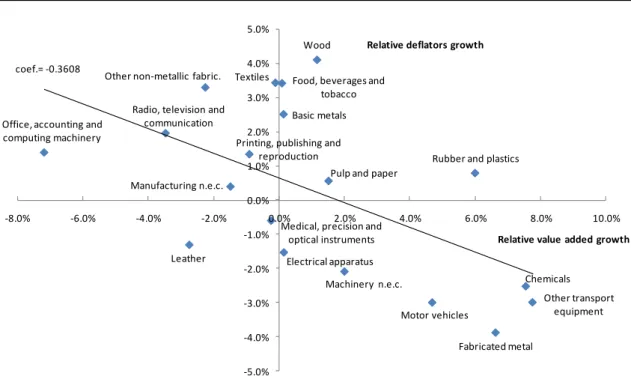
During this period, all service industries recorded a deterioration in their relative prices, even those that managed to improve their relative position in the EU15. Above services faced a deterioration in relative value added growth and relative price growth. Market services as a whole saw one of the worst deteriorations in their relative position in the EU15, even if relative price growth was relatively limited.
The most recent period is the first characterized by a general improvement in the relative position of the Belgian services market in the EU15, despite the continued deterioration of their relative prices. Since 1975, they have registered an almost constant deterioration in their relative position in the EU15.
Basic equation 23
In the short term, the evolution of the relative deflator has a significant negative effect on the evolution of the relative position of both manufacturing and market services (β in Table 1). The expected relationship between the relative unit costs and the relative added value is therefore negative: if the unit labor costs or the capital costs per unit product increase on average faster in a Belgian industry than in Europe, the growth of the added value is expected to of Belgian industry will grow slower than European, leading to a deterioration of its relative position in the EU15. Given the data available in the EUKLEMS database, relative prices can be disentangled into relative unit labor costs (ln(ULCBEi/ULCEUi)) and relative unit capital costs (ln(UCCBEi/UCCEUi)).
This is not surprising given the importance of labor in the production function. During 1986 to 1993, divergences appeared in the development of the two relative unit costs, with a stabilization of the relative unit labor costs and an increase in the relative unit capital costs. In the long run, only relative unit labor costs have a significantly negative elasticity (-1.03), less than the long-run price elasticity (for memory, this elasticity is given in the last line of Table 2).
For market services, the short-run coefficient of relative unit labor costs is significant and very close to the coefficient for production (β in Table 2). However, the long-run relative elasticity of unit labor costs is much lower than that for industry. For market services, the relative unit labor cost elasticity is also higher than the relative price elasticity.
The main divergence in the results comes from the coefficients of relative unit capital costs (φ and E UCC in Table 2). As shown in Table 3, for Belgian manufacturing, a faster increase in productivity than the European counterparts has a positive impact on the relative position in the EU15 (coefficient ν). As expected, the relative hourly wage has a negative short-term (β in Table 3) as well as long-term impact (E WAG in Table 3) on the relative position of Belgian manufacturing.
Previous results have underlined the importance of relative productivity to maintain and strengthen Belgium's relative position in the EU15. The evolution of the relative share of Belgian value added in the EU15 was influenced by changes in the relative value added deflator. However, this elasticity is smaller than the relative price elasticity for manufacturing and higher for market services.
Relative capital deepening is also an important long-term determinant of the relative position of manufacturing activities in the EU10. The econometric results justify the implementation of this law with the importance of the relative elasticity of unit labor costs.
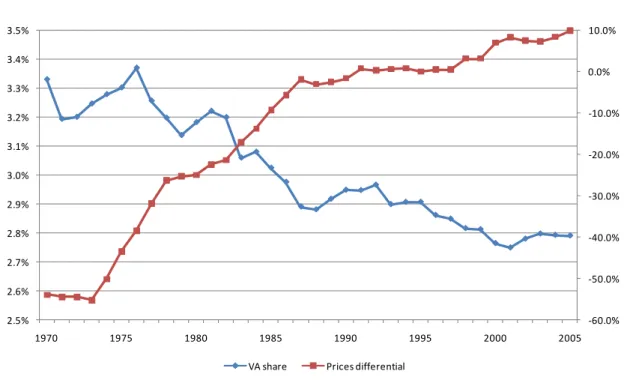
Relative importance of industries for the Belgian economy and in the EU 15