In the civil service system, most social benefits, including pensions, are financed from the general budget of the federal government. The new projection follows the rule defined by the AWG, i.e. the national rule (adjustment by 1% per year in real terms as in the "Generation Pact") for the first 10 years and then the growth of the average salary. Abolition of career unit8 in salaried and self-employed schemes, change in the valuation of assimilated periods of unemployment in the salaried scheme.
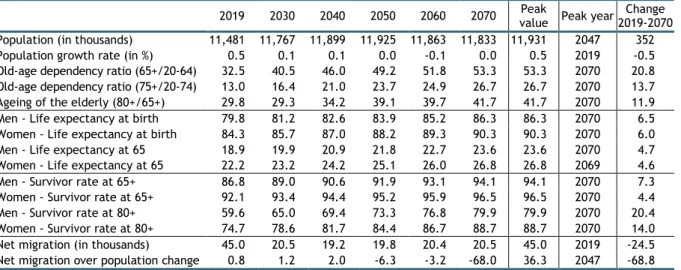
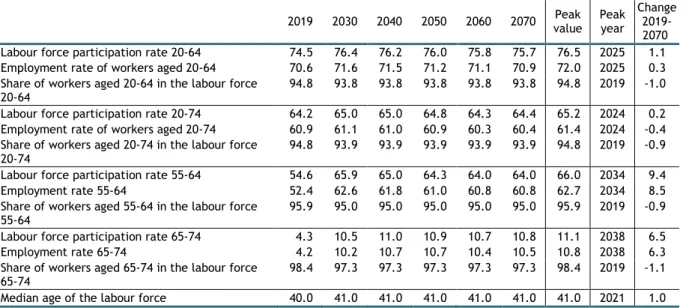
The Self-Employed Scheme: abolition of the correction coefficients used in the calculation of the pension. The slight increase in the total population is entirely due to the migration flow until 2040 (see the relation between the migration increase and the variation of the total population). As a result, the development of the employment rate is less favorable in the new projection: +0.3 percentage points between 2019 and 2070 compared to +2.4 percentage points in the 2018 Aging Report.
The net public pension expenditure (gross expenditure excluding contributions and taxes paid by the social security beneficiaries) is about 85% of the gross public pension expenditure. The development of the compensation ratio at retirement (the first pension divided by the last salary) and of the benefit ratio (the average pension benefit divided by the economic average salary) is illustrated in table 11. The development of the benefit ratio follows the development of the coverage ratio at retirement.
The pension system's burden of dependents increases from 60.7% in 2019 to 85% in percentage points due to the increase in the number of pensioners and the decrease in employment. The next two tables respectively show the ratio between the number of pensioners and the inactive population (table 13) and the ratio between the number of pensioners and the population (table 14). The total pensioner percentage for the age group 65-69 will decrease between 2020 and 2030 due to the increase in the statutory retirement age.
In the civil service scheme, most social benefits, including pensions, are financed by the general budget of the federal government. The higher life expectancy (by 2 years) scenario generates higher public pension expenditure compared to the baseline scenario (+0.8 percentage points of GDP in 2070), due to the larger number of pensioners (higher old-age dependency ratio). In the lower fertility scenario (-20%), public pension expenditure in 2070 is 1.8 percentage points of GDP higher compared to the baseline.
Lower productivity growth is then fully reflected in the growth of the pension amount for new retirees after more than 40 years. It will be fully reflected in the growth of the average pension of all beneficiaries over at least another 20 years. In the new pension projection, government expenditure on pensions will increase by 3.0 percentage points of GDP between 2019 and 2070.
From 2013 to 2019, real GDP is higher due to the upward revision in the National Accounts.

Description of the pension projection model and its database
Institutional context 34
Box 5 Coverage of the MALTESE model (social expenditure retained for the AWG pension projection is in bold). Therefore, the chosen solution is that the projection of administrative employment and unemployment is aligned with the AWG labor force projection at two levels: the labor force participation rate for the population aged 55 to 71 years and the global employment rate. This assumption ensures the greatest possible consistency between the development of the labor force and the development of the retired population.
The trend of the administrative participation rate of the younger age groups is also in line with the evolution shown in the AWG projection. The distribution per scheme (salaried, self-employed and civil servant) of the beneficiaries at the statutory retirement age is determined according to the historical evolution of activity per scheme of the corresponding gender. The effects of this reform on retirement are in line with the labor force projection of the AWG.
The projection also takes into account the survivor pension reform with the gradual increase of the minimum entry age to 50 in 2025. In line with the mid-term projection of the National Institute for Health and Disability Insurance, the entry probabilities and the probabilities of remaining disabled are to the mid-2020s, implying increasing disability rates. The increase in the statutory retirement age also implies an increase in the number of disabled people.
From the mid-2020s, we assume that the entry probabilities and the probabilities of remaining disabled gradually decrease until the 2040s. The evolution of the profile of young retirees depends mainly on socio-economic and macroeconomic projections. The assumption of increased productivity also has an impact on the evolution of the average amount of pensions through the evolution of average wages.
For recipients and the self-employed, this wage trend is reflected in the long term, as their pension is calculated on the basis of the average income over their entire career. At the beginning of the projection period, this average income is calculated almost entirely on the basis of observed data. In the scenario without the 2015 pension reform, the average working life of male pensioners within different systems was assumed to depend on the generational participation profile (historical participation rate for 5-year age groups).

Economy-wide average wage at retirement 40
However, double counting between civil servant scheme pensioners and salary and self-employed scheme pensioners could not be avoided. To obtain the number of pensioners, we first assume that there is no double counting of under-60s. For ages over 59, the number of pensioners is obtained on the basis of observed data regarding double counting between pensions of civil servants. Scheme and the scheme of non-salaried workers (15% of salary pensions) and between pensions of the civil servants scheme and the self-employed scheme (7% of self-employed pensions).
In the assistance scheme (guaranteed income for older people), double counting rates with other schemes are much higher (78% for women, 92% for men and 83% overall) because this minimum non-contributory pension represents in most cases. from cases an addition to another pension. We assume that all double counting rates are the same across age groups and remain largely unchanged throughout the projection period. The gross pension is subject to contributions: 3.55% for health care if the pension benefit exceeds a limit, a solidarity contribution between 0 and 2% according to the pension benefit and a 0.5% contribution for funeral expenses in the civil servants' scheme.
Retirement benefits are taxed above a minimum amount that varies according to the number of dependent children. For this exercise we use the OECD database which provides detailed information on the impact of the tax system on social expenditure23 (instead of an old estimate). It should be noted that the guaranteed income for the elderly (contributory minimum pension) is not taxed.
An income-free pension is a guaranteed income for older people (assistance scheme). The driving force behind its expenditure is the number of beneficiaries and their average benefit amount. The number of beneficiaries depends on the growth of the elderly population and the number of pensioners.
As the minimum income guarantee is a means-tested scheme and more than 80% of its beneficiaries also receive a pension benefit (almost exclusively in salaried or self-employed schemes), the average benefit amount is affected by the maximum amount of this assistance scheme and the development of pension benefits in the salaried and self-employed scheme. In the AWG exercise, the average effective amount of the minimum income guarantee grows during the first ten years of the projection in accordance with the provisions of the "Generation Pact", which is 1%.