1
Gliding arc plasma for CO
2conversion: better insights by a combined
1
experimental and modelling approach
2
Weizong Wang*,1, Danhua Mei2, Xin Tu2 and Annemie Bogaerts1 3
1. Research group PLASMANT, Department of Chemistry, University of Antwerp, Universiteitsplein 1, 4
B-2610 Wilrijk-Antwerp, Belgium 5
2. Department of Electrical Engineering and Electronics, University of Liverpool, Brownlow Hill, 6
Liverpool L69 3GJ, United Kingdom 7
E-mail: [email protected], [email protected], [email protected] 8
Highlights 9
A two dimensional self-consistent model is developed and validated by the direct experiment.
10
Gliding arc shows a strong non-equilibrium character of the conversion process, explaining the 11
higher values of conversion and energy efficiency than thermal process.
12
A chemical kinetics analysis shows that the CO2 vibrational levels significantly contribute to the 13
CO2 dissociation.
14
Promoting the vibrational kinetics, reducing the recombination of CO with O2 and increasing the 15
CO2 fraction treated by the arc can further improve the conversion and energy efficiency.
16
Abstract 17
A gliding arc plasma is a potential way to convert CO2 into CO and O2, due to its non-equilibrium 18
character, but little is known about the underlying mechanisms. In this paper, a self-consistent two- 19
dimensional (2D) gliding arc model is developed, with a detailed non-equilibrium CO2 plasma 20
chemistry, and validated with experiments. Our calculated values of the electron number density in 21
the plasma, the CO2 conversion and energy efficiency show reasonable agreement with the 22
experiments, indicating that the model can provide a realistic picture of the plasma chemistry.
23
Comparison of the results with classical thermal conversion, as well as other plasma-based 24
technologies for CO2 conversion reported in literature, demonstrates the non-equilibrium character 25
of the gliding arc, and indicates that the gliding arc is a promising plasma reactor for CO2 conversion.
26
However, some process modifications should be exploited to further improve its performance. As the 27
model provides a realistic picture of the plasma behaviour, we use it first to investigate the plasma 28
characteristics in a whole gliding arc cycle, which is necessary to understand the underlying 29
mechanisms. Subsequently, we perform a chemical kinetics analysis, to investigate the different 30
pathways for CO2 loss and formation. Based on the revealed discharge properties and the underlying 31
CO2 plasma chemistry, the model allows us to propose solutions on how to further improve the CO2
32
conversion and energy efficiency by a gliding arc plasma.
33
Keywords: CO2 conversion, gliding arc, non-equilibrium plasma, plasma chemistry, splitting 34
mechanisms, breakdown 35
Submitted to Chemical Engineering Journal 36
37 38
2
1. Introduction 1
Plasma technology offers unique perspectives, because of its capacity to induce chemical 2
reactions within gases at ambient temperature and pressure, due to its non-equilibrium character.
3
Plasma is created by applying electric power to a gas, causing breakdown of the gas into ions and 4
electrons and also producing a large number of reactive species, such as various radicals and excited 5
species. This makes plasma a highly reactive cocktail, which is quite promising for greenhouse gas 6
conversion. Indeed, the inert CO2 gas is activated by electron impact ionization, excitation and 7
dissociation. Furthermore, plasma is very flexible and can easily be switched on and off, so it is quite 8
promising for storing peak renewable energy into fuels. Indeed, more and more electrical energy 9
nowadays is produced from renewable energy sources (wind or solar), which often suffer from 10
fluctuating peak powers, making it difficult to match the supply of this electricity with the demand.
11
This surplus of electricity can in principle be used in plasma to convert greenhouse gases into value 12
added chemicals when adding a suitable H-source to the CO2 gas, such as H2O, CH4 or H2. However, 13
there is still a long way to go, certainly if we target the selective production of some value-added 14
products, for which the combination with a suitable catalyst would be needed. This makes plasma 15
based greenhouse gas conversion fit in principle in the framework of green chemistry [3]-[4] and also 16
complies with the “cradle-to-cradle” principle [5].
17
Gliding arc (GA) plasmas are potential plasma sources for gas conversion [6]-[20] because they 18
offer benefits of both thermal and non-thermal discharges. They are typically considered as ‘warm’
19
discharges, which are characterized by a better energy efficiency than other types of plasmas. The 20
reason is that they provide efficient vibrational excitation of the molecules, which is seen as the most 21
energy-efficient way to split CO2 molecules [21].
22
In order to improve the applications (i.e., mainly gas conversion), the physical and chemical 23
characteristics of the GA have been extensively studied by experiments, including high-speed 24
photography [22], electrical measurements [23]-[25] and spectroscopic measurements [26]-[27].
25
Besides experiments, detailed modelling is also very useful to provide more insight into the 26
underlying reaction mechanisms of plasma assisted gas conversion or synthesis, not only in a GA but 27
also in other types of plasmas. For example, computer modeling is widely used to evaluate quantities 28
which are difficult to measure, and to identify the most important chemical reactions [28]-[33].
29
However, only a few papers in literature deal with modelling of a GA, typically applying a 1D 30
analytical model, such as the Elenbaas–Heller model [35] or the plasma string model [36] without a 31
detailed description of the chemical reactions occurring in the GA. Recently, a 2D non-quasi-neutral 32
model was presented to study the arc root movement in an argon GA [37]-[38]. Moreover, 3D quasi- 33
neutral models for a novel type of GA plasmatron [39] and a classical diverging electrode GA reactor 34
[40]-[41] were also reported. However, these models were all developed for argon. For a GA 35
operating in CO2, the large number of species and related chemical reactions makes spatially 36
resolved models computationally expensive. That is why only a limited number of numerical studies 37
were reported so far on this subject, with only two papers for GA based CO2 conversion published to 38
It is clear that more research is needed to fully exploit the capabilities of the GA for CO2
39
conversion. In this paper, we therefore present a combined modeling and experimental study, based 40
– for the first time – on a 2D model. The aim of this study is not only to elucidate the underlying 41
mechanisms, but also – based on the obtained insights – to propose solutions on how to further 42
improve the performance of the GA for CO2 conversion.
43
3
2. Experimental setup of the GA reactor 1
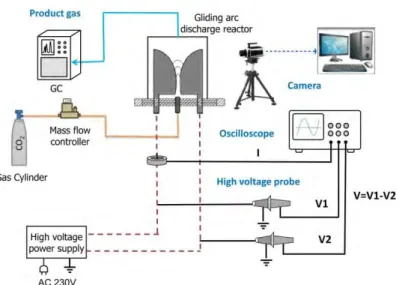
2 Figure 1 Schematic diagram of the GA experimental set-up 3
Figure 1 illustrates the experimental setup of the GA and surrounding measurement equipment.
4
The GA reactor consists of two stainless steel semi-ellipsoidal electrodes with thickness of 2 mm (60 5
mm long and 18 mm wide) fixed in an insulating bracket and symmetrically placed on both sides of a 6
gas nozzle with a diameter of 1.5 mm. The reactor is designed to facilitate easy electrode 7
replacement, and the discharge gap between both electrodes, as well as the distance between the 8
nozzle exit and electrode throat, is adjustable. Pure CO2 gas was injected into the GA reactor and it 9
pushes the arc plasma, which is initiated at the shortest gap between both electrodes, towards larger 10
interelectrode distance until it extinguishes, and a new arc is created at the shortest gap. The plasma 11
reactor was connected to a neon transformer (SIET, 230 V/10 kV, 50 Hz). The arc voltage was 12
measured by a high voltage probe (Testec, TT-HVP 15 HF), while the arc current was recorded by a 13
current monitor (Magnelab, CT-E 0.5-BNC). All the electrical signals were sampled by a four-channel 14
digital oscilloscope (Tektronix, MDO 3024). The arc dynamics are revealed by means of a digital high- 15
speed camera (Phantom V.7.1) which can record up to 4,800 pictures per second using the full 16
800x600 pixel SR-CMOS imaging sensor array. The measurement technique was intensely optimized 17
to fine-tune the best recording conditions. The frame rates to visualize the arc propagation and the 18
exposure time of the detector to enhance the contrast between the arc and the reactor were 19
investigated. The products of the CO2 conversion after passing through the GA reactor were sampled 20
when the plasma reaction has reached a stable condition, i.e., typically after 30 min. The gaseous 21
products were analyzed by a gas chromatograph (Shimadzu, GC-2014) equipped with a thermal 22
conductivity detector (TCD) and a flame ionization detector (FID). As we mention below, a standard 23
case of 2.5 L/min and 40W is used to validate our model. Furthermore, the vertical distance between 24
the nozzle exit and electrode throat was 2 mm and the shortest discharge gap between the two 25
electrodes was also 2 mm.
26
The plasma power is calculated by integration of the arc voltage and current, as shown in Eq. (1).
27
∫ (1) 28
The conversion of CO2, , is defined as:
29
( ) ( ) ( )
( ) (2)
30
4
where CO2(in) and CO2(out) are the CO2 signals without and with plasma, respectively. Since the method 1
mentioned above does not account for the gas expansion due to CO2 splitting, a correction factor is 2
used, which is explained in the supplementary information of Ref [33].
3
In order to calculate the energy efficiency of CO2 conversion, the specific energy input (SEI) in 4
the plasma is defined as:
5
( ) ( ) (
) (
) (3)
6
where the flow rate is expressed in Ln/min (liters normal per minute) with reference conditions at a 7
temperature of 0 °C and a pressure of 1 atm.
8
The energy efficiency, ƞ, is calculated as:
9
( ) (
) ( ) ( ) (
) (4)
10
where is the reaction enthalpy of CO2 splitting (i.e., 279.8 kJ/mol), is the amount of CO2
11
converted, SEI is defined above and 22.4 L/mol is the molar volume at 0 °C and 1 atm.
12
The experiments were performed 4 times and they were reproducible within +/- 5% of the 13
averaged values.
14
3. Description of the 2D plasma slab model 15
3.1 The GA reactor geometry 16
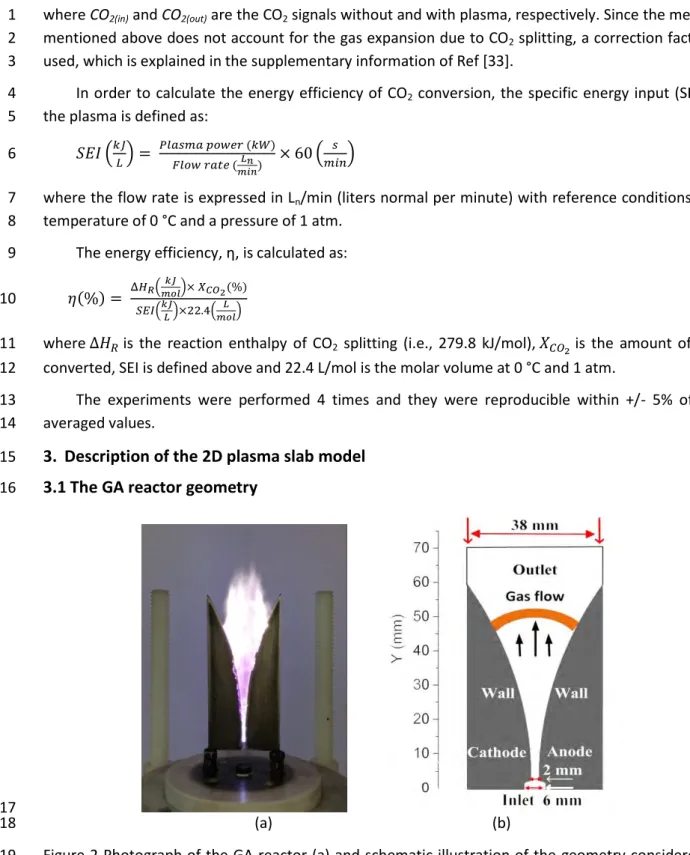
17 (a) (b) 18
Figure 2 Photograph of the GA reactor (a) and schematic illustration of the geometry considered in 19
the model (b).
20
The 2D fluid model that we developed applies to a Cartesian geometry, which allows to describe 21
the gliding of a ‘2D arc’, which is basically a finite plasma slab. The simulated geometry in the 22
direction perpendicular to the simulation plane is assumed to be equal to the electrode thickness of 23
2 mm. Hence, the electrical current in the 2D model is obtained by integration of the current density 24
over the arc slab, which fits the experimental signal. Furthermore, the flow field is determined by 25
taking into account a flow passing channel with a depth of 2 mm with the specified flow rate. In this 26
5
way, the calculated gas velocity is similar to the experimental data when the vertical distance 1
between the nozzle exit and electrode throat was 2 mm and the shortest discharge gap between the 2
two electrodes was also 2 mm. Indeed, a rough estimation of the experimental gas velocity is 3
obtained by examination of the arc displacement shown in successive high-speed photographs (see 4
supporting information). In principle, a 3D model would be required to describe the GA behaviour in 5
a realistic way, in view of the intrinsic 3D nature of the GA. However, a 3D model is very time 6
consuming and it requires significant computer resources, especially when modelling a CO2 plasma 7
with complicated plasma chemistry. Furthermore, previous work for an argon GA [40] has shown 8
that the results of a 2D model compare well with those of a 3D model, and can thus be used for a 9
better understanding of the GA basic characteristics. The total width and height of the model 10
geometry, including the region outside the electrodes where the gas can flow without passing 11
through the arc, is 38 mm and 70 mm, respectively.
12
3.2 CO2 plasma chemistry and treatment of the vibrational levels 13
The chemistry set is based on the full chemistry set developed by Kozák and Bogaerts [28]-[29]
14
with a 0D model, but reduced to include only the most important species and processes. In this way, 15
we can avoid excessive calculation times in this 2D model, but we still account for the vibrational 16
kinetics, which is crucial for describing CO2 conversion in a GA plasma reactor [43]. The list of species 17
considered in the model is shown in table 1. These species include various neutral molecules in the 18
ground state, as well as in various electronically and vibrationally excited levels, a number of radicals, 19
positive and negative ions, and the electrons. In the full model of Kozák and Bogaerts [28]-[29], 25 20
CO2 vibrational levels (i.e., 4 effective levels of the symmetric modes and 21 levels of the asymmetric 21
stretch mode, up to the dissociation limit) were taken into account. However, to further reduce the 22
calculation time, which is needed to implement this chemistry in a 2D model, Berthelot and Bogaerts 23
[44] developed a level lumping method, which groups the 21 asymmetric stretch mode vibrational 24
levels into a number of lumped levels, without loss of essential information. We applied this level 25
lumping method in [43] for a 1D gliding arc model, and we illustrated that lumping the 21 levels into 26
3 groups can reproduce the plasma properties, the vibrational distribution function (VDF) and the 27
CO2 conversion very well. Therefore, we adopt here the same level lumping method with 3 groups 28
for the asymmetric stretch mode, with each group including 7 vibrational levels (group 1: CO2[v1-v7], 29
group 2: CO2[v8-v14], group 3: CO2[v15-v21]). The species number density of each level within one 30
group can be determined following the method described in [43-44]. Besides, we also take into 31
account the 4 effective levels of the symmetric modes (CO2[va] – CO2[vd]), 1 electronically excited 32
level of CO2 (CO2[e]), and 3 vibrational levels of O2 (O2[v1] - O2[v3]), as indicated in table 1.
33
Table 1 Overview of the plasma species included in the model.
34
Neutral ground state species CO2, CO, C, O2, O
Neutral excited states CO2[va], CO2[vb], CO2[vc], CO2[vd], CO2(v1-v7], CO2[v8-v14], CO2[v15-v21], CO2[e], O2[v1], O2[v2], O2[v3]
Charged species , , , , ,
All these species undergo a large number of chemical reactions, i.e., electron impact collisions 35
with neutral species, leading to excitation, ionization, dissociation and electron attachment, 36
electron−ion recombination reactions, as well as many heavy-particle chemical reactions (i.e., ion-ion, 37
ion-neutral and neutral-neutral reactions). We pay special attention to the reactions of the 38
6
vibrational levels, i.e., electron impact vibrational excitation, and vibrational energy exchange upon 1
collision with ground state species or other vibrationally excited levels (i.e., so-called vibrational- 2
translational (VT) and vibrational-vibrational (VV) relaxation, respectively). Moreover, the same 3
chemical reactions as for the ground state species are carefully included for the vibrational levels as 4
well, because the vibrational energy can help overcome the activation energy barrier of the reactions 5
and thus increase the reaction rate of CO2 splitting. The chemical reactions, the corresponding rate 6
coefficients and the references where these data were adopted from, are listed in our previous work 7
[43].
8
3.3 System of governing equations and boundary conditions 9
The model calculates the densities of all the plasma species, the electron temperature and gas 10
temperature and the electric field in the GA, as well as the gas flow profile. We assume electrical 11
neutrality in the plasma, because the sheath is not considered in our model. This assumption has no 12
significant influence on the arc column [41]. The species densities and the electron mean energy are 13
calculated with continuity equations based on transport and on production and loss terms defined by 14
the chemical reactions (and by Joule heating for the electron energy). The species transport is based 15
on drift in the electric field and diffusion due to concentration gradients. As we assume electrical 16
neutrality in the arc plasma, the ambipolar electric field is calculated from the charged species 17
densities. The gas heat transfer equation is solved for the gas translational temperature, and finally, 18
the neutral gas flow, which is responsible for the arc displacement, is described by the Navier-Stokes 19
equations, providing a solution for the mass density and the mass-averaged velocity. The Navier- 20
Stokes equations are first solved separately, and subsequently, the obtained velocity distribution is 21
used as input data in the other equations, describing the plasma behavior and the gas heating. The 22
equations solved, as well as the corresponding boundary conditions, are explained in detail in the 23
supporting information. Finally, the external circuit and the power supply need to be specified in the 24
simulation. The source voltage has a sinus shape, Vsource = 7200sin (2π50t + 0.50) V, and a resistance 25
of 60 kΩ is used to limit the discharge current; it provides a total arc discharge power of 40 W, which 26
is similar to the typical experimental value at a gas flow rate of 2.5 L/min.
27
The equations are solved by means of the COMSOL Multiphysics software [45], a commercial 28
finite element software designed for solving problems of multi-physics. As initial values we assume 29
that the concentrations of CO2 in the ground state and in the various excited levels follow a 30
Maxwellian distribution at room temperature.
31
4. Results and discussion 32
In section 4.1 we will first validate our model by comparing our calculated values with 33
experimental data for the electron number density (which is one of the most important plasma 34
properties), as well as for the CO2 conversion and corresponding energy efficiency. Subsequently, in 35
section 4.2 we will benchmark our results for the CO2 conversion and energy efficiency to the 36
classical thermal conversion process and to other plasma-based technologies for CO2 conversion 37
reported in literature. This allows us to provide a clear overview of the capabilities of the GA for CO2
38
conversion, as well as its limitations, for which we should propose some process modifications, to 39
further improve the results. In order to achieve this, we need a better insight in the typical discharge 40
characteristics, as calculated by the model, which will be presented in section 4.3. Furthermore, we 41
will also perform a chemical kinetics analysis in section 4.4, to elucidate the role of various plasma 42
species and their reactions in the GA based CO2 conversion. Finally, based on the revealed discharge 43
7
properties and the obtained plasma chemistry, we will propose in section 4.5 some solutions on how 1
to further improve the CO2 conversion and the energy efficiency by the GA.
2
4.1 Experimental validation of the model 3
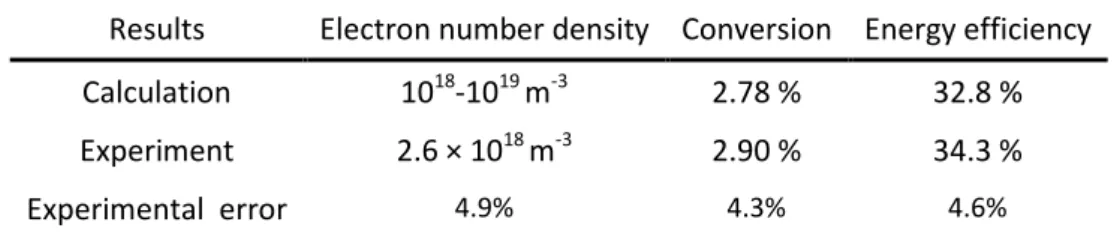
Table 2 Comparison of our calculated values for electron number density, CO2 conversion and 4
energy efficiency, with the experimental data, at a gas flow rate of 2.5 L/min and a discharge power 5
of 40 W.
6
Results Electron number density Conversion Energy efficiency Calculation 1018-1019 m-3 2.78 % 32.8 %
Experiment 2.6 × 10¹⁸ m-3 2.90 % 34.3 %
Experimental error 4.9% 4.3% 4.6%
In table 2 we compare our calculated results for the electron number density, CO2 conversion 7
and corresponding energy efficiency with the corresponding measured values, at a typical 8
experimental gas flow rate of 2.5 L/min and a discharge power of 40 W.
9
The experimental electron number density is obtained from the electrical characteristics and the 10
high speed camera images, as follows. During the propagating phase of the GA, the average 11
experimental voltage drop across the arcs is V ≈ 1.20 kV with an average current of I ≈ 0.06 A (see 12
figure S1 of the supporting information), leading to an average arc impedance <R> = V/I ≈ 20 kΩ. The 13
radius of the arc (λ ≈ 1 mm) and the average length (<w> ≈ 15 mm) are obtained by the high speed 14
camera recordings (see figure S2 of the supporting information). With this information, we can 15
calculate the average arc electrical conductivity, σ, as 16
〈 〉
(5) 17
yielding σ ≈ 0.24 S/m. The conductivity can be related to the electron density through the electron 18
mobility, μe, using:
19
(6)
20
With e the electron charge. Using a time averaged gas temperature of 2400 K and an electron 21
temperature of 1.7 eV, as obtained from our model (see section 4.3), we calculated 22
by means of a Boltzmann equation solver BOLSIG+ [46]. Hence, formula (6) gives an 23
estimate of the time and spatially averaged electron number density, <ne> ≈ 2.6 × 10¹⁸ m-3. Our 24
calculations predict the maximum electron number density in the discharge channel to be around 25
1019 m-3 (see section 4.3). Considering the non-uniform distribution within the discharge channel, we 26
can obtain a spatially averaged value of the electron number density within the range 1018 m-3-1019 27
m-3, indicating a reasonable agreement between the calculated and measured values.
28
The calculated conversion of CO2, , is determined as:
29
∫ ∫
∫ ( ) ∫ ∫
∫ ( ) (7) 30
where ( ) is the particle flow rate of CO2 entering the reactor per second (in s-1), is the net 31
splitting rate of CO2 inside the arc (in m-3s-1), and l0 = 2 mm, is the thickness of the GA reactor (see 32
below).
33
8
The particle flow rate of CO2, ( ), represents the total number of CO2 molecules flowing 1
into the reactor per second, and is obtained as follows:
2
( )( ) (
) (
)
( ) ( )
( ) ( ) (8) 3
where k is the Boltzmann constant, Qn is the gas flow rate at the standard temperature T0 = 273 K 4
and pressure P0 =101325 Pa.
5
The net splitting rate of CO2, in m-3s-1,represents the net number of dissociated CO2
6
molecules per volume and per second, and is obtained by taking into account all the chemical 7
reactions, leading to destruction (when a positive value) or formation (when negative) of CO2
8
molecules. In order to determine the total conversion of CO2, as shown in equation (6), the net 9
splitting rate of CO2, , is integrated spatially over the whole reactor and temporally over the 10
whole gliding cycle. Because of the prohibitively long computation time in a 3D model, a 2D plasma 11
slab model is used, assuming that the distribution of plasma parameters in the direction 12
perpendicular to the simulation plane (see figure 2b) is uniform. As a result, the arc is not a “wire”
13
but a “slab” with a length l0 in the direction perpendicular to the simulation plane. We assume l0 is 14
equal to the thickness of the GA reactor, i.e., 2 mm. Thus the total conversion of CO2 in the 2D model 15
is obtained by the integration of the net splitting rate of CO2 over the arc slab with l0 = 2 mm.
16
Our calculated conversion and energy efficiency of CO2, at a gas flow rate of 2.5 L/min and a 17
discharge power of 40 W, are 2.78 % and 32.8 %, respectively, which is also in satisfactory agreement 18
with the experimental values of 2.90 % and 34.3 %. The comparison of these three key parameters 19
indicates that our model most probably can provide a realistic picture of the plasma chemistry.
20
Comparison of other plasma characteristics, such as the electron temperature or gas 21
temperature, was not possible, as the latter properties could not be determined in our experimental 22
setup, and are also not available in literature for a pure CO2 GA. This is probably because optical 23
emission spectrometry is not suitable here, as there are no proper spectral lines that can be used.
24
However, our calculated values for electron temperature (up to 1.7 eV) and gas temperature (up to 25
around 2700 K) are comparable with experimental data from literature, for GA reactors using other 26
molecular gases (nitrogen and air) [47]-[49],as well as for gaseous mixtures containing CO2 [50]-[51].
27
For example, Wu et al. [50] measured values for the electron excitation temperature of 28
approximately 1.1-1.7 eV, using a rotating GA reactor for a mixture of CH4/CO2. Moreover, in a non- 29
equilibrium GA "tornado" discharge using CO2 doped with 1% N2, the rotational gas temperature was 30
determined to be 2700K ± 50 K [51].
31
We can only compare here the calculated and experimental data at a gas flow rate of 2.5 L/min 32
and discharge power of 40 W, because at these conditions the arc was observed to glide smoothly 33
along the electrodes. Indeed, at higher gas flow rates, a phenomenon of back-breakdown occurs, 34
affecting the arc gliding process (see further). These back-breakdown events cannot self-consistently 35
be captured by the model, because this behaviour is mostly stochastic by nature and the arc 36
instabilities are not well defined. Therefore, we would need to make some assumptions in the model 37
on the number of back-breakdown events, and depending on the values assumed for the back- 38
breakdown frequency, we would always be able to obtain good agreement with the experiments.
39
Hence, we lose the real validation possibility at higher gas flow rates. Therefore, we could only 40
validate the model at a gas flow rate of 2.5 L/min and a discharge power of 40 W, where our high 41
9
speed camera did not record any back-breakdown events. However, in section 4.5, we will assess the 1
effect of a different number of back-breakdown events on the calculated conversion and energy 2
efficiency, which can in principle be correlated with different values of gas flow rate and discharge 3
power.
4
4.2 Comparison of our results with other plasma systems from literature 5
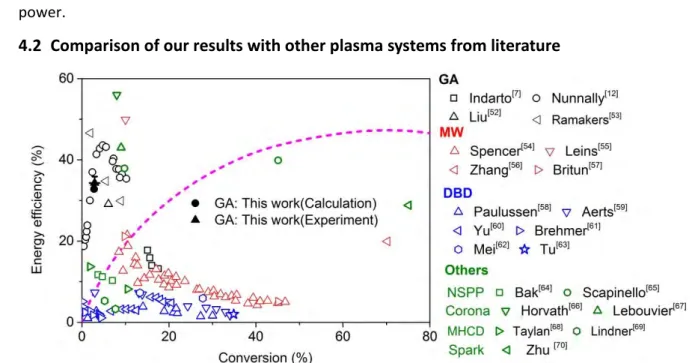
6 Figure 3 Energy efficiency vs CO2 conversion, obtained in our experiments and calculations (black 7
solid symbols), and comparison with other GA results from literature (black open symbols), as well as 8
with results from other types of plasma reactors used for CO2 conversion, operating at atmospheric 9
pressure. The thermal conversion limit is also indicated.
10
In figure 3, we compare our results for the energy efficiency vs CO2 conversion with data 11
obtained from literature for CO2 splitting, in other GA discharges [7],[12],[52],[53], as well as in other 12
types of plasma reactors, such as microwave (MW) plasma [54]-[57], dielectric barrier discharge (DBD) 13
[58]-[63], nano-second pulsed plasma (NSPP) [64]-[65], corona discharge [66]-[67], micro hollow 14
cathode discharge (MHCD) [68]-[69] and spark discharge [70]. We can conclude that in terms of 15
energy efficiency, the GA plasma is very promising, similar to the corona discharge [66]-[67]. It should 16
be mentioned that for MW plasmas some higher energy efficiencies (i.e., up to 80 and 90%) were 17
obtained in literature by Rusanov et al.[71] and Asisov et al.[72], respectively. However, their MW 18
plasma reactors were operating at a reduced pressure of 0.06 - 0.26 atm and 0.05 – 0.2 atm, 19
respectively, and thus they need vacuum equipment. This makes it more difficult to be applied on 20
industrial scale, and the energy cost of the pumping system should also be included when calculating 21
the energy consumption. Bongers et al. recently obtained values up to 50%, when applying a reverse 22
vortex gas flow [73], but again these experiments were conducted at reduced pressures of 150 – 600 23
mbar (0.15 – 0.60 atm). In order to allow a fair comparison, we therefore only present results in 24
figure 3, obtained at atmospheric pressure. When the MW discharge is operating at atmospheric 25
pressure, the reported energy efficiency dramatically drops to values of about 5 - 20 % [54]-[57].
26
If we compare our results with those obtained in other GA reactors from literature, it is 27
important to explain that there exist roughly two different reactor designs. The classical GA reactor, 28
which is used in this study, typically consists of two plane diverging electrodes between which the gas 29
flows. In contrast, recently a three-dimensional GA reactor, consisting of cylindrical electrodes with 30
tangential gas inlet, leading to a vortex gas flow configuration, has been developed, also called GA 31
10
plasmatron (GAP) *21+. Indarto et al. *7+ applied a classical GA configuration, like in our case, and they 1
obtained a highest energy efficiency of around 17%, which is much lower than our current work. On 2
the other hand, Nunnally et al. *12+, Liu et al. [52] and Ramakers et al. *53+ used a vortex flow GAP, 3
which can reach a somewhat higher conversion and energy efficiency. This reactor design is indeed 4
very promising, because it can be more easily implemented in industry and the specific gas flow 5
configuration ensures the gas treatment to be more uniform. This indicates that a better design of 6
the classical GA reactor, to enhance the treated gas volume, would improve the conversion 7
performance, as will be discussed in detail in section 4.5 below. However, in general we can deduce 8
from figure 3 that the GA plasma shows a very good performance with a relatively high energy 9
efficiency. This is because the energy efficient vibrational excitation processes are favoured, as will be 10
revealed in section 4.4 below.
11
It is obvious from figure 3 that a DBD plasma [58]-[63] has a reasonable conversion but a quite 12
low energy efficiency. This is due to the non-ideal operating conditions, as the electron temperature 13
is typically higher than in a GA (or MW) plasma *21+,*74+, and the mechanism of CO2 conversion 14
involves charged and electronically excited species, and thus it is limited by the high energy cost for 15
the formation of these species. The same applies for the nano-second pulsed plasma (NSPP) [64]-[65]
16
which also has a rather low energy efficiency. The process capability of the micro hollow cathode 17
discharge (MHCD) [68]-[69] is very limited due to its very small volume. Therefore, it generally also 18
exhibits a relatively low energy efficiency. The spark discharge [70] has a very high conversion, 19
because of the very high energy consumption. The energy efficiency is also quite high, but it is lower 20
than the thermal conversion process. This may be attributed to the fact that most of the energy is 21
spent on the gas heating and the energy exchange with the surroundings. In general, we can 22
conclude that the energy efficiency in our GA reactor at atmospheric pressure is better than the DBD 23
plasma, microwave plasma, nano-second pulsed plasma and micro hollow cathode discharge plasma, 24
and comparable to the corona discharge [66]-[67].
25
Finally, we also benchmark our results for the GA based CO2 conversion to the pure thermal 26
conversion process (see the calculation method for the latter in the supporting information). It is 27
clear that the CO2 conversion in our GA proceeds more energy efficient than pure thermal 28
conversion. This is because the energy in the thermal conversion is distributed over all degrees of 29
freedom based on the equipartition principle of energy, and thus it is especially spent on gas heating 30
rather than on CO2 dissociation reactions. In contrast, our GA clearly operates in non-equilibrium 31
conditions, as the electrons have a much higher temperature than the gas itself (see our calculation 32
results in section 4.3 below). These highly energetic electrons induce different chemical reactions, 33
which normally do not occur at the considered gas temperate in case of equilibrium conditions.
34
In spite of the reasonable results obtained already by the gliding arc, the conversion should still 35
be further improved, while maintaining the high energy efficiency. More specifically, if this low 36
conversion could not be further improved, it would imply the need for operating in a recycle mode, 37
which would make the system highly non-effective.
38
4.3 Typical GA discharge characteristics 39
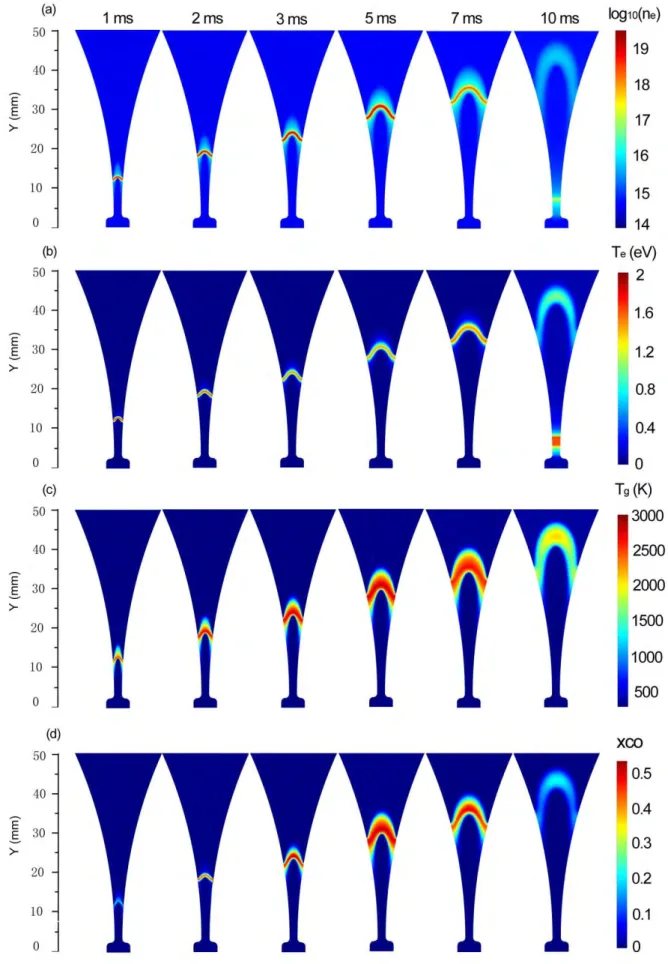
In order to understand the time behavior of the plasma characteristics in the CO2 GA, we plot in 40
figure 4 the electron number density, electron temperature, gas temperature, as well as of the CO 41
molar fraction distribution, at different moments in time, for a gas flow rate of 2.5 L/min and a 42
discharge power of 40 W.
43
11
1 Figure 4 Time evolution of the electron number density (in m-3), electron temperature, gas 2
temperature and CO molar fraction distribution, at a gas flow rate of 2.5 L/min and a discharge 3
power of 40 W.
4
12
The results are plotted starting from t = 1 ms. At t = 0 ms, the source voltage is larger than the 1
critical breakdown voltage with a shortest gap separation of 2 mm. The discharge ignition takes place, 2
because of a positive value of the net electron generation, yielding an abrupt increase of the electron 3
number density during the electrical breakdown. Once the conducting channel is established, the arc 4
travels along the electrodes as a result of the gas flow drag. Since the gas velocity has a maximum 5
value at the discharge axis and gradually decreases to zero at the electrode surface, the arc root 6
moves at a much slower velocity compared to the arc body. Thus, the arc gradually begins to bend 7
due to the gas blast. The maximum electron number density also increases due to the rising voltage 8
and hence discharge current (see figure S1 in the supporting information), till a peak value is reached 9
at 3.5 ms (see figure 4(a)). At later times, the discharge current drop, and consequently, the electron 10
density follows the same trend till zero at t = 8.5 ms, when the applied voltage reaches zero (see 11
figure S1). The GA gradually extinguishes and enters a relaxation stage, where the voltage is small 12
and not enough to sustain the GA discharge. Thus, there is a decaying residual low density plasma 13
moving downstream with the gas flow (see figure 4(a)). Shortly after t = 8.5 ms, the applied voltage 14
of the alternating current (AC) power source changes its polarity (see figure S1 of the supporting 15
information) and reaches again the critical breakdown voltage at the narrowest electrode gap 16
separation of 2 mm, where a restrike occurs by establishing a new conducting channel. It should be 17
noted that the re-ignition of the GA does not exactly take place at the shortest gap separation (Y = 18
2.5 mm), but at Y = 7.5 mm. This is because the local electric field at Y = 7.5 mm first reaches the 19
critical breakdown field. This is in good agreement with our experiments, recorded by the digital 20
camera (see figure S2 of the supporting information).
21
The rise and drop in electron number density during one GA discharge cycle results in an 22
enhanced and reduced Joule heating effect before and after t = 3.5 ms, respectively. The Joule 23
heating refers to the process by which the passage of an electric current through a conductive 24
medium produces heat and causes heating of the electrons. Correspondingly, the electron 25
temperature first increases and then decreases (see figure 4(b)). After t = 8.5 ms, the electron 26
temperature of the residual GA channel continuously decreases, because the electron number 27
density and the electric energy stored in the channel decay very rapidly. Subsequently, the extremely 28
large reverse polarity voltage imposed across the electrodes at the shortest electrode gap leads again 29
to an increase of the electron temperature and hence a subsequent breakdown at the new position 30
of Y = 7.5 mm (see figure 4(b)).
31
Once the discharge is ignited, the electrons cause vibrational excitation of CO2,and the energy 32
stored in the vibrationally excited states will partially be transferred to the gas by vibrational- 33
translational (V-T) relaxation. Indeed, at atmospheric pressure, the typical characteristic time for V-T 34
relaxation in CO2 is very short (around 10-5 s). As a result, the gas temperature also rises as a function 35
of time, reaching a maximum value of about 2700 K at around t = 3.5 ms, when the applied source 36
voltage (Vsource = 7200sin(2π50t + 0.50)) and the discharge current reach their maximum (see figure 37
4(c)). Subsequently, the gas temperature in the arc channel gradually decreases to around 2000 K 38
when a new cycle starts at t = 10 ms, because the discharge power decays rapidly in the relaxation 39
stage from 8.5 ms to 10 ms.
40
The CO molar fraction is obviously equal to zero before the arc is formed, but it starts increasing 41
gradually as a function of time, when the voltage and hence the discharge current in the arc rise, up 42
to a value of 0.55 at t = 3.5 ms, indicating that CO2 is gradually converted into CO. At later times, the 43
13
discharge current and hence the discharge power start to drop, so the CO molar fraction within the 1
arc channel gradually decreases until the arc is extinguished. This is caused by recombination of CO 2
and O into CO2. Furthermore, new CO2 gas will continuously be transported into the arc channel by 3
both diffusion and convection, while the dissociation products will leave the discharge channel by the 4
same transport mechanisms. This leads to a reduction of the maximum local CO molar fraction, as is 5
clearly indicated in figure 4 (d). Note that the overall CO2 conversion is much lower than the local 6
conversion of 80%, which corresponds to the maximum CO molar fraction of 0.55 (and CO2 molar 7
fraction of 0.2; see below). This is because the overall CO2 conversion is calculated for the entire gas 8
passing through the reactor, integrated over the time of one GA cycle (i.e., 10 ms), and thus not only 9
for the fraction of gas passing through the active arc channel at a certain moment in time.
10
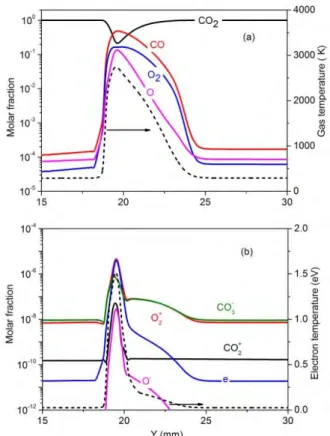
11 Figure 5 1D distribution of the molar fractions of the neutral species (a) and the charged species (b) 12
as a function of axial distance on the symmetry plane, at a time instant of 2.5 ms. The gas 13
temperature and electron temperature are also plotted in dashed lines in (a) and (b), respectively.
14
The molar fractions of the major neutral and charged species occurring in the CO2 GA are plotted 15
as a function of Y position in figure 5, at a time instant of 2.5 ms, and at the same conditions as in 16
figure 4. It is clear that CO2 is the major component in the plasma, except at the centre of the arc, 17
where the molar fraction of CO2 (around 0.2) is lower than the fraction of CO (around 0.5), and 18
comparable to the molar fractions of O2 (0.16) and O(0.14). This indicates that the majority of CO2 is 19
split here into CO and O2 as well as O atoms. Moreover, part of the O atoms have recombined into O2
20
molecules, indicating a higher decay rate of the O molar fraction than that of O2. The molar fractions 21
of CO, O and O2 drop quickly when moving towards the outer part of the arc, indicating that most of 22
the CO2 splitting takes place in the centre of the arc.
23
The CO2 conversion can be further enhanced when applying a higher power, however, even at 24
100 W, the local molar fraction of CO2 drops to extremely low values and the local conversion in the 25
14
GA reaches almost 100 %. This limits the further improvement of GA based CO2 conversion.
1
Therefore, the conversion can only be further enhanced if we can provide more CO2 into the arc 2
centre, while at the same time remove the dissociation products (CO and O2) out of the arc centre.
3
This will be further discussed in detail in section 4.5.
4
The molar fractions of the various charged species are at maximum 10-5, even in the arc centre, 5
and they clearly drop upon larger distance from the centre of the arc. Also the electron molar fraction 6
is at maximum 10-5, indicating that the CO2 plasma is only weakly ionized, even in the centre of the 7
arc. The major positive ions are the ions, while the ions are the major negative ions, and 8
they are even more important (although still with very low molar fractions) than the electrons, except 9
in the centre of the arc. These trends are in agreement with our previous findings obtained by a 1D 10
cylindrical discharge model, despite the considerable number of approximations adopted there *43+.
11
The gas temperature and electron temperature are also plotted in figure 5. They both reach their 12
maximum in the centre of the arc, as is logical, and they drop significantly as a function of position 13
from the arc centre. The electron temperature reaches a maximum of 1.5 eV (or 17,400 K) in the 14
centre of the arc at the time instant of 2.5 ms, but it drops significantly as a function of rising distance 15
from the arc centre in the first 0.5 mm, followed by a slower decay to thermal values at a distance of 16
about 1.0 mm from the centre. The gas temperature is at maximum about 2700 K in the centre of the 17
arc. From the comparison between these temperatures, it is clear that the gliding arc is far from 18
thermal equilibrium, as the electron temperature is about 6 times higher than the gas temperature.
19
As mentioned in section 4.1 above, a gas temperature up to around 2700 K and an electron 20
temperature up to 1.5 eV correspond well to experimental data found in literature for low current 21
atmospheric pressure GA discharges, although it should be mentioned that it is not easy to compare 22
different GA setups with different reactor geometries and discharge conditions.
23
4.4 CO2 conversion mechanisms in the GA 24
In order to evaluate which mechanisms are the most important for the CO2 splitting in the GA 25
plasma, and how they can eventually be further improved, we investigated the dominant reaction 26
pathways for the formation and loss of CO2 for the same conditions as in figure 4. The reactions are 27
listed in table 3 and their relative contributions to the overall CO2 loss and formation are presented in 28
figure 6. This kinetic analysis was performed by looking at the time and volume integrated rates of 29
the various processes for a complete gliding cycle of 10 ms. In the supporting information, we also 30
plot the temporal evolution of the most important loss and formation rates of CO2, obtained by 31
integrating the reaction rates over the entire reactor (see figure S4).
32
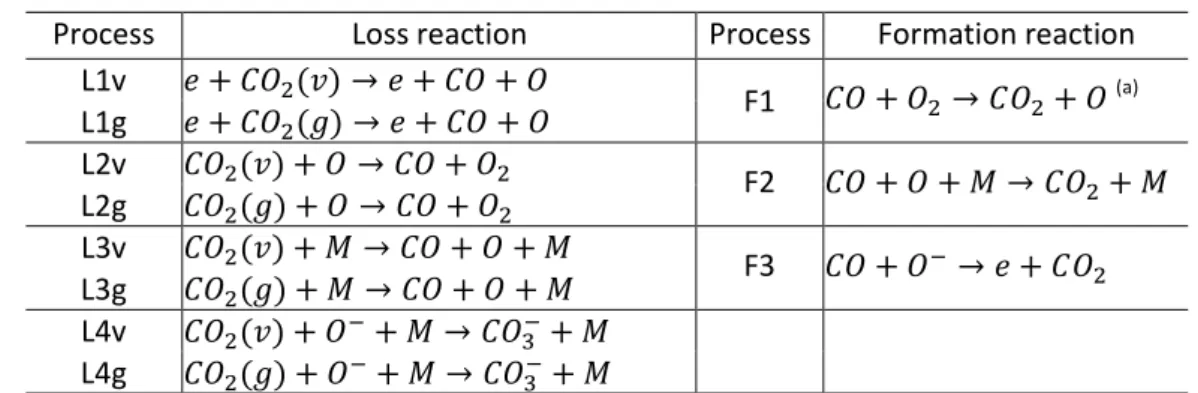
Table 3 Dominant CO2 loss and formation reactions.
33
Process Loss reaction Process Formation reaction
L1v 𝑒 + (𝑣) → 𝑒 + +
F1 + → + (a) L1g 𝑒 + (𝑔) → 𝑒 + +
L2v (𝑣) + → +
F2 + + 𝑀 → + 𝑀 L2g (𝑔) + → +
L3v (𝑣) + 𝑀 → + + 𝑀 F3 + → 𝑒 + L3g (𝑔) + 𝑀 → + + 𝑀
L4v (𝑣) + + 𝑀 → + 𝑀 L4g (𝑔) + + 𝑀 → + 𝑀
(a) O2 represents the sum of the ground state and the vibrational states of molecular oxygen.
34
15
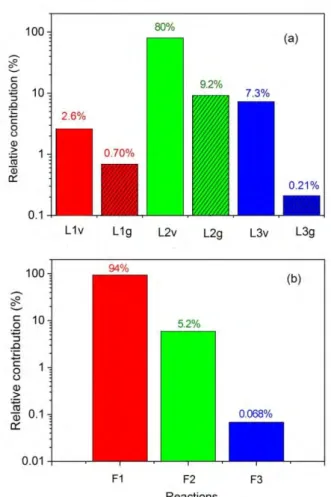
1 Figure 6 Relative contributions of the most important processes for CO2 loss (a) and formation (b).
2
The reaction numbers in the x-axis correspond to the numbers in table 3. Note that only the three 3
main loss processes are illustrated, as the fourth process (L4v, L4g) contributes for less than 0.1 %.
4
The most important process for CO2 loss is the dissociation of vibrationally excited states of CO2
5
upon collision with O atoms (L2v) with a relative contribution of about 80 %. The same process, but 6
upon collision of ground state CO2 with O atoms (L2g) has a relative contribution of 9.2 %.
7
Furthermore, the dissociation of vibrationally excited states of CO2 upon collision with any neutral 8
species (M) also contributes for 7.3 % (L3v). The relative contribution of the same process, but 9
starting from ground state CO2, is only 0.21 % (L3g). Besides, electron impact dissociation from the 10
CO2 vibrational levels (L1v) and from the CO2 ground state (L1g) contribute for 2.6 % and 0.70 %, 11
respectively. Compared with the electron impact dissociation reactions, the neutral reactions upon 12
collision with O atoms have a lower energy requirement *21+ and hence are more energy efficient.
13
Note that reactions L2v and L2g are actually follow-up reactions of reactions L1v and L1g, as the O 14
atom that reacts in reactions L2v and L2g is the result of CO2 splitting, either by reactions L1v and L1g, 15
or reactions L3v and L3g. Nevertheless, once the first O atoms are formed upon CO2 splitting, the 16
reactions L2v and L2g can occur in parallel to these other reactions, and thus we can consider them 17
separately in this analysis.
18
Our calculation results reveal that the CO2 dissociation mainly proceeds from the vibrationally 19
excited levels of CO2. The latter provide more energy efficient dissociation, because the vibrational 20
energy can help overcome the activation energy barrier of the reaction and thus increase the 21
reaction rate constant [28]-[29]. This is consistent with experimental investigations in literature.
22
Indeed, experimental work for both a diverging electrodes gliding arc reactor [7] and a gliding arc 23
16
plasmatron [8] shows that the presence of a very small quantity of water added into CO2 greatly 1
reduces the power efficiency compared with pure CO2 at atmospheric pressure. This is explained by 2
the fact that water can significantly reduce the vibrational excitation of CO2 molecules, because the 3
energy is absorbed and quickly lost by water. Based on this, Nunnally et al. [8] concluded that non- 4
equilibrium vibrational excitation plays the major role during CO2 dissociation in a gliding arc.
5
Additionally, there exist measurements in the literature, demonstrating that the vibrational 6
temperature in the gliding arc is higher than the gas temperature, even at atmospheric pressure, 7
although we cannot validate our model by direct comparison, as experimental data for the 8
vibrational temperature in pure CO2 in classical gliding arc reactors do not yet exist. However, in a 9
non-equilibrium gliding arc "tornado" discharge using CO2 doped with 1% N2 at a flow rate of 10 lpm 10
and a power of 200 W, Nunnally et al. [51] estimated the vibrational temperature to be 11
approximately 6000 K at atmospheric pressure, by comparing the theoretical and experimentally 12
measured spectra for the N2 system, and this value is much higher than the reported rotational gas 13
temperature of 2700K ± 50K. Therefore, these experimental results support our modelling results.
14
Some of the reactions plotted in figure 6(a) also occur in the opposite direction, hence, besides 15
dissociation of CO2, the recombination of CO with O2, O and ions also takes placein the GA, giving 16
rise to the formation of CO2 again and yielding a lower net conversion of CO2. The recombination 17
reaction of CO with O2 molecules (F1, i.e., the opposite of L2) is the predominant production process 18
of CO2, with a relative contribution to the overall CO2 formation amounting to 94 %. The 19
recombination reaction of CO with O atoms (F2, i.e., the opposite of L3) has a relative contribution of 20
5.2 %, while the recombination of CO with ions (F3) only contributes for 0.068 %. Other reactions 21
play a negligible role towards CO2 formation (< 0.05 %).
22
Note that the reverse reactions, especially the recombination of CO with O2 molecules, have 23
only slightly lower rates than the rates of the most important loss processes, as depicted in figure S4 24
in the supporting information. Therefore, these reactions have a detrimental effect on the overall 25
CO2 conversion. Indeed, when the rates of these reactions would become even larger, they would 26
inhibit further CO2 dissociation. This happens when a considerable fraction of the CO2 molecules is 27
already converted into CO and O/O2, and especially at high gas temperature in the arc. When 28
comparing the total loss of CO2, integrated over the entire arc and the whole gliding cycle, with the 29
total formation of CO2, we obtain values of 3.8 x 10¹⁸ vs 3.5 x 10¹⁸ at the conditions under study. Thus, 30
it is clear that about 92 % of the CO2 converted in the GA, will be formed again, so the net conversion 31
of CO2 into CO is much smaller than the initial loss of CO2. Therefore, the recombination of CO with 32
O2 back into CO2 is clearly a limiting factor, which affects the further improvement of GA based CO2
33
conversion and its energy efficiency. This will be discussed in the next section.
34
4.5 How to improve the CO2 conversion and energy efficiency in the GA ? 35
From previous section, we can clearly identify the limiting factors for energy efficient CO2
36
conversion in the GA. Therefore, in this section, we will propose solutions on how to further improve 37
the performance of the GA for energy efficient CO2 conversion. First we will discuss the role of the 38
vibrational levels in energy efficient CO2 conversion. Subsequently, we will look in more detail at the 39
recombination of CO with O2, which contributes mostly to the CO2 formation at the conditions under 40
study. Finally, we will elaborate on some ways to increasing the velocity difference between the GA 41
and the gas flow, which can increase the fraction of CO2 that can be processed by the arc, and hence 42
improve the conversion.
43
17
4.5.1 Promoting the vibrational kinetics 1
It is clear that non-equilibrium vibrational excitation of CO2 promotes energy efficient 2
dissociation in the GA. This is also consistent with experimental investigations in literature [8]. Our 3
results indicate that the population of the symmetric mode levels and the lower asymmetric stretch 4
mode levels is much higher than that of the higher asymmetric mode levels. Therefore, these lower 5
vibrationally excited levels mostly account for the total CO2 conversion, although there is still some 6
overpopulation for the higher levels. The reason why especially the lower vibrational levels 7
contribute to the CO2 conversion is because the vibrational energy distribution function tends to 8
become more thermalized at high gas temperature [75]. Indeed, the energy exchange upon collision 9
between vibrational levels and ground state molecules, which depopulates the vibrational levels, i.e., 10
so-called VT relaxation, increases with gas temperature. Therefore, we should look for ways of 11
inhibiting the VT relaxation process to increase the degree of overpopulation of the higher 12
asymmetric mode levels.
13
A recent kinetic modelling of microwave plasma based CO2 conversion has shown that lower 14
pressures, lower gas temperature and higher power densities (at least for pressures below 300 mbar) 15
lead to more vibrational excitation, which is beneficial for the conversion [75]. However, our GA 16
operates at atmospheric pressure, which is more convenient for industrial applications, so the 17
solutions of reducing the gas pressure and increasing the power density (which only has beneficial 18
effect at a pressure below 300 mbar [75]) are not practical. Therefore, we believe that the gas 19
temperature should be reduced, to inhibit the VT relaxation, and thus to promote the role of the 20
higher vibrational levels, and hence the conversion and energy efficiency. In this respect, enhancing 21
the mixing between the GA and the cold gas can help to realize this goal, which was clearly indicated 22
by our previous modelling for a 1D gliding arc [43] and by experimental work [8]. Furthermore, 23
reducing the gas temperature will also result in a lowering of the recombination reactions, thus also 24
improving the overall CO2 conversion (see next section). On the other hand, it will also lead to a drop 25
in the dissociation rate constants by neutral particle collisions, and this has a detrimental effect on 26
the conversion. Therefore, an optimized gas temperature should exist for GA based CO2 conversion, 27
where the beneficial effect of a lower temperature, due to (i) a more pronounced non-equilibrium 28
population of the highly excited vibrational levels, and (ii) lower recombination rates of CO back into 29
CO2, exceeds the detrimental effect by the lower dissociation rate constants of dissociation upon 30
collision with neutral particles. Finding out this optimal temperature is, however, not so 31
straightforward with our 2D model, as the latter self-consistently calculates the gas temperature and 32
it is not an input in the model. For this purpose, a 0D model, where the gas temperature can be 33
introduced as an input parameter, could be more suitable [42].
34
Besides, because electron impact vibrational excitation of CO2 is mainly important for reduced 35
electric field values (i.e., ratio of electric field over gas density) below 80 Td [74] (where 1 Td = 10-21 36
V/m2), we should target to actively tune the reduced electric field to these values, by optimizing the 37
reactor electrical operating parameters. Finally, increasing the electron number density will also 38
promote the vibrational excitation and thus selectively deliver energy to this most energy efficient 39
CO2 dissociation pathway. It has been reported in literature [68] that adding noble gases, such as 40
argon, to CO2 would improve the CO2 conversion and energy efficiency by increasing the electron 41
number density, because argon has a lower breakdown voltage than CO2. 42
4.5.2 Reducing the recombination of CO with O2
43
18
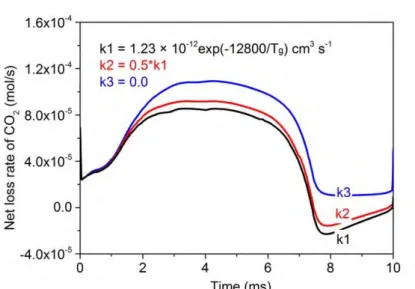
1 Figure 7 Effect of different rate coefficients of the recombination reaction (CO + O2 → CO2 + O) on the 2
calculated net loss rate of CO2, integrated over the entire reactor volume, at the same conditions as in 3
figure 4.
4
It is clear from section 4.4 that the recombination reaction (F1), i.e., CO + O2 → CO2 + O, is 5
mainly limiting the CO2 conversion and energy efficiency. In our model, we adopted the rate 6
coefficient as proposed by Fridman *21+. However, to evaluate the effect of this recombination 7
reaction on the overall CO2 conversion, we have performed some further simulations in which (i) we 8
reduced the rate coefficient of this reaction by 50%, and (ii) we completely removed this 9
recombination reaction from the model, as indicated in the legend of figure 7.
10
It is obvious from figure 7 that a lower rate coefficient of the recombination reaction yields a 11
higher net CO2 loss rate. The CO concentration within the GA channel, and hence the influence of the 12
recombination reaction on the CO2 formation, is minor till t= 1.7 ms. As a result, the different rate 13
coefficients have a negligible effect on the net loss rate of CO2 up to 1.7 ms. Upon increasing CO 14
concentration, the different rate coefficients do cause some deviation in the calculated net loss rates 15
of CO2. After t = 7.5 ms, the formation rate of CO2 is even larger than the loss rate for k1 and k2, 16
leading to a negative value of the net CO2 splitting rate. Of course, integrated over the entire GA 17
cycle, the overall CO2 loss (or conversion) rate is still positive, but it is greatly reduced due to this 18
important backward (recombination) reaction.
19
19
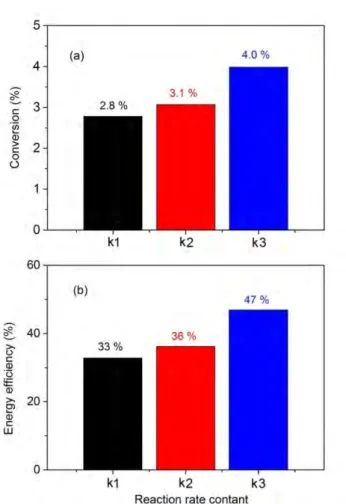
1 Figure 8 Effect of using different rate coefficients of the recombination reaction (CO + O2 → CO2 + O) 2
on the calculated CO2 conversion (a) and energy efficiency (b), for the same conditions as in figure 7.
3
See legend of figure 7 for the values of k1, k2 and k3.
4
Figure 8 shows the conversion and energy efficiency, calculated with the original rate coefficient 5
(k1) *21+, in comparison with the results obtained when this rate coefficient is divided by 2 (k2), as 6
well as when the recombination reaction is removed from the model (k3). The conversion and energy 7
efficiency increase only slightly when the recombination rate coefficient is divided by 2, while they 8
rise from 2.8 % to 4.0 %, and from 33 % to 47 %, respectively, by removing the recombination 9
reaction (CO + O2 → CO2 + O) from the model. Although the conversion is still low, the energy 10
efficiency rises significantly. This clearly indicates that reducing the recombination of CO with O2 is 11
quite promising to enhance the CO2 conversion and (especially) the energy efficiency.
12
To achieve this objective, we suggest to apply possible scavengers, catalysts or separation 13
membranes, in order to remove the O2 molecules *33+. These are only suggestions, and they should 14
of course be experimentally explored to evaluate the possibilities. On the other hand, the 15
combination of a solid oxide electrolyser cell with a plasma set-up was already illustrated in *76+ to be 16
beneficial for the CO2 conversion, and it works according to the same principle. In this way, the local 17
concentration of O2 molecules within the arc channel, and hence the net formation of CO2 by the 18
recombination reaction (CO + O2 → CO2 + O), could be reduced, because there is not enough reactant 19
(O2) available for the backward reaction from CO into CO2 (F1).
20
H2 or CH4 could act as possible scavengers for atomic oxygen, forming H2O. This possibility was 21
already illustrated to be beneficial for O trapping in literature, based on a combined plasma chemical 22