Integrated Landscape Management in Dry Miombo Woodlands of Tanzania
Part I: Project Information Name of Parent Program
Sustainable Forest Management Impact Program on Dryland Sustainable Landscapes GEF ID
10250 Project Type FSP
Type of Trust Fund GET
CBIT/NGI CBIT NGI Project Title
Integrated Landscape Management in Dry Miombo Woodlands of Tanzania Countries
Tanzania
Agency(ies) FAO
Other Executing Partner(s):
The Tanzania Forest Services Agency Executing Partner Type
Government GEF Focal Area Multi Focal Area Taxonomy
Focal Areas, Influencing models, Stakeholders, Gender Equality, Capacity, Knowledge and Research, Land Degradation, Land Degradation Neutrality, Carbon stocks above or below ground, Land Productivity, Land Cover and Land cover change, Sustainable Land Management, Sustainable Forest, Restoration and Rehabilitation of Degraded Lands, Community- Based Natural Resource Management, Sustainable Livelihoods, Sustainable Agriculture, Improved Soil and Water Management Techniques, Income Generating Activities, Ecosystem Approach, Integrated and Cross-sectoral approach, Sustainable Fire Management, Biodiversity, Mainstreaming, Agriculture and agrobiodiversity, Biomes, Grasslands, Tropical Dry Forests, Species, Plant Genetic Resources, Protected Areas and Landscapes, Terrestrial Protected Areas, Productive Landscapes, Community Based Natural Resource Mngt, Forest, Drylands, Climate Change, Climate Change Mitigation, Technology Transfer, Financing, Agriculture, Forestry, and Other Land Use
Rio Markers
Climate Change Mitigation Climate Change Mitigation 1 Climate Change Adaptation Climate Change Adaptation 0
Submission Date 6/18/2019
Expected Implementation Start 5/1/2021
Expected Completion Date 4/30/2026
Duration 60In Months Agency Fee($) 663,192.50
A. FOCAL/NON-FOCAL AREA ELEMENTS
Objectives/Programs Focal Area Outcomes Trust Fund GEF Amount($) Co-Fin Amount($)
IP SFM Drylands Dryland Landscapes Sustainably managed GET 7,368,807.00 36,057,124.00
Total Project Cost($) 7,368,807.00 36,057,124.00
B. Project description summary
Project Objective
To halt and reverse negative trends of land degradation and biodiversity loss in degraded areas of the Miombo woodlands in the south-west of Tanzania by applying an integrated landscape management approach.
Project
Component Financin
g Type Expected
Outcomes Expected Outputs Trust
Fund GEF Project Financing($) Confirmed Co-Financing($)
Project Component
Financin g Type
Expected Outcomes
Expected Outputs Trust Fund
GEF Project Financing($) Confirmed Co-Financing($)
Component 1:
Strengthening the enabling environment for the sustainable management of the targeted dry Miombo woodlands
Technical
Assistance Outcome 1.1:
Strengthened LDN cross- sectoral decision support system and framework for the
management of the targeted drylands Indicators:
(1) LDN cross- sectoral groups, committees, and other structures engaged in LD assessment, planning and monitoring at national and landscape level (2) # and type of strategies and plans in support of LDN jointly reviewed, amended, developed and approved
Output 1.1.1: Cross-sectoral LDN national working group and Miombo landscape level technical working group operational, strengthened and capacitated in the application of tools and approaches.
Output.1.1.2: Value of Miombo woodland’s ecosystem services assessed across the two targeted sub- landscapes and fed into a policy/decision-making.
Output.1.1.3: Strategies, plans and other sectoral frameworks reviewed and by-laws clarified and implemented
GET 480,002.00 5,213,159.00
Project Component
Financin g Type
Expected Outcomes
Expected Outputs Trust Fund
GEF Project Financing($) Confirmed Co-Financing($)
Component 2.
Demonstrating, implementing and scaling out SLM and SFM best practices at landscape level
Investment Outcome 2.1:
LDN objectives mainstreamed into sectoral local gender sensitive development plans Indicator:
(1) # of sectoral local gender sensitive VLUP incorporating SLM and SFM good practices in place and under implementation (2) # of forest management plans
incorporating SLM and SFM good practices updated
Outcome 2.2.
Wide uptake and application of SLM/SFM practices in target landscapes following priorities actions of the VLUPs and FMP
Indicators:
(1) # of direct beneficiaries of SLM/SFM project interventions disaggregated by gender
(contributing to GEF Core Indicator 11) (2) # ha of cropland under sustainable agriculture intensification &
diversification, following SLM best practice (contributing to GEF Core Indicator 4.3) (3) # ha of grasslands undergoing restoration (active and passive) management, (contributing to GEF Core Indicator 3.3) (4) # ha of forest land under improved forest management (5) # ha of forest land undergoing restoration (active and passive) management, (contributing to GEF Core Indicator 3.2) (6) # ha of avoided deforestation
Outcome 2.3.
Key green value chains and associated finance and business development strengthened or established Indicator:
(1) # of people (disaggregated by gender)
participating in and benefiting economically from sustainable value chains [Corresponding to GEF core indicator 11:
number of direct beneficiaries as co-beneficiaries of GEF
investment; and SDG 2.4.1 sub- indicators 1.
(farm output value) and 2. (net farm income)]
(2) # of business plans for targeted value chains for project-supported SLM/SFM products developed and approved
Output 2.1.1: joint Village land use plans (forest, rangeland and cropland areas) updated, reviewed, developed and implemented in a participatory manner, supporting security of land tenure and access rights.
Output 2.1.2: Integrated landscape management mainstreamed into Forest management plans (including fire management).
patory manner, supporting security of land tenure and access rights.
Output 2.1.2: Integrated landscape management mainstreamed into Forest management plans (including fire management).
Output 2.2.1 Evidence based good, sectoral, local and gender sensitive SLM and SFM practices identified, compiled, implemented and disseminated Output 2.2.2: Community seed banks and tree seed and seedlings production center established/or strengthened and capacitated
Output 2.3.1: Improved efficiency for transition towards alternative energy sources and consumption (Note: the number of energy end use
appliances/technologies will be jointly defined at project start) Output 2.3.2: Improved development of Miombo woodlands value chains (“basket product approach”) Output 2.3.3: Business plans developed, financed, business development mechanisms established and implemented
GET 5,253,158.00 27,792,807.00
Project Component
Financin g Type
Expected Outcomes
Expected Outputs Trust Fund
GEF Project Financing($) Confirmed Co-Financing($)
Component 3.
Strengthening knowledge, learning and collaboration to support progress towards achieving national LDN targets
Technical
Assistance Outcome 3.1.
LDN-related policy, planning, management and decision-making at national and global levels informed.
Indicators:
LDN monitoring and reporting system operational Outcome 3.2:
Knowledge and awareness to support progress towards achieving national LDN targets enhanced Indicators:
(1) Number of knowledge and information products developed, disseminated and accessed through relevant
knowledge sharing platforms (e.g. GCP);
(2) Number of briefs presenting lessons learned shared and accessed by stakeholders
Outcome 3.3.
National and sub- national measures to deliver LDN enhanced through improved regional and global opportunities for collaboration, exchange and learning lessons Indicators:
(1) Number of country participation in regional and/or global knowledge sharing events
Output 3.1.1. National and sub-national LDN assessment, monitoring and reporting systems and tools developed and operational, with relevant reporting to global level.
Output 3.2.1. Project knowledge management, communication and
dissemination framework and strategy developed and implemented.
Output 3.2.2 Project M&E framework, supporting lesson learning and adaptive management, developed and operational.
Output 3.3.1. Actions, collaboration and investments identified to address common land and environmental degradation priorities in Miombo-Mopane ecoregion and bi-/multi-lateral initiatives established to progress towards LDN.
Output 3.3.2. Collaborative actions to support business and develop markets for SLM/SFM products across the Miombo- Mopane region undertaken.
Output 3.3.3. Opportunities for national and landscape- level stakeholders exchange knowledge and lessons learnt at regional and global levels identified, developed and supported.
GET 1,284,752.00 2,651,158.00
Project Component
Financin g Type
Expected Outcomes
Expected Outputs Trust Fund
GEF Project Financing($) Confirmed Co-Financing($)
Sub Total ($) 7,017,912.00 35,657,124.00
Project Management Cost (PMC)
GET 350,895.00 400,000.00
Sub Total($) 350,895.00 400,000.00
Total Project Cost($) 7,368,807.00 36,057,124.00
C. Sources of Co-financing for the Project by name and by type
Sources of Co-financing Name of Co-financier Type of Co-financing Investment Mobilized Amount($)
Recipient Country Government Ministry of Agriculture In-kind Recurrent expenditures 521,062.00
Recipient Country Government Vice President Office In-kind Recurrent expenditures 306,317.00
Recipient Country Government Ministry of Water In-kind Recurrent expenditures 1,000,000.00
GEF Agency FAO Grant Recurrent expenditures 918,000.00
Recipient Country Government Kaliua district council In-kind Recurrent expenditures 2,772,500.00
Recipient Country Government Mlele district council In-kind Recurrent expenditures 2,800,000.00
Recipient Country Government Tanzania Forest Services In-kind Recurrent expenditures 27,739,245.00
Total Co-Financing($) 36,057,124.00 Describe how any "Investment Mobilized" was identified
As explained in the section “Main changes from concept at PFD stage”, the co-financing figures are reduced from USD 48.5 million at PFD stage, to 36 million at CEO Endorsement Request. Part of the envisaged co-financing, in particular the investment mobilized, could unfortunately not be confirmed during PPG stage. Additional co-financing, including investment mobilized, will be sought during implementation and reported on.
D. Trust Fund Resources Requested by Agency(ies), Country(ies), Focal Area and the Programming of Funds
Agency Trust Fund Country Focal Area Programming of Funds Amount($) Fee($)
FAO GET Tanzania Land Degradation LD STAR Allocation 4,019,349 361,741.4
FAO GET Tanzania Biodiversity BD STAR Allocation 893,189 80,386.9
FAO GET Tanzania Multi Focal Area IP SFM Drylands Set-Aside 2,456,269 221,064.2
Total Grant Resources($) 7,368,807.00 663,192.50
E. Non Grant Instrument
NON-GRANT INSTRUMENT at CEO Endorsement
Includes Non grant instruments? No Includes reflow to GEF? No
F. Project Preparation Grant (PPG) PPG Required
PPG Amount ($) 200,000
PPG Agency Fee ($) 18,000
Agency Trust Fund Country Focal Area Programming of Funds Amount($) Fee($)
FAO GET Tanzania Land Degradation LD STAR Allocation 109,091 9,818
FAO GET Tanzania Biodiversity BD STAR Allocation 24,242 2,182
FAO GET Tanzania Multi Focal Area IP SFM Drylands Set-Aside 66,667 6,000
Total Project Costs($) 200,000.00 18,000.00
Core Indicators
Indicator 3 Area of land restored
Ha (Expected at PIF) Ha (Expected at CEO Endorsement) Ha (Achieved at MTR) Ha (Achieved at TE)
0.00 34885.00 0.00 0.00
Indicator 3.1 Area of degraded agricultural land restored
Ha (Expected at PIF) Ha (Expected at CEO Endorsement) Ha (Achieved at MTR) Ha (Achieved at TE)
Indicator 3.2 Area of Forest and Forest Land restored
Ha (Expected at PIF) Ha (Expected at CEO Endorsement) Ha (Achieved at MTR) Ha (Achieved at TE) 34,885.00
Indicator 3.3 Area of natural grass and shrublands restored
Ha (Expected at PIF) Ha (Expected at CEO Endorsement) Ha (Achieved at MTR) Ha (Achieved at TE) Indicator 3.4 Area of wetlands (incl. estuaries, mangroves) restored
Ha (Expected at PIF) Ha (Expected at CEO Endorsement) Ha (Achieved at MTR) Ha (Achieved at TE)
Indicator 4 Area of landscapes under improved practices (hectares; excluding protected areas)
Ha (Expected at PIF) Ha (Expected at CEO Endorsement) Ha (Achieved at MTR) Ha (Achieved at TE)
0.00 761353.00 0.00 0.00
Indicator 4.1 Area of landscapes under improved management to benefit biodiversity (hectares, qualitative assessment, non-certified)
Ha (Expected at PIF) Ha (Expected at CEO Endorsement) Ha (Achieved at MTR) Ha (Achieved at TE) Indicator 4.2 Area of landscapes that meets national or international third party certification that incorporates biodiversity considerations (hectares)
Ha (Expected at PIF) Ha (Expected at CEO Endorsement) Ha (Achieved at MTR) Ha (Achieved at TE)
Type/Name of Third Party Certification
Indicator 4.3 Area of landscapes under sustainable land management in production systems
Ha (Expected at PIF) Ha (Expected at CEO Endorsement) Ha (Achieved at MTR) Ha (Achieved at TE) 761,353.00
Indicator 4.4 Area of High Conservation Value Forest (HCVF) loss avoided
Ha (Expected at PIF) Ha (Expected at CEO Endorsement) Ha (Achieved at MTR) Ha (Achieved at TE)
Documents (Please upload document(s) that justifies the HCVF)
Title Submitted
Indicator 6 Greenhouse Gas Emissions Mitigated
Total Target Benefit (At PIF) (At CEO Endorsement) (Achieved at MTR) (Achieved at TE)
Expected metric tons of CO₂e (direct) 0 1318948 0 0
Expected metric tons of CO₂e (indirect) 0 0 0 0
Indicator 6.1 Carbon Sequestered or Emissions Avoided in the AFOLU (Agriculture, Forestry and Other Land Use) sector
Total Target Benefit (At PIF) (At CEO Endorsement) (Achieved at MTR) (Achieved at TE)
Expected metric tons of CO₂e (direct) 1,318,948
Total Target Benefit (At PIF) (At CEO Endorsement) (Achieved at MTR) (Achieved at TE) Expected metric tons of CO₂e (indirect)
Anticipated start year of accounting 2021
Duration of accounting 20
Indicator 6.2 Emissions Avoided Outside AFOLU (Agriculture, Forestry and Other Land Use) Sector
Total Target Benefit (At PIF) (At CEO Endorsement) (Achieved at MTR) (Achieved at TE)
Expected metric tons of CO₂e (direct) Expected metric tons of CO₂e (indirect) Anticipated start year of accounting Duration of accounting
Indicator 6.3 Energy Saved (Use this sub-indicator in addition to the sub-indicator 6.2 if applicable)
Total Target Benefit Energy (MJ) (At PIF) Energy (MJ) (At CEO Endorsement) Energy (MJ) (Achieved at MTR) Energy (MJ) (Achieved at TE) Target Energy Saved (MJ)
Indicator 6.4 Increase in Installed Renewable Energy Capacity per Technology (Use this sub-indicator in addition to the sub-indicator 6.2 if applicable) Technology Capacity (MW) (Expected at
PIF) Capacity (MW) (Expected at CEO
Endorsement) Capacity (MW) (Achieved at
MTR) Capacity (MW) (Achieved at
TE)
Indicator 11 Number of direct beneficiaries disaggregated by gender as co-benefit of GEF investment
Number (Expected at PIF) Number (Expected at CEO Endorsement) Number (Achieved at MTR) Number (Achieved at TE)
Female 27,000
Male 33,000
Total 0 60000 0 0
Part II. Project Justification
1a. Project Description
a) The global environmental and/or adaptation problems, root causes and barriers that need to be addressed -
Summary of Context, Scope and the Core Problem
Global context
The Tanzania child project is part of the Dryland Sustainable Landscapes Impact Programme (DSL IP) that aims to avoid, reduce, and reverse further degradation, desertification, and deforestation in drylands through the sustainable management of productive landscapes. DSL IP focuses on three dryland ecoregions: (i) the Miombo and Mopane”, (ii) “the savannas of West Africa” and (iii) “the temperate grasslands, savannas and shrublands of Central Asia”). The programme gives specifically importance to the Miombo and Mopane ecoregion, which is targeted in seven child projects in Angola, Botswana, Malawi, Mozambique, Namibia, Tanzania and Zimbabwe.
The Miombo and Mopane woodlands are the most predominant type of vegetation in Southern Africa, covering 3 million square kilometers, stretching from Angola, Namibia, Botswana, Democratic Republic of the Congo, Zambia, Zimbabwe, Malawi, Mozambique and Tanzania. Together with the Amazonia, the Congo Basin, New Guinea and the North American deserts, the Miombo and Mopane woodlands are considered wilderness areas of global conservation significance as they concentrate the majority of plant and vertebrate species endemic to individual wilderness. These woodlands are the main ecosystems of the “Zambezian” region of Africa, distinct in terms of mammals, birds, amphibians, reptiles and plants, with high level of diversity and endemism. Malawi lies entirely within the Zambezian region, and its vegetation is
characterized by miombo and mopane woodlands, alongside various types of thicket and dry forest. Within Malawi, the Shire basin is home of the dry miombo woodlands at higher altitudes on the escarpments above 400 m, and mopane woodlands at lower altitudes. These woodlands are dominated by numerous tree species belonging to the Fabaceae (species from the genera Brachystegia, Julbernardia and Isoberlinia in the Miombo woodlands and Colophospermum mopane in the Mopane woodlands), which is considered the second most economically important plant family.
The Miombo and Mopane Ecoregion has an estimated diversity of 8,500 flowering plant species, of which ca. 54% are endemic. In the case of Malawi, flowering plant diversity reaches 6,000 species, alongside other groups such as ferns and mosses. More specifically, the Shire basin is at the cross road of three main regions of plant endemism: the Zambezian, Afromontane and Eastern Forest regions.
Ecosystem services from the Miombo and Mopane woodlands support the livelihoods of 100 M rural people and 50 M urban dwellers, and others beyond the region. A high diverse of provisioning services (e.g. NTFPs, including food, medicines, cosmetics, fuelwood and charcoal, building materials) contribute on average USD 9 billion/yr to rural livelihoods; 76% of energy used in the region is derived from woodlands; and traded wood-fuels have an annual value of USD 780 M. Woodlands support much of the region’s agriculture through transfers of nutrients to fields and shifting cultivation. Woodlands store 18–24 Pg carbon. Cultural services provided by woodlands include tourism and spiritual succour.
The miombo woodlands are under severe pressure resulting in serious negative effects for the millions of rural poor depending on them directly and indirectly. The main drivers are conversion to agriculture, timber extraction (domestic and commercial), fire (Bond et al., 2009) and land clearing for bio-fuels. An estimate of climate change-related risks under the 2 ºC warming scenario in globally significant biodiversity conservation areas highlights the Miombo & Mopane ecoregion as one of the most exposed to temperature changes, and a greater reduction in wet day frequency and seasonal precipitation. Under the 2 ºC scenario, approximately 25% of taxa presently found in priority places such as the Miombo & Mopane ecoregion are at risk of extirpation.
National Context for the sustainable use of Miombo ecosystems in Tanzania
Mainland Tanzania covers a total area of 945,087 km2, with 48.1 million ha of forests of which 93% is Central Zambezian Miombo Woodland[1]1. The country is endowed with rich biodiversity ranging from semi-arid to tropical forest, encompasses some of the most diverse landscapes in the world, which provide a wide range of services that are of vital importance to the livelihoods and economies of the country. The country hosts parts of six Global Biodiversity Hotspots[2]2, with more than one-third of the total plant species on the continent and about 20% of the large mammal population.
This project will focus in Miombo woodlands of South West Tanzania. Tanzania hosts both wet and dry Miombo woodlands. The Dry Miombo sees precipitation below 1000mm/year, and are located mainly throughout central Tanzania[3]3 and in the south-west of Tanzania.
Miombo woodlands are central to the livelihood systems of millions of rural and urban dwellers in Tanzania, both for domestic and some agro-industry activities. Goods and services provided by miombo woodlands to livelihoods of local communities are products such as medicines, energy, food, fibers, and construction and craft materials. The services include cultural and spiritual values, climate regulations, erosion and hydrological control[4]4. In particular, it supports the resilience of surrounding farmland and communities, especially under climate change. Moreover, the woodlands’ ecosystems bolster livelihoods, act as safety nets in times of emergency and serve as gap fillers in times of seasonal shortage.
The Miombo woodlands are biologically rich and diverse with up to 8,500 vascular plant species, 4,590 of them endemic, together with 35 endemic mammals, 51 endemic birds, 52 endemic reptiles, 25 endemic amphibians and an unknown number of endemic invertebrates[5]5. As many as 83 indigenous tree species, which bear edible fruits and nuts throughout the year, have been identified in the Tanzania Miombo[6]6. Dozens more Non-Timber Forest Products (NTFPs) edible species identified in Tanzania (e.g. insects, fruits, mushrooms, honey, medicinal plants and wild meat) directly contribute to resolving underlying causes of food insecurity, undernutrition and poverty. The woodlands also provide roaming “refuge” (livestock), in the dry months (June-November).
Anthropogenic and natural threats are causing significant biodiversity loss in Miombo woodlands, primarily associated with deforestation and land degradation as the most significant causes of biodiversity loss. Recent disturbances in the landscape have been causing notable losses is tree species richness and a reduction in biodiversity overall.
Despite protections in place for threatened timber species, amongst others, evidence suggests sub-optimal enforcement means they are still being harvested throughout the landscape (e.g. Pterocarpus angolensis)[7]7. Moreover, expanding agricultural land and human settlements are fragmenting natural habitats.
Miombo woodlands demonstrate a remarkable capacity to recover after disturbance, due to tree regeneration from the roots and stumps[8]8. That being said, proper management practices must be enforced following such disturbances to allow sufficient time for regeneration to occur and for woodlands to mature.
National trends in deforestation
In 2018, the National Carbon Monitoring Centre (NCMC) showed that the annual rate of forest loss has increased to 469,420 ha per year against 372,000 ha that had been recorded by the National Forest Resources Monitoring and Assessment (NAFORMA) in 2015. Deforestation and forest degradation are associated with their ineffective management (e.g. encroachment/population pressure, farm expansion, livestock grazing, low rates of reforestation compared to harvest rates, conversion to other land uses), unsustainable utilization of forest resources (e.g. overdependence on biomass energy - providing 92% of energy needs), weak governance, inadequate policy and inter-sectoral coordination, and biophysical causes in particular climate change.
Policy context
Tanzania’s institutional and policy framework for natural resources management is characterized by an elaborate and diverse set of policies, legal instruments, and institutional arrangements. The most relevant policies and legal instruments are included in the table below:
Table 1. Tanzania policies and legal instruments
Theme Main Legislation/Policy/Strategy
Environment National Environment Policy (1997); Environmental Impact Assessment and Audit Regulations, 2005; The Environmental Management (Air Quality Standards) Regulations, 2007
Climate Change National Climate Change Strategy (NCSS, 2012); Guidelines for Integrating Climate Change Adaptation into National Sectoral Policies, Plans and Programmes of Tanzania (2012); National Strategy on Gender and Climate Change (2013); Nationally Determined Contributions (2018);
Biodiversity, Wildlife & Natural Resources Wildlife Policy (2007); Wildlife Conservation Act (2009); National Beekeeping Policy (1998); National Biodiversity Strategy and Action Plan (2015)
Water National Water Policy (NAWAPO) (2002); Water Resources Management Act of 2009 (WRMA); National Water Sector Development Strategy (NWSDS) 2006
Forestry Forest Act No. 14 (2002); National Forest Policy (1998); National Strategy for Reduced Emissions from Deforestation and Forest Degradation - REDD+ (2013)
Energy National Energy Policy (2015)
Growth and Development Rural Development Policy (2001); Tanzania Development Vision 2025; National Strategy for Growth and Reduction of Poverty I & II;
Tanzania’s Second Five Year Development Plan 2016/17– 2020/21
Agriculture National Agricultural Policy (2013);; Seed Act and its regulation (2003 & 2014); (2010); National Irrigation Policy (2009); Agricultural Sector Development Strategy II (2015); Tanzania Agriculture and Food Security Investment Plan
Livestock National Livestock policy (2006), Grazing-land and Animal Feed Resources Act No. 13
Nutrition National Food and Nutrition Policy (1992)
Planning and Land Tenure Land Act No. 4 and Village Land Act No. 5 (1999); Land Use Planning Act No. 6 (2007); National Land Policy (1995) Decentralization Local Government (District Authorities) Act (1982); Local Government (Urban Authorities) Act (1982)
Socio-economic Gender Policy (2000)
Trade & Private Sector Development National Micro-Finance Policy (2000); National Trade Policy (2003); National Private Sector Development Policy (2018)
Project Intervention AreasThe project focuses on degraded areas of the dry Miombo woodlands in the south-west of Tanzania. Site selection was done considering the areas presented in the EoI and further refined to include locations where strong interaction between different land used was present. Land degradation status and changes in land use were also criteria used in the selection of the sites. Pre-selected areas were then discussed with Government counterparts and agreed upon. In order to define the area of intervention, a watershed approach (compatible with the landscape approach and enabling the contributions of the project to be impactful at a broader level), was used. The criteria for site selection was based on the distribution of the Miombo/Mopane ecosystem within drylands. It includes areas of strong interaction agriculture-forest-livestock. The landscape is composed of 9 sub-landscapes as shown in Figure 2. Specifically, the targeted landscape is covering the following four regions and eleven districts: Tabora Region (Kaliua, Urambo, Sikonge, Uyui District Councils), Katavi Region (Mlele, Tanganyika District Councils(, Sumbawanga District Councils) and Songwe Region (Mbozi, Momba, Songwe District Councils) – see section
1.b Project Map and Geo-Coordinates for more information. The project intervention area covers 144,146 km2 with approximately 3,827,912 ha of Miombo woodlands.
According to the Census of Population, 3,738,164 people reside in the targeted area, of which around 65% live below the poverty line.
Figure 1. Sub-landscapes in Targeted Landscape
Figure 2. Sub-landscapes selected and representative sites
A comprehensive baseline assessment comprising of remote sensing, multi-stakeholder group discussions (MSG), Focus Group Discussions, households surveys (SHARP) and value chain analysis was conducted during the PPG period (see Box 3. Integrated Landscape Assessment Metology (ILAM) Toolbox).
For the purpose of the baseline assessment, two sub-landscapes within the target watershed were selected, and deemed representative of the landscape (Figure 2). The Tabora (Kaliua District Council) Region landscape (sub-landscape 1) covers 873,163ha, while the Katavi Region landscape (Mlele District Council) (sub-landscape 2) covers 371,178ha.
The first sub-landscape is located primarily in Kaliua district council (covering about 35% of Kaliua District Council total area) and Urambo district council (covering about 45%
of Urambo district total area). The second sub-landscape is located entirely within the Mlele district council, covering 12.5% of the district total area (371,178.21 ha out of 2,975,133.66 ha). Key project activities will be implemented in these two sub-landscapes and then gradually outscaled to the other sub-landscapes.
The SHARP Survey (ProDoc Annex X-2, link provided at the end of the document) was administered to a sample of 188 households, with 1207 members, between November and December 2019. The sample was considered representative of the targeted populations (i.e. agriculture-reliant livelihoods, land and forest users, sites with identified land degradation issues). The results of the SHARP survey and other components of the baseline assessment, which were used for project targeting and the subsequent establishment of an LDN decision support system, are presented in the following sections.
Box
1. SHARP+ Results Highlights in Katavi and Tabora regionsEconomic activities related to crops, livestock, and forests
Overall, the SHARP survey shows that most respondents (99%) in the sample defined themselves as forest-dependent communities, and that most households are dependent on crop and livestock production for their livelihoods. Of the households surveyed, 84% reported crop production as their primary source of income. In fact, remote sensing data shows that cropland has significantly increased in both sub-landscapes over a 23-year period between 1995 and 2018, to 280,558ha in Kaliua District Council (70% increase), and 23,872ha in Mlele District Council (300% increase) respectively. Nonetheless, about 44% of households in the sample are engaged in some non-farm income generating activities (52% in Tabora Region, 36% in Katavi Region).
Crop production systems
Maize is the main crop produced in both Katavi Region and Tabora Region (86% and 93% of households surveyed, respectively). Other important crops grown are rice (21% in Katavi Region, 20% in Tabora Region), beans (15% in Katavi Region, 35% in Tabora Region), sunflower (10% in Katavi Region, 7% in Tabora Region) and cassava (5% in Katavi Region, 20% in Tabora Region). Approximately 60% of households in Katavi Region, and 29% in Tabora Region, reported an unspecified crop as their main secondary crop[9]. This indicates a low level of crop diversity, tendency to monocropping, as well as a heavy reliance on maize, which is both highly susceptible to the adverse impacts of climate change and pests. The vast majority of farmers (96% on average) in both regions produced at least some crops for their own consumption.
About 21% of households sampled were growing perennial crops, but only 1% of the total planted more than one crop species. Out of those who had the perennial crop, the most common crop was tobacco (43% of households who responded), followed by cotton (25%), other (18%), cashew nuts (13%), and banana (8%). The actual distribution of perennial crops used in the two districts were quite different: in Katavi Region, most households had tobacco as their main perennial crop (71% of the ones who had some perennials, compared to 11% in Tabora Region), while in Tabora Region cotton was predominant (47%, compared to 5% in Katavi Region). Cashew nut production was also significant in Tabora Region, at 21% of the households having reported cropping perennials.
The use of nitrogen-fixing legumes to serve as mechanism to improve soil quality is low in both sites, as only 8% acknowledged this practice.
Most planting material is of local origin (92% of crops), though only 68% are perceived to be well adapted to local conditions. Conversely, foreign crop varieties are also not well suited to local climate conditions as reported by 56% of farmers.
Across the sample, seeds were mainly produced on the farm (58% of sample), bought in shops/markets (33%), or sourced from relatives/neighbors (8%). In terms of capacity to afford seeds and planting material, 40% of households saved seeds and therefore could always access them, with little variation between provinces. Access to seeds was higher in Tabora Region, where 26% had access to seeds ’always’ (as opposed to 20% in Katavi Region) and 13% ‘often’ had access (as opposed to 6% in Katavi Region). Overall, 13% of the sample did not have any access to seeds (likely due to climate stress), and 14% only had access ‘rarely’ (9%), or ‘sometimes’ (5%). In Katavi Region, 18% of surveyed households had no access to seeds, compared to 8% in Tabora Region.
Livestock production systems
Livestock production is primarily semi-nomadic, while a small fraction (about 5%) is fully nomadic. Most households (75%) reported keeping poultry, while about 35% had cattle and/or goats. Almost a quarter of households were involved in beekeeping as well, a key government priority.
Food stocking and dietary diversity
Around 53% of the sample had limited capacity to store some food (tubers or cereals) throughout the year, especially among farmers in Tabora Region (66% vs 39% in Katavi Region). This could be explained by Tabora Region’s lower access to community cereal banks (68% vs 88% in Katavi Region) and smaller presence of home granaries (65% vs 82% in Katavi Region). Crop failure and loss could be other reasons explaining the restricted capacity to do any food stocking, as immediate food consumption was prioritized.
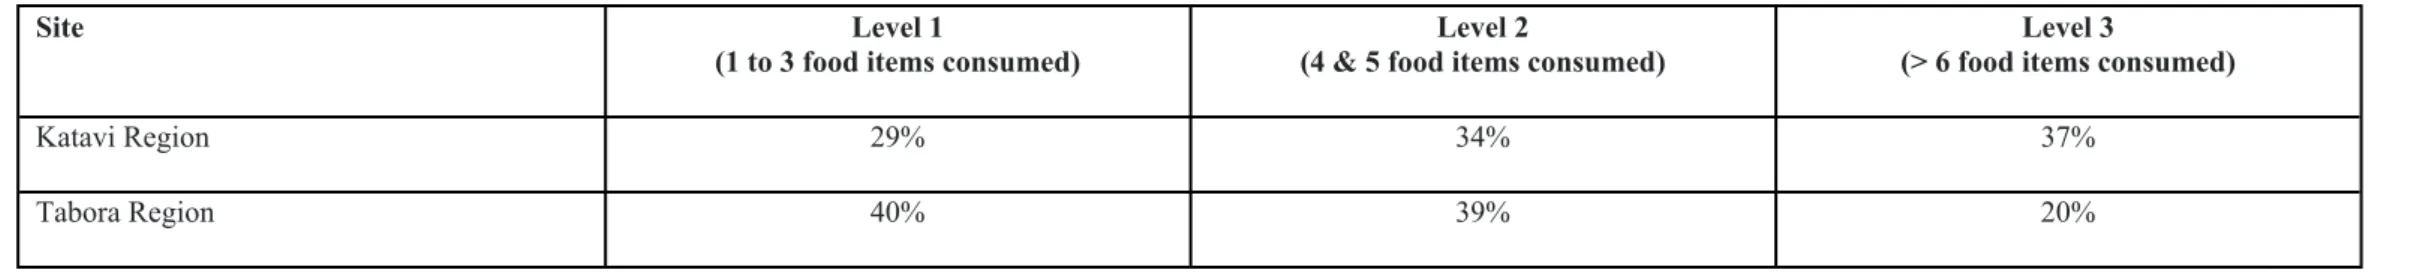
These results also connect to the diversity of diets, as in Tabora Region about 40% of families present low diet diversity (less than 3 food items consumed in the past 24 hours), whilst this compares to 29% of households in Katavi Region.
Table 2. Household Dietary Diversity Score, by Pilot Site
Site Level 1
(1 to 3 food items consumed) Level 2
(4 & 5 food items consumed) Level 3
(> 6 food items consumed)
Katavi Region 29% 34% 37%
Tabora Region 40% 39% 20%
Trees, forest resources and use of timber and NTFPs
On-farm, a vast majority of households reported the presence of trees on their plots (i.e. 96%), and 80% of those reported having more than two species of trees (e.g. Julbernardia globiflora; Pterocarpus angolensis Mangifera spp; Combretum spp). About 20-30% of those trees were reported to be productive. However, extreme weather events, pest outbreaks and uncertainty over land ownership were reported to be important obstacles to on-farm tree planting and growing in the pilot area.
Uses given to on-farm trees and forest resources are similar, with a few exceptions. Shadow for crops and food production from trees are more frequent on-farm (37% vs none and 16% vs 2%, respectively), and timber extraction and honey production more common in forests (23% vs 10%, and 33% vs 14% respectively). Other key uses are charcoal (81% vs
62%), construction material (35% vs 30%), and to source medicine for people or animals (20% vs 12%). Moreover, an estimated 70% of households utilize NTFPs, mainly for food security.
In relation to tree planting and management, women are restricted to a third of all forestry activities, though they produce most of the tree seedlings annually. Women’s involvement in tree planting is dependent on multidimensional factors including ownership of land, size of land and distance to forest products and households income. Women- headed households reportedly plant more trees than male-headed ones. The National Forest Policy gives a statement on general land tenure and forest land rights to be institutionalized for both men and women in local communities – therefore women need to have clear ownership rights to forest and forest land. Despite their involvement in forestry, challenges impede women’s full involvement, utilization of forest resources, and inhibit the sustainable management of forests at large. Women are disproportionately represented in decision-making regarding forest matters and in some instances their involvement is weak.[10]
Awareness of policies on sustainable agriculture, climate change, forest management initiatives
Awareness about forest management initiatives at community level seems to be common, as 68% of households reported to be cognizant of such initiatives. The main purpose of the initiatives mentioned by respondents were environmental services (73%), fuelwood production for consumption (9%), carbon sequestration (5%), and increasing the value of land (5%). Nonetheless, only 11% of households in the sample were aware of any governmental policies or programs on climate change and sustainable agriculture in their area or nationally. This percentage was lower in Tabora Region (7%) than in Katavi Region (11%). Women respondents seemed to be more aware of such policies and programs (15%) compared to men (4%).
Access to resources Land access
Regarding the access to natural resources, 98% of households had access to some land at an average of 9.6 ha of land / household (all ownership types included). In the pilot area the median surface (to which 50% of households had access) was 5 ha. In terms of ownership categories, in Kaliua District Council and Mlele District Council, 84% and 76% of households respectively owned private land. About 24% of households also accessed rented land. In Tabora Region, 12% of households had access to communal forests, and 7%
of households in Katavi Region. Some households (4%) also had access to pastureland.
Formal access to forests was reported by 7% of households in Katavi Region and 12% in Tabora Region, although almost all households declared to be forest-dependent communities. Differences in formal and informal access to communal forests could be linked to the presence of conflicts. Indeed, 32% of respondents in Katavi Region and 36%
in Tabora Region acknowledged the presence of problems that required collective action over the past year. Moreover, 29% of households in Katavi Region (none in Tabora Region) mentioned that issues over the use of forest resources and boundaries, especially between farmer-to-farmer and livestock-to-farmers, have occurred in the past three years.
Water access
Regarding water resources, wells (private and communal) are the main sources to meet household consumption and agricultural needs. Women and young girls were the major actors in accessing and carrying water. As such, the time they have available to engage in income-generating work or attending school remains limited, as most of their day during the dry season is spent walking miles to provide for their households’ daily water needs.
Around 65% of families have noticed a decline in the availability of water, and about 57% of households had little or no access to chlorinated water. On average, 62% of households took action to respond to the decreased water availably, with preferred water conservation strategies being terracing (86%) and water retention ditches (30%). Only a marginal number of rural-based families harvested water or watered at specific times of the day (3%), used mulching (6%), or planting pits (5%).
Climate and other shocks
The heavy reliance on maize, overall limited diversification of crop systems (e.g. tendency to monocropping and uncommon presence of planted perennials), and inadequate access to climate adaptation policies and programs, pose a real challenge in the targeted area in view of climate change. In the last three years, 61% of sampled households experienced an unexpected climate shocks, in particular droughts (reported by 47% in Katavi Region and 92% in Tabora Region) and strong winds in Katavi Region (48%).
Overall, climate change will likely cause greater heat stress for forests and agricultural systems, affecting biodiversity, reducing yields (see also Threats, Root Causes, Drivers and Barriers) and jeopardizing food and nutrition security.
Moreover, non-diversified agricultural production systems, in particular maize, are increasingly affected by pests and diseases. This is supported by the survey results, in which around 80% of farmers reported to be severely affected by pests in the past twelve months. In Katavi Region, 75% of households surveyed indicated that their maize production was affected by pests and diseases, while this was the case of 85% farmers in Tabora Region. In terms of intensity, 57% of households considered intensity of pest outbreaks high and 43% medium. Droughts were also considered as highly severe by 83% of households. Thus, addressing pest outbreaks and the negative effects of droughts in a sustainable manner would be a key priority in the targeted area.
Crop failure was the most common impact of these different shocks (68% of affected households), followed by crop damage (28%), productivity loss (11%) and increased food insecurity (7%). Households in Katavi Region often mentioned productivity loss and food insecurity, by 18% and 9% of households respectively, compared with 6% and 6% in Tabora Region. Only 1% of households experienced no impact from the disturbances.
Despite these negative effects, about half (48%) of the respondents affected did not take any action to cope with these shocks. A few respondents had coping strategies such as starting a new business (12%), changing varieties/breeds (6%), shifting to crop production (8%), and testing different land management practices (8%). About 18% of households mentioned using other coping strategies, which included the support provided by the Government through provision of fast-growing species and synthetic pesticides (which represents a maladaptive coping strategy since it threatens the ecological basis for pest management). Some differences in coping strategies exist depending on the gender of the
household head. Men were more likely to look for financial support (7% vs 1%) as well as changing varieties or breeds (7% vs. 4%) or to engage in off-farm work (3% vs. 1%).
Women-headed households were more likely to sell assets (6% vs. 3%). Households that self-defined as dual (both decide) were much more likely to take no action (70%), shift to crop production (10%), or change varieties or breeds (15%).
Access to information and groups
The delayed and/or inadequate responses and negative impacts of climate and non-climate shocks can also be explained by the insufficient access to information overall. About 62% of households had access to information on weather conditions (64% in Katavi Region and 60% in Tabora Region). Access to information on weather forecasts was lower in male-headed households (37% had access) than in women-led households (74% had access). Out of those, 80% of the farmers had access to information on seasonal weather and more than half had information on extreme events. Only 29% of households had information on starts of rains. Information on pest outbreaks was lacking.
Almost half of the households (49%) did not have access to information on cropping and livestock adaptation practices (in Katavi Region 45%, in Tabora Region 53% did). Agri- service providers and seed companies constituted the main source of information for households in the area (37%), followed by information from government extension workers (12%), Farmer Field Days/Demonstrations (11%), TV (11%) and community meetings (1%). No household reported to have information on post-production practices.
On the other hand, in 54% of households, at least one household member reported being part of a group, organization or association (43% of men-headed households and 58% in dual and women-led families). Most respondents are involved in crop producers’ groups (35%), women’s group (25%) and religious groups. Less than 7% belong to CBOs such as FFS, livestock production, and tree production groups. The main reasons cited to join a group are to gain access to facilities (38%), inputs (18%) and to receive peer support (14%).
Resilience assessment
The household data collected was also a central part to conduct the climate resilience assessment, which in combination with other assessments, supports the identification of key areas for intervention. The average resilience score[11] across all domains and modules for the households sampled in Tanzania was 9.08 out of 20. This means that farmers in the targeted areas do possess certain knowledge and capacity to withstand and adapt to climate and non-climate shocks, thought capacities, as well as access to knowledge and information should be strengthened to promote sustainable transformation and adaptation of their productions systems and livelihoods.
The overall resilience of respondents in Katavi Region was higher (9.55/20) than the average score for Tabora Region (8.73/20). Resilience gaps are identified in the aspects of limited adoption of sustainable practices to improve land and soil quality; high reliance on fuelwood and charcoal as main energy sources; insufficient diversification of livelihoods (non-farm income sources); revenues sources and capacity to save money; and, acknowledged need to improving animal production practices (e.g. species mix or livestock size).
Additionally, low resilience was also connected to the insufficient capacity of households to cope and adapt to climate change, inadequate access to groups and community-based associations, insufficient adoption of water conservation practices, unsatisfactory access to markets and bargaining conditions, limited awareness of and participation in public policies and programs for sustainable agriculture and forestry.
In Katavi Region, key aspects for reinforcing resilience (that is one with average resilience scores of seven or lower) appear to be: ability to respond and adapt to changes in climate and other shocks as pests, increased knowledge on water conservation, diversification of income sources outside agriculture, and improved markets access. Households rated some aspects as priorities for improvement (from most to least important): pest management, land access, land quality, market access, meals, climate change, agricultural practices, community cooperation, energy sources and local and new varieties and breeds.
In Tabora Region, priorities identified through the assessment were: increased engagement in non-farm income sources, improved access to groups and CBOs, enhanced capacity to cope and adapt to climate change and shocks, increased participation in policies and programs related to climate change or agriculture, increased access to profitable markets, improved knowledge on water conservation practices, enhanced diversification and use of clean energy sources.
Both men and women considered the improved knowledge on pest management as the most important aspect to improve. After pest management, women’s key priorities were animal production, improvement of soil quality, energy sources and nutrition status. Other than pest management, men also prioritized crop production.
The Local Economy and Promising Value Chains
Similarly to the context of the target landscape described above, Tanzania’s economy is heavily dependent on agriculture. It accounts for 26% of the national Gross Domestic Product (GDP), employs about 75% of the workforce (including approximately 70% of women) and provides 85% of exports earning. Agricultural production is currently dominated by small-scale, subsistence farmers, with only 1.5% of the arable land under irrigation across the country. The sector is characterized by low productivity which has been linked to a combination of several factors, including: over-reliance on rainfall, utilization of rudimentary and unsustainable production methods (e.g. monocropping), low access to inputs, and low extension service capacity to deal with climate change issues.
Communities of the target landscape are also overwhelmingly self-identifying as forest-dependent. Forests and trees support sustainable agriculture by stabilizing soils and climate, regulating water flows, giving shade and shelter, and providing a habitat for pollinators and the natural predators of agricultural pests. Forests harbor other Non-Timber Forest Products (NTFPs) that provide significant socio-economic benefits, including income generation for rural development, as well as national economic growth and international trade.
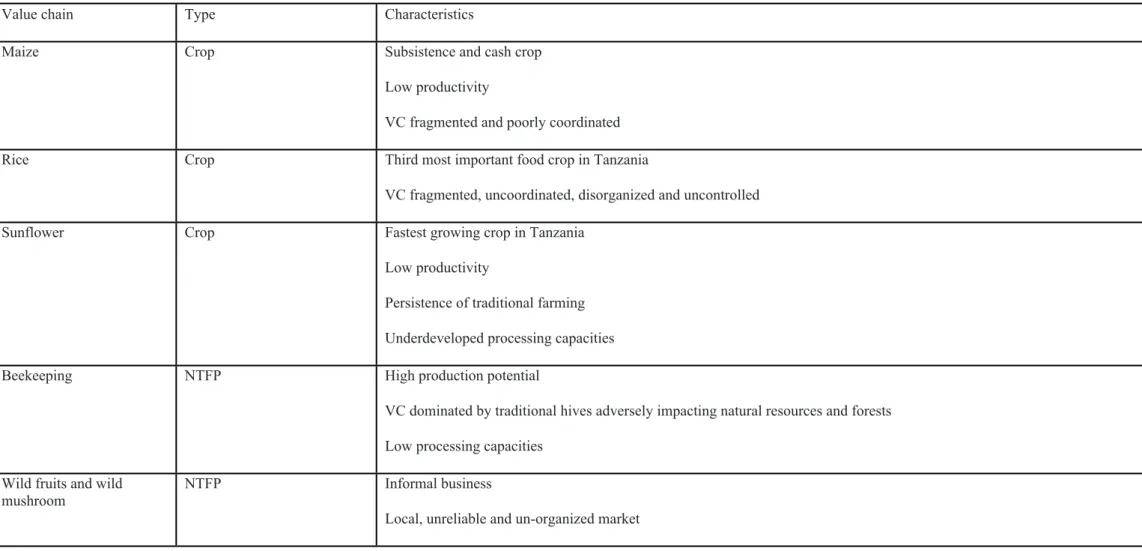
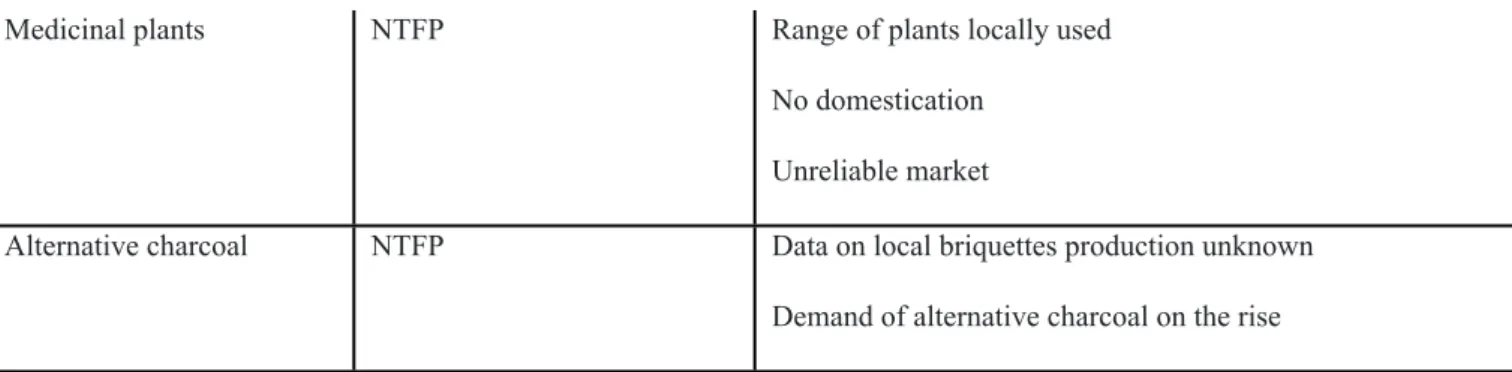
Different crops and NTFP value chains are found across the landscape, though most are not well developed (see Table 3 below). The functioning crop value chains include maize, rice, sunflower, cotton and tobacco; while for NTFP, beekeeping, medicinal plant; edible wild foods are the functional value chains. These value chains are part of existing
community livelihood activities and provide household income. Maize, rice, sunflower, and beekeeping form part of the landscape strategic value chains mentioned in the districts’ socio-economic profiles and investment profiles.
Table 3. Characteristics of crop and NTFP value chains of current importance in the target landscape
Value chain Type Characteristics
Maize Crop Subsistence and cash crop
Low productivity
VC fragmented and poorly coordinated
Rice Crop Third most important food crop in Tanzania
VC fragmented, uncoordinated, disorganized and uncontrolled
Sunflower Crop Fastest growing crop in Tanzania
Low productivity
Persistence of traditional farming Underdeveloped processing capacities
Beekeeping NTFP High production potential
VC dominated by traditional hives adversely impacting natural resources and forests Low processing capacities
Wild fruits and wild
mushroom NTFP Informal business
Local, unreliable and un-organized market
Medicinal plants NTFP Range of plants locally used No domestication
Unreliable market
Alternative charcoal NTFP Data on local briquettes production unknown
Demand of alternative charcoal on the rise
While maize and rice represent the top two most important staples produced in the target landscape, their production systems remain largely unsustainable, with low productivity and susceptibility to climate change and pests. The heavy reliance of farmers on those crops contribute to their increasing vulnerability to shocks. Crop diversification, and a particular focus on intercropping with neglected and underutilized species (NUS), would contribute to addressing these issues. In the Miombo landscape, several NUS crops have been identified as having good adaptability to marginal conditions, as well as be nutrient-dense (see Table 4). Additional benefits could arise from intercropping with nitrogen- fixing legumes, a practice scarcely used in the landscape at the moment (see results of SHARP survey, ANNEX X-2 and link below).
Table 4. NUS crops suitable to the Miombo landscape of Tanzania
Plant Characteristics
Sorghum, millets Millets are a group of annual C4 plants that can grow on a wide variety of soils ranging from clay loams to deep sands but the best soil for cultivation is deep, well-drained soil. This makes it suitable for cultivation by smallholder farmers in semi-arid areas where deep sands and sandy loam soils dominate. In addition, millets are easy to cultivate and can be grown in arid and semi-arid regions where water is a limiting factor for crop growth. Millets (pearl, foxtail and finger millet) are an example of indigenous cereals grown in the dry parts of SSA.
Cowpea (Vigna ungugulata) Cowpea thrives in arid and semi-arid conditions and is produced in areas with optimum rainfall conditions of 400 to 700 mm per annum.
Leaves can be consumed as vegetables, while seeds are eaten in the same manner as dry beans. It can be consumed both as a leafy vegetable and grain legume, thus addressing the gap during periods before the next harvest. Its nitrogen-fixing roots, which help replenish soil nutrients, make it suitable in intercropping systems with maize, millet, sorghum, cassava, yam, etc.
Wild mustard (Brassica juncea and Brassica nigra)
Wild mustard is an indigenous leafy vegetable of sub-Saharan Africa, cultivated under diverse environmental conditions. Wild mustard has been reported to establish quickly, thus achieving optimum ground cover, and able to thrive in water-scarce environments.
Spider plant (Cleome gynandra) The African spider plant is an annual plant, consumed as a leafy vegetable. It is a C4 plant capable of withstanding high daytime temperatures, intense sunlight, and drought. The seeds of the spider plant are high in oil, which be extracted by pressing and does not require refining. After pressing, the remaining seed cake can be used for animal feed.
Bambara groundnut (Vigna subterranean) Bambara groundnut is a grain legume grown mainly by subsistence farmers in sub-Saharan Africa. It is cultivated for its subterranean pods, is extremely hardy and produces reasonable yields even under conditions of drought and low soil fertility. Its nitrogen-fixing roots, which help replenish soil nutrients, make it suitable in intercropping systems with maize, millet, sorghum, cassava, yam, etc. The leaves are rich in nitrogen and potassium and therefore an excellent source of animal feed.
Sweet potato (Ipomoea batatas) Sweet potato is a short duration creeper (90-110 days) suited to low input systems and degraded soils. Its phenotypic plasticity allows it to be planted and harvested all year round. The leaves can be used as a vegetable as well as for animal feed, while the highly nutritious tuber is consumed by people. The orange-fleshed sweet potato varieties can contribute significantly towards reducing Vitamin A deficiency.
Amaranth (Amaranthus spp.) Amaranth is consumed as a leafy vegetable in marginal, arid and semi-arid regions because of its nutritional benefits and ability to adapt to adverse environments. It can grow on a wide range of soils and can tolerate soil pH from 4.5 to 8.0. Amaranthus species are known to be tolerant to adverse climatic conditions, including drought to salinity stress which can help the plant in semi-arid regions as well as areas prone to salinity stress.
Sugar plum Uapaca kirkiana, The plant tolerates poor, shallow soils, gravel, and sandy loam soils. Trees are generally retained for the fruit, which are eaten by children and adults. It is an important famine food in the drier areas of Tanzania. It is often prepared as a sweetmeat or jam, especially in
neighbouring countries. There is considerable potential for domestication of this species considering its popularity with farmers. The tree is a suitable boundary species.
Moringa (Moringa spp), Moringa is a fast-growing tree, which produces leaves during the dry season and during times of drought, suitable to production in diverse habitats, including marginal lands. It is an excellent source of green vegetables when little other food is available as its pods, leaves, seeds and roots are all edible.
Monkey orange (Strychnos cocculoides) The monkey orange is a small tree indigenous to southern Africa, and will survive drought periods by entering a phase of dormancy.
Monkey oranges are characteristically harvested during the so-called “lean season”– a time of cultivated food shortages. The wide distribution of the monkey orange trees in drought prone areas and semi-arid regions, coupled with the fruit nutritional quality renders the fruit an important food source for particularly children and pregnant women.
Marula (Sclerocarya birrea) Marula is an important multipurpose tree through much of Africa, particularly valued for its edible fruit and seed, but also supplying a range of other foods, medicines and various commodities to the local populace. It is a fast-growing, tolerant of saline soils, and productive in soils that are too poor to support other crops.
On the other hand, NTFP value chains remain largely underdeveloped. Although beekeeping/honey is a key government priority and has a great potential to contribute to income diversification in the target landscape, only about 3.5% of its potential is exploited nationally. In the target landscape, Mlele District Council has an area of 850 ha under Inyonga Beekeepers Association (IBA), which is suitable for honey and wax production. In addition, the presence of Miombo forest provides Kaliua District Council with interesting opportunities in edible wild foods (mushroom and fruits) and beekeeping. In fact, Kaliua District Council has about 33 beekeepers groups and produces about 550 Tons of honey on an annual basis.
Threats, Root Causes, Drivers and Barriers
Land degradation
To understand the root causes and barriers to integrated sustainable land and forest management (SLM/SFM) in the Kaliua District Council and Mlele District Council, a rapid participatory LD assessment was conducted during a multi-stakeholder (MSG) group discussion held in Tabora Region. The MSG discussion participants included institutional and land user representatives who completed a LD assessment matrix to determine the two main types (groups) of land degradation, their extent (% of the land area affected), degree (light, moderate, strong, extreme), the rate of degradation (i.e. whether it is stable, active, or the condition of the land is improving), as well as the two main direct causes and indirect drivers per LD type. These assessments were conducted per Land use system (LUS) for croplands, forests and livestock systems (see Full Land Degradation Assessment Report in ProDoc Annex X-2 or link provided at the end of the document). It is important to note that this assessment produces qualitative results based on the consensus perceptions of a diverse group of individuals. The overall status of LD per LUS was classified as low (green), medium (orange), or high (red) as a function of the extent, degree and rate of degradation based on the criteria in Table 5 below. LD bright spot: All the degradation types in the LUS are classified as low (green). LD hot spot: At least one of the degradation types in the LUS is classified as high (red).
Table 5. Classification of low, medium and high state of degradation per degradation type
Degradation status LD Extent LD Degree LD Rate
Low 30% Light/moderate Improving/stable/active
20% Light/moderate/strong Improving/stable/active
10% or less Light/moderate/strong/extreme Improving/stable/active
Medium All combinations that do not fit under "Low" or "High"
High 70% or more Strong/extreme Stable/active
Based on the overall status of LD, LUSs are classified as LD bright spots (green) or hot spots (red) as follows:
LD bright spot: All the degradation types in the LUS are classified as low (green).
LD hot spot: At least one of the degradation types in the LUS is classified as high (red).
Additional information on LD and sustainable land and forest management (SLM/SFM) was obtained from the Collect Earth and household (SHARP) surveys. The qualitative assessment of LD, its root causes and drivers are elaborated in the following sections. The identification of LD bright spots and hot spots serves to flag LUSs for particular closer investigation in terms of the combined LD and SLM/SFM information obtained at regional, district, site or household level.
Based on the above classification, the croplands in the Katavi region is the only LUS in the two regions to appear as a LD bright spot. However, since the LD assessment for croplands was conducted for the overall region, the LD status at specific sites may differ. At household level in the Mlele District Council Phase 1 site, 51% of SHARP respondents indicated that no soil degradation is observed in their area. Where soil degradation does occur, it was confirmed to be chemical soil deterioration (fertility decline and reduced organic matter content), soil erosion by water and gully erosion which correlates with results from the LD assessment. About 71% of households use at least one SLM practice which is mostly manure, crop rotation, intercropping, animal urea, crop residues, fallowing and agroforestry. If these practices are effectively implemented and are indeed responsible for the perceived low degradation rate in the area, there is large opportunity for out-scaling of these practices in the district.
Almost half of households surveyed during SHARP (45%) reported a decline in tree quantity (Tabora Region in 52% vs 38% in Katavi Region) and in diversity within the farmland, and an even larger number of those who had access to some forest considered that the forest had degraded over the past three years (86%). While this trend was similar across sites, it was higher in Tabora Region, where 90% of households mentioned a degradation of their main forest, and only 10% mentioned that it stayed the same.
Interestingly, about 10% of households in Katavi Region mentioned an improvement in the forest they had access to over the past three years.
A number of factors are contributing to this trend in degradation, as outlined above. This is also essentially driven by the fact that a large majority (83% of households in the sample) depend on wood fuel to meet their daily household (e.g. cooking, heating, lighting) and agricultural needs (e.g. tobacco curing), associated with the unsustainable management of trees on-farm and in forests to meet basic needs. Moreover, the combination of low agricultural productivity and population growth is increasing pressure on the remaining dry forest formation outside the PAs and its ecosystem services.
Root causes of land degradation in the landscape
Inadequate sustainable forest management:
This is a key cause of deforestation, largely driven by inadequate sectoral coordination and collaboration. The forestry sector is characterized by some challenges such as the overlapping mandates of key sectors. Several crosscutting responsibilities exist between different governmental institutions that deal with forest management, forest fire fighting, forest protection, law enforcement and other forest related issues. The responsibilities for forest management measures are shared by many sectors, however the actual implementations on the ground is fragmented and uncoordinated[12]. Most importantly, there have been failures to bring in participatory forest management and community-based forest management, and empower local communities to take ownership of the SFM processes. Weak legal frameworks for promotion of private and Community based forest management affect decisions to invest in forestry due to shortage of land; limited availability of land use plans in the majority village lands and some unclear land and tree tenure; as well as limited incentives[13]. This is leading to the continued mismanagement of forests, loss in forest biodiversity, and loss in forest productive functions.Unsustainable extraction of forest and non-forest (timber) products: The unsustainable utilization of forest resources is a leading cause of forest and land degradation in the target landscape, with extraction rates far exceeding regeneration rates, in particular of wood products for wood fuel and construction. Another threat to the ecosystems relates to NTFPs harvesting/gathering. For instance, honey gathering using traditional beehive making by debarking and felling trees (often Julbernardia globiflora) is highly destructive and often targets larger trees. When less abundant tree species are used, this can lead to the disappearance of mature specimens, and diminish the nectar resource, the number of bee colonies, and the number of trees suitable for wild hives[14]. Fires used to control bees can also spread, and threaten surrounding land, forests, and villages. Other NTFPs harvesting is often unsustainable and unrestricted, such as medicinal plants which are said to be disappearing[15], threatening biodiversity.
Unsustainable agricultural activities and low adoption of improved management practices: Unsustainable land management practices are commonplace in the landscape, in particular poorly implemented shifting cultivation and uncontrolled fires. These are all direct causes of land degradation in this landscape. The assessments conducted during the PPG phase showed that shifting cultivation (attributable, amongst others, to an increased competition for arable land) was a key disturbance in the landscape and leading to growing deforestation through clearing. Anthropogenic fires are the greatest disturbance in the Miombo woodlands, and affect up to 50% of the woodland area of Tanzania each year[16], much more than climate-driven fires. These events strongly influence the ecosystem composition, structure, and distribution, including contributing to the fragmentation of the landscape. Moreover, it leads to significant losses in biomass and affects carbon stocks. Other unsustainable practices, leading to different forms of land degradation identified during the PPG phase included continuous mono-cropping, improper management of the soil, and an improper management of annual, perennial, scrub and tree crops.
Agricultural productivity remains low at the landscape level and is affected by a number of factors including pests and diseases, degrading soil conditions, and low use of improved/adapted varieties. Causes of degradation reported in the SHARP survey included the loss of soil fertility and reduced organic matter, followed by water erosion. Low agricultural productivity is a leading factor driving shifting cultivation, in an attempt to compensate for those losses.
Overgrazing: Overgrazing is causing significant soil erosion and physical soil deterioration in the target landscape, as illustrated by the land degradation rapid assessment conducted during the PPG phase. Indeed, areas used for livestock are considered to have the highest levels of degradation and are generally overstocked (Tabora Region is one of the regions with the highest number of cattle in Tanzania[17]). Grazing land management can be highly effective in addressing these issues, but is considered to be poorly implemented in the landscape. The area of land allocated for grazing is small compared to the number of livestock, and pasture is of low quality and quantity. Indeed, communal rangelands are being fragmented (through conversion to permanent agriculture, for instance), decreasing the availability of pastures that livestock depend on for grazing, and increasing pressure on those remaining areas as well as on forest. High number of livestock is found grazing in national forest reserves. Other factors, such as climate change and wildfires, affect rangeland dynamics and are adversely affecting rangeland quality and composition[18]