Innovative transformation of China?s food production systems and agroecological landscapes
Part I: Project Information Name of Parent Program
Food Systems, Land Use and Restoration (FOLUR) Impact Program GEF ID
10246 Project Type FSP
Type of Trust Fund GET
CBIT/NGI CBIT NGI Project Title
Innovative transformation of China?s food production systems and agroecological landscapes Countries
China Agency(ies) FAO, World Bank
Other Executing Partner(s):
Ministry of Agriculture and Rural Affairs (MARA), Hubei Province Department of Agriculture and Rural Affairs
Executing Partner Type Government
GEF Focal Area
Multi Focal Area Taxonomy
Chemicals and Waste, Focal Areas, Pesticides, Climate Change, Climate Change Mitigation, Agriculture, Forestry, and Other Land Use, Climate Change Adaptation, Climate resilience, Land Degradation, Sustainable Land Management, Sustainable Agriculture, Restoration and Rehabilitation of Degraded Lands, Biodiversity, Mainstreaming, Agriculture and agrobiodiversity, Influencing models, Demonstrate innovative approache, Transform policy and regulatory environments, Strengthen institutional capacity and decision-making, Stakeholders, Local Communities, Indigenous Peoples, Private Sector, SMEs, Large corporations,
Beneficiaries, Type of Engagement, Consultation, Participation, Partnership, Civil Society, Academia, Gender Equality, Gender Mainstreaming, Sex-disaggregated indicators, Women groups, Participation and leadership, Gender results areas, Access to benefits and services, Integrated Programs, Food Systems, Land Use and Restoration, Sustainable Food Systems, Comprehensive Land Use Planning, Food Value Chains, Capacity, Knowledge and Research, Knowledge Generation, Workshop, Seminar, Course, Training, Capacity Development, Learning, Adaptive management, Innovation, Convene multi-stakeholder alliances
Rio Markers
Climate Change Mitigation Climate Change Mitigation 1 Climate Change Adaptation Climate Change Adaptation 0
Submission Date 6/18/2019
Expected Implementation Start 4/12/2021
Expected Completion Date 10/12/2026
Duration 60In Months Agency Fee($) 1,211,532.00
A. FOCAL/NON-FOCAL AREA ELEMENTS Objectives/Programs Focal Area
Outcomes Trust
Fund GEF
Amount($) Co-Fin Amount($)
IP FOLU Transformation of
food systems through sustainable
production, reduced deforestation from commodity supply chains, and increased landscape restoration.
GET 13,461,468.00 402,190,000.0 0
Total Project Cost($) 13,461,468.00 402,190,000.0 0
B. Project description summary
Project Objective
To support the innovative transformation of China?s agro-landscapes and agri-food value chains towards environmental and ecological sustainability at scale in support of the 2030 Sustainable Development Goals (SDGs), Rural Revitalization, and climate resilience.
Project Compone nt
Financi ng Type
Expected
Outcomes Expected
Outputs Tru
st Fu nd
GEF Project Financing
($)
Confirmed Co- Financing(
$)
Project Compone nt
Financi ng Type
Expected Outcomes
Expected Outputs
Tru st Fu nd
GEF Project Financing
($)
Confirmed Co- Financing(
$)
1.
Developme nt of integrated landscape managemen t (ILM) systems in agricultural landscapes
Technic al Assistan ce
Outcome 1.1:
Strengthened ILM policies, plans and capacities that promote participatory planning and enable national and provincial
institutions across agricultural landscapes to meet their relevant sustainable agriculture, rural revitalization, land restoration and related climate and biodiversity targets.
Indicators:
? Number of county-level ILM and restoration plans in place
? Number of decision-makers and technical staff of national,
provincial and local governments with increased capacity to apply ILM
? Area under improved
management plans
? Number of new or improved monitoring systems in place and operational beyond project
? Number of improved policies drafted and recommended for adoption
Outcome 1.2:
Innovative payment for agro-ecological services incentive mechanisms in place for sustainable, safe, and smart agri-food systems.
Indicators:
? Number of improved/newly established payment for agro- ecological services incentive
mechanisms
Output 1.1.1 Food and land use collaboration mechanisms established or existing mechanisms strengthened at national and provincial level.
Output 1.1.2 County-level ILM and restoration plans developed and implemented in a participatory process bringing together public and private sectors and supporting cross- sectoral planning and scaling up, ensuring participation of women.
Output 1.1.3 Gender-sensitive capacity building implemented for decision makers and technical staff of the local government on sustainable integrated land and water resources management, sustainable agriculture, biodiversity conservation and restoration.
Output 1.1.4 Monitoring systems for sustainable food systems and land use established (or existing systems improved) and implemented.
Output 1.1.5 Innovative national and provincial policies drafted and
recommended for adoption to support
sustainable food systems and land use.
Output 1.2.1 Analysis of payment for agro-ecological services mechanisms conducted and national/provinci al policy reform on payment for agriculture supported, in order to strengthen biodiversity in agro-production system and sustainability of land and soil resources.
GE T
2,974,375.
00
42,160,000.
00
Project Compone nt
Financi ng Type
Expected Outcomes
Expected Outputs
Tru st Fu nd
GEF Project Financing
($)
Confirmed Co- Financing(
$)
2.
Promotion of
sustainable food production practices and responsible agri-food value chains for the staple crops of rice, wheat and maize, selected cash crops, and livestock
Investm
ent Outcome 2.1:
Sustainable agricultural practices deployed and scaled up that enhance ecological functions, improve soil quality and fertility, mitigate GHG emissions and establish resilient agricultural production models.
Indicators:
? Number of newly developed or improved standards
? Area under improved practices/GAP
? Carbon sequestered or emissions avoided
? Chemical fertilizer and pesticide reduction
? Soil organic matter content
? Average yield per hectare
productivity
? Number of improved livestock waste management investments supported [Hubei only]
Outcome 2.2:
Responsible, market-oriented agricultural value chains
implemented and scaled up, including through government-private enterprise-farmer cooperative partnerships and capacity building.
Indicators:
? Number of farmers (women and men) participating in capacity building activities
? Increased farmer incomes from project supported agri-food value chains [1]
(disaggregated by gender)
? Number of green/
organic/climate- smart agri-food brands certified
? Number of farmer cooperatives with increased capacity to support responsible value chains
[1] Such as from yield increase, crop diversification, and agri-food value chain development.
Output 2.1.1 Sustainable and Climate Smart Agriculture (CSA)
implemented and scaled up to promote carbon sequestration and emission
reduction;
demonstrate effective soil and water
management; and optimize the agricultural environment.
Output 2.1.2 Climate-smart and ecologically sound livestock production and management systems
implemented and scaled up;
livestock waste management technologies; and the
implementation of circular agriculture technologies.
[Hubei only]
Output 2.1.3 Innovations to reduce the use and discharge of chemical fertilizers and pesticides implemented, such as precision agriculture, soil testing, integrated pest management (IPM), ecological interception systems, and digital technologies.
Output 2.1.4 Strengthened high-standard ecological farmland construction implemented according to national standards (such as land levelling, improved irrigation and drainage, and improved field road
accessibility).
Output 2.2.1 Capacity and awareness developed among farmers
(especially women), extension service providers, enterprises and cooperatives on sustainable production and agricultural value chains.
Output 2.2.2 Innovative market linkages and access to finance developed (in particular, for women farmers) in support of sustainable agricultural value chains.
Output 2.2.3 Government- private
enterprise-farmer cooperative partnerships established (or existing partnerships strengthened) and investments made to support scaling up of sustainable value chains and financing from input supply, to production, to processing and marketing.
GE T
5,643,694.
00
227,840,00 0.00
Project Compone nt
Financi ng Type
Expected Outcomes
Expected Outputs
Tru st Fu nd
GEF Project Financing
($)
Confirmed Co- Financing(
$)
3.
Conservatio n and restoration of
agroecosyst ems and biodiversity
Investm
ent Outcome 3.1:
Enhanced conservation and restoration of agroecosystems and biodiversity.
Indicators:
? Species and ecosystems indicators
? Carbon sequestered or emissions avoided
? Area of upland and farmland surrounding ecosystems under ecological restoration/
rehabilitation
Output 3.1.1 Interventions implemented and scaled up to maintain and increase biodiversity in production systems.
Output 3.1.2 Ecological restoration/
rehabilitation implemented and scaled up (e.g., through revegetation of slopes, ecological corridors, trees on farm, vegetation buffers, hedgerows, nutrient interception) to enhance ecological functions of farmland boundaries and surrounding ecosystems.
Output 3.1.3 Agroforestry interventions supported in upland agro- ecosystems to reduce water loss and soil erosion, enhance carbon sequestration, improve ecosystem service functions and increase farmers?
incomes. [Hubei only]
GE T
2,037,574.
00
71,450,000.
00
Project Compone nt
Financi ng Type
Expected Outcomes
Expected Outputs
Tru st Fu nd
GEF Project Financing
($)
Confirmed Co- Financing(
$)
4.
Knowledge managemen t and M&E
Technic al Assistan ce
Outcome 4.1:
Effective knowledge management/infor mation exchange and M&E.
Indicators:
? Number of information dissemination platforms [2]
established (or existing platforms improved) and operational
? Number of people [3] reached by information dissemination and knowledge exchange [2] National, provincial or county-level.
[3] Farmers/
enterprises/
consumers.
Output 4.1.1 Project monitoring and evaluation, and reporting, as well as coordination with and participation in global Impact Program (IP) events and activities, conducted.
Output 4.1.2 Establish diversified information dissemination platforms/mecha nisms to share project achievements, knowledge, experiences, and expand
environmental and social influence to support scaling and replication.
Output 4.1.3 Knowledge effectively created and shared through national and provincial platforms, exchange visits, and global platforms such as the One Planet Network
Sustainable Food Systems
Programme to support
replication at the global, regional, national and provincial levels.
GE T
2,175,886.
00
42,764,000.
00
Project Compone nt
Financi ng Type
Expected Outcomes
Expected Outputs
Tru st Fu nd
GEF Project Financing
($)
Confirmed Co- Financing(
$)
Sub Total ($) 12,831,52 9.00
384,214,00 0.00
Project Management Cost (PMC)
GET 629,939.00 17,976,000.00
Sub Total($) 629,939.00 17,976,000.00
Total Project Cost($) 13,461,468.00 402,190,000.00
C. Sources of Co-financing for the Project by name and by type Sources of
Co- financing
Name of Co-financier Type of Co- financing
Investment
Mobilized Amount($)
Recipient Country Government
Ministry of Agriculture and
Rural Affairs In-kind Recurrent
expenditures
6,000,000.00
Recipient Country Government
Shandong Provincial and District Governments
In-kind Recurrent expenditures
10,000,000.00
Recipient Country Government
Jiangsu Provincial and District Governments
In-kind Recurrent expenditures
10,000,000.00
Recipient Country Government
Jiangxi Provincial and District
Governments In-kind Recurrent
expenditures 10,000,000.00
Recipient Country Government
Guizhou Provincial and District
Governments In-kind Recurrent
expenditures 10,000,000.00
GEF Agency Food and Agriculture
Organization (FAO) In-kind Recurrent
expenditures 300,000.00 Private
Sector
Nanjing Hengcheng
Agricultural Development Co., Ltd.
Grant Investment
mobilized
400,000.00
Private Sector
Nanjing Junsheng Ecological Agriculture Co., Ltd.
Grant Investment
mobilized
400,000.00
Private
Sector Nanjing Tianwei Agricultural
Technology Co., Ltd. Grant Investment
mobilized 400,000.00
Private Sector
Taicang City Donglin Village Farm Professional Cooperative
Grant Investment
mobilized
1,200,000.00
Private
Sector Fenyi Huayong Agricultural Machinery Specialized Cooperative
Grant Investment
mobilized 200,000.00
Sources of Co-
financing
Name of Co-financier Type of Co- financing
Investment Mobilized
Amount($)
Private Sector
Fenyi Qunyuan Agriculture and Animal Husbandry
Development Co., Ltd.
Grant Investment
mobilized
200,000.00
Private
Sector Fenyi Quanfeng Breeding
Professional Cooperative Grant Investment
mobilized 200,000.00
Private
Sector Fenyi Guigen Grain Planting
Professional Cooperative Grant Investment
mobilized 200,000.00
Private Sector
Jiangxi Jiafu Agricultural Technology Co., Ltd.
Grant Investment
mobilized
400,000.00
Private
Sector Jiangxi Zhenghe Ecological
Agriculture Co., Ltd. Grant Investment
mobilized 1,200,000.00
Private
Sector Laizhou Chenggang Road Weisong Plant Protection Professional Cooperative
Grant Investment
mobilized
1,200,000.00
Private Sector
Shandong Changrun Ecological Agriculture Co., Ltd.
Grant Investment
mobilized
1,200,000.00
Private
Sector Guizhou Rongjiangshan Agricultural Development Co., Ltd
Grant Investment
mobilized 1,000,000.00
Private
Sector Guizhou Yueliangshan
Agriculture Co., Ltd. Grant Investment
mobilized 1,000,000.00
Private Sector
Guizhou Liping Dongxiang Rice Production Co., Ltd.
Grant Investment
mobilized
1,000,000.00
GEF Agency World Bank (WB) ? International Bank for Reconstruction and Development (IBRD)
Loans Investment
mobilized 150,000,000.0 0
Recipient Country Government
Hubei Provincial and County
Governments In-kind Recurrent
expenditures 71,690,000.00
Sources of Co-
financing
Name of Co-financier Type of Co- financing
Investment Mobilized
Amount($)
Private Sector
Private sector in Hubei (to be selected during implementation under the framework approach)
Grant Investment
mobilized
124,000,000.0 0
Total Co-Financing($) 402,190,000.0 0 Describe how any "Investment Mobilized" was identified
The investment mobilized was identified during the project formulation (September 2019-May 2020) through consultations with partners and key stakeholders. It includes, notably, a new IBRD-financed USD 150 million ?Hubei Smart and Sustainable Agriculture Project?, an estimated USD 124 private sector counterpart financing in Hubei, as well as USD 10.2 million in financing from local agricultural producers and agri-food enterprises in the four FAO-MARA provinces. Total investment mobilized is USD 284.2.
These amounts do not include any recurrent expenditures.
D. Trust Fund Resources Requested by Agency(ies), Country(ies), Focal Area and the Programming of Funds Agenc
y Trust
Fund Country Focal
Area Programmin
g of Funds Amount($) Fee($)
FAO GET China Biodiversity BD STAR
Allocation
1,914,520 172,307
FAO GET China Climate
Change CC STAR
Allocation 2,393,150 215,383
FAO GET China Land
Degradation LD STAR Allocation
478,630 43,077
FAO GET China Multi Focal
Area IP FOLU Set-
Aside 2,393,150 215,383
World
Bank GET China Biodiversity BD STAR
Allocation 1,675,205 150,768
World Bank
GET China Climate
Change
CC STAR Allocation
2,094,006 188,461
World
Bank GET China Land
Degradation LD STAR
Allocation 418,801 37,692
World
Bank GET China Multi Focal
Area IP FOLU Set-
Aside
2,094,006 188,461
Total Grant Resources($) 13,461,468.00 1,211,532.00
E. Non Grant Instrument
NON-GRANT INSTRUMENT at CEO Endorsement
Includes Non grant instruments? No Includes reflow to GEF? No
F. Project Preparation Grant (PPG) PPG Required
PPG Amount ($) 300,000
PPG Agency Fee ($) 27,000
Agenc
y Trust
Fund Country Focal
Area Programmin
g of Funds Amount($) Fee($)
FAO GET China Land
Degradation
LD STAR Allocation
10,667 960
FAO GET China Biodiversity BD STAR
Allocation 42,667 3,840
FAO GET China Climate
Change CC STAR
Allocation 53,333 4,800
FAO GET China Multi Focal
Area
IP FOLU Set- Aside
53,333 4,800
World
Bank GET China Land
Degradation LD STAR
Allocation 9,333 840
World Bank
GET China Biodiversity BD STAR
Allocation
37,333 3,360
World
Bank GET China Climate
Change CC STAR
Allocation 46,667 4,200
World
Bank GET China Multi Focal
Area IP FOLU Set-
Aside 46,667 4,200
Total Project Costs($) 300,000.00 27,000.00
Core Indicators
Indicator 3 Area of land restored
Ha (Expected at PIF)
Ha (Expected at CEO
Endorsement) Ha (Achieved at
MTR) Ha (Achieved at
TE)
0.00 100000.00 0.00 0.00
Indicator 3.1 Area of degraded agricultural land restored
Ha (Expected at PIF)
Ha (Expected at CEO
Endorsement) Ha (Achieved at
MTR) Ha (Achieved at
TE) 100,000.00
Indicator 3.2 Area of Forest and Forest Land restored
Ha (Expected at PIF)
Ha (Expected at CEO
Endorsement) Ha (Achieved at
MTR) Ha (Achieved at
TE) Indicator 3.3 Area of natural grass and shrublands restored
Ha (Expected at PIF)
Ha (Expected at CEO
Endorsement) Ha (Achieved at
MTR) Ha (Achieved at
TE) Indicator 3.4 Area of wetlands (incl. estuaries, mangroves) restored
Ha (Expected at PIF)
Ha (Expected at CEO
Endorsement) Ha (Achieved at
MTR) Ha (Achieved at
TE)
Indicator 4 Area of landscapes under improved practices (hectares; excluding protected areas)
Ha (Expected at PIF)
Ha (Expected at CEO
Endorsement) Ha (Achieved at
MTR) Ha (Achieved at
TE)
0.00 970000.00 0.00 0.00
Indicator 4.1 Area of landscapes under improved management to benefit biodiversity (hectares, qualitative assessment, non-certified)
Ha (Expected at PIF)
Ha (Expected at CEO
Endorsement) Ha (Achieved at
MTR) Ha (Achieved at
TE) 130,000.00
Indicator 4.2 Area of landscapes that meets national or international third party certification that incorporates biodiversity considerations (hectares)
Ha (Expected at PIF)
Ha (Expected at CEO
Endorsement)
Ha (Achieved at MTR)
Ha (Achieved at TE)
Type/Name of Third Party Certification
Indicator 4.3 Area of landscapes under sustainable land management in production systems
Ha (Expected at PIF)
Ha (Expected at CEO
Endorsement) Ha (Achieved at
MTR) Ha (Achieved at
TE) 840,000.00
Indicator 4.4 Area of High Conservation Value Forest (HCVF) loss avoided
Ha (Expected at PIF)
Ha (Expected at CEO
Endorsement) Ha (Achieved at
MTR) Ha (Achieved at
TE)
Documents (Please upload document(s) that justifies the HCVF)
Title Submitted
Indicator 6 Greenhouse Gas Emissions Mitigated Total Target Benefit (At
PIF) (At CEO
Endorsement) (Achieved
at MTR) (Achieved at TE) Expected metric tons of
CO?e (direct)
0 13300000 0 0
Expected metric tons of
CO?e (indirect) 0 6860000 0 0
Indicator 6.1 Carbon Sequestered or Emissions Avoided in the AFOLU (Agriculture, Forestry and Other Land Use) sector
Total Target Benefit (At
PIF) (At CEO
Endorsement) (Achieved
at MTR) (Achieved at TE) Expected metric tons of
CO?e (direct) 13,300,000
Total Target Benefit
(At PIF)
(At CEO Endorsement)
(Achieved at MTR)
(Achieved at TE) Expected metric tons of
CO?e (indirect)
6,860,000 Anticipated start year of
accounting
2021 Duration of accounting 20
Indicator 6.2 Emissions Avoided Outside AFOLU (Agriculture, Forestry and Other Land Use) Sector Total Target Benefit (At
PIF) (At CEO
Endorsement) (Achieved
at MTR) (Achieved at TE) Expected metric tons of
CO?e (direct)
Expected metric tons of CO?e (indirect)
Anticipated start year of accounting
Duration of accounting
Indicator 6.3 Energy Saved (Use this sub-indicator in addition to the sub-indicator 6.2 if applicable)
Total Target Benefit
Energy (MJ) (At PIF)
Energy (MJ) (At CEO
Endorsement)
Energy (MJ) (Achieved at MTR)
Energy (MJ) (Achieved at TE)
Target Energy Saved (MJ)
Indicator 6.4 Increase in Installed Renewable Energy Capacity per Technology (Use this sub-indicator in addition to the sub-indicator 6.2 if applicable)
Technolog y
Capacity (MW)
(Expected at PIF)
Capacity (MW) (Expected at CEO Endorsement)
Capacity (MW)
(Achieved at MTR)
Capacity (MW) (Achieved at TE)
Indicator 9 Reduction, disposal/destruction, phase out, elimination and avoidance of chemicals of global concern and their waste in the environment and in processes, materials and products (metric tons of toxic chemicals reduced)
Metric Tons (Expected at
PIF) Metric Tons (Expected at CEO Endorsement)
Metric Tons (Achieved at MTR)
Metric Tons (Achieved at TE)
0.00 0.00 0.00 0.00
Indicator 9.1 Solid and liquid Persistent Organic Pollutants (POPs) removed or disposed (POPs type)
POPs type
Metric Tons (Expected at PIF)
Metric Tons (Expected at CEO Endorsement)
Metric Tons (Achieved at MTR)
Metric Tons (Achieved at TE) Indicator 9.2 Quantity of mercury reduced (metric tons)
Metric Tons (Expected at
PIF) Metric Tons (Expected at CEO Endorsement)
Metric Tons (Achieved at MTR)
Metric Tons (Achieved at TE)
Indicator 9.3 Hydrochloroflurocarbons (HCFC) Reduced/Phased out (metric tons) Metric Tons
(Expected at
PIF) Metric Tons (Expected at CEO Endorsement)
Metric Tons (Achieved at MTR)
Metric Tons (Achieved at TE)
Indicator 9.4 Number of countries with legislation and policy implemented to control chemicals and waste (Use this sub-indicator in addition to one of the sub-indicators 9.1, 9.2 and 9.3 if applicable)
Number (Expected at PIF)
Number (Expected at CEO Endorsement)
Number (Achieved at MTR)
Number (Achieved at TE)
Indicator 9.5 Number of low-chemical/non-chemical systems implemented, particularly in food production, manufacturing and cities (Use this sub-indicator in addition to one of the sub-indicators 9.1, 9.2 and 9.3 if applicable)
Number (Expected at
PIF) Number (Expected at CEO Endorsement)
Number (Achieved at MTR)
Number (Achieved at TE)
8
Indicator 9.6 Quantity of POPs/Mercury containing materials and products directly avoided Metric Tons
(Expected at PIF)
Metric Tons (Expected at CEO Endorsement)
Metric Tons (Achieved at MTR)
Metric Tons (Achieved at TE)
Indicator 11 Number of direct beneficiaries disaggregated by gender as co-benefit of GEF investment Number
(Expected at
PIF) Number (Expected at CEO Endorsement)
Number (Achieved at MTR)
Number (Achieved at TE)
Female 240,000
Male 310,000
Total 0 550000 0 0
Part II. Project Justification
1a. Project Description
Introduction
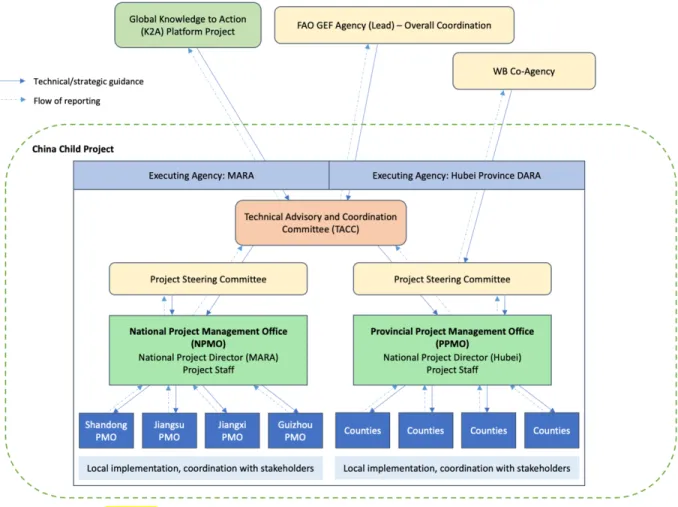
As reflected in the Program Framework Document (PFD), this GEF-7 Food Systems, Land Use and Restoration Impact Program (FOLUR IP) child project in China, entitled ?Innovative transformation of China?s food production systems and agro-ecological landscapes towards sustainability? is composed of two sub-projects. The first one is the USD 8 million sub-project implemented by FAO as the GEF Agency and executed by China?s Ministry of Agriculture and Rural Affairs (MARA). The second one is the USD 7 million sub-project implemented by the World Bank as the GEF Agency, and executed by Hubei Province Department of Agriculture and Rural Affairs (DARA). The World Bank sub-project is blended to an IBRD loan of USD 150 million in Hubei Province, under the ?Hubei Smart and Sustainable Agriculture Project?. The two sub-projects are, thus, financially and operationally independent projects. However, the design of the two sub-projects has been closely aligned and close consultations were held between the two GEF agencies and the two executing agencies during the project design phase. The coordination mechanisms between the two sub-projects are outlined in Section 6. Institutional Arrangement and Coordination of this CEO Endorsement Request.
As explained in Section 3) Proposed alternative scenario, the two sub-projects have been joined with the aim of having a larger reach and impact, in order to support the project?s ambitious goal of transformation of the food production systems and agricultural landscapes in China through an integrated landscape and value chain approach. The two sub-projects combine two equally important approaches for national and provincial upscaling. The FAO-MARA sub-project has a more national reach covering several provinces in different agro-ecological regions, starting from the national level down to the provincial and county level; the WB-Hubei sub-project has a county/provincial focus enabling it to reach a larger coverage and transformation within a single province while also generating lessons and standards that can be applied at national scale. Combined, the two projects contribute to national and provincial upscaling through the development of standards and policies, sustainable value chains, national capacities, and by generating and exchanging best practices and establishing partnerships towards sustainability. All five target provinces are major areas for staple crops (rice, wheat and maize) and important strategic areas for the country?s rural revitalization, green agriculture development and innovation goals in line with China?s national priorities. They also present high potential and capacity to address negative externalities of the country?s food production systems and, thereby, generate global environmental benefits.
1) Global environmental and/or adaptation problems, root causes and barriers that need to be addressed (systems description)
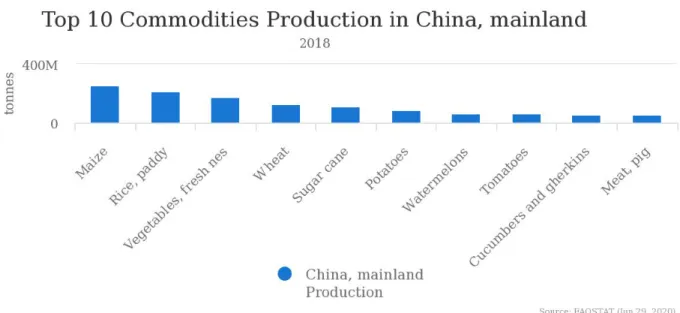
China?s agriculture has undergone rapid transformation over the past four decades. Through institutional and market reforms as well as technological advances, China has been able to meet almost all of its own food demand primarily through increased domestic agricultural production in recent decades. China?s agricultural production has grown by nearly 5% per year since the late 1970s, and total factor productivity growth has accounted for around half of this expansion. This has enabled China to feed nearly 20% of the world?s population with only 5% of the world?s freshwater and 8% of global arable land. China is the world?s largest producer of rice and wheat, accounting for 30% of the world?s rice and 17.5% of the world?s wheat production. China is also the world?s second largest producer of maize; it is the world?s largest producer of pork and second largest producer of poultry. As
in other parts of the world, however, the rapid development of China?s modern agriculture, especially the development of intensive agriculture and its focus on high input and high yield, has led to a number of environmental challenges.
GHG emissions. China?s agriculture is a major emitter of greenhouse gases, accounting for about 14%
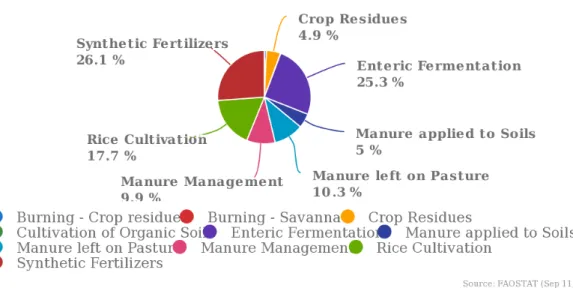
of global agriculture related GHG emissions. The nitrogen fertilization emissions accounts for 30% of the total agriculture GHG emissions, followed by livestock production (27%), energy use (20%), and rice production (13%). The excessive use of synthetic fertilizers with low nitrogen use efficiency and the rapid expansion of livestock production with inadequate livestock waste management are the two key sources of China?s agricultural greenhouse gas emissions. Farm sector energy inefficiencies and the use of carbon-intensive fuels have exacerbated the problem of significant greenhouse gas emissions in the food supply chain. Total GHG emissions from the food system, from production to consumption, are estimated to represent about 20-25% of China?s total national emissions or 4-5% of total global emissions.[1] According to China?s Third National Communication to the UNFCCC in December 2018, the agriculture sector emits an estimated 828 million tons of CO2 equivalent (CO2e), or 7.9% of China?s total emissions. This includes emissions of methane and nitrous oxide from agricultural soils, livestock enteric fermentation, rice cultivation, manure management, and field burning of agricultural residues.[2] Synthetic fertilizers, enteric fermentation and rice cultivation are the three leading sources of agricultural GHG emissions in China. Additionally, soil organic carbon (SOC) in the typical cropland of China is about 30% lower than the world average. Overall, nutrient use efficiencies in China for wheat, rice and maize are significantly lower than in developed countries.
Figure 1: GHG emissions by sector (Source: FAOSTAT)
Land and environmental degradation. The high-yield-oriented intensive agricultural production results in high and wasteful resource consumption, environmental degradation, serious land degradation, and poor ecological service functions. Unsustainable agricultural practices in China have led to the degradation of soils, including soil erosion, compaction, acidification and salinization, and a decline in organic matter. Rapid urbanization and industrialization have led to the changes in land use, the disappearing of relatively fertile farmland and the reclamation of ecologically fragile marginal land including the reclamation of lakes and wetlands. The excessive use of chemical fertilizers and pesticides have caused soil and water pollution and adverse impacts on human health. Over 1.8 million
tons of agricultural pesticides are used every year in China, with an effective utilization rate of only about 37%, compared to up to 60-70% in developed countries.[3] This has not only resulted in soil and water pollution, but is also impacting surrounding and downstream ecosystems, in particular rivers, lakes and the Pacific Ocean, affecting water quality and food safety. Chinese agriculture is a major source of pollution to water bodies, drinking water supplies, and food, causing harm to human health and biodiversity. Improper disposal of pesticide packaging waste and plastic film further leads to environmental pollution. The extensive use of plastic micro-film to retain soil moisture and the practice of mulching the film into the soil during plowing is an important source of marine plastics pollution, an issue of growing global concern. In addition, cropland is affected by heavy metal pollution from mining and other industries. As the largest user of water resources in China, agriculture has also led to the depletion of groundwater and falling water tables, further aggravating trends of land degradation and desertification.
Decline in farmland biodiversity and ecosystem services. High-intensity fertilizer and pesticide inputs, single planting, and industrialized farmland construction have resulted in the loss of farmland natural habitat, a decline in farmland biodiversity (such as plants, birds, arthropods, soil microbes, natural enemies, and buffer vegetation), and the weakening of agricultural system stability and buffer capacity. This has led to more frequent floods and droughts, soil erosion, and increased occurrence of crop diseases and pests? outbreaks. A number of wildlife species, including globally significant avian species, have become dependent on farmland habitats, and the heavy use of pesticides puts their habitat at risk both within and downstream of agricultural land.[4] Agrobiodiversity is being eroded due to the rapid adoption of commercial crop varieties. As highlighted in China?s NBSAP (2011), the habitats of some wild crop relatives have been lost, and up to 70% of the original distribution sites of wild rice have disappeared or diminished.
Climate change impacts. China?s agricultural production systems are highly vulnerable to climate change impacts. According to China?s Third National Communication to the UNFCCC (2018), climate change is already significantly impacting agricultural production in China, most notably through the occurrence, development and damage caused by disease and pests, and by affecting the growth, development and yield of crops. Summer and autumn droughts, extreme temperatures, as well as floods, are becoming more frequent, leading to reduced output of major food crops by negatively affecting germination, flowering and pollination. Studies predict that due to climate change, the rice sowing period will be starting later while the growth period will be shortened.[5] During the 12th Five- Year Plan period, China invested 0.3 trillion yuan for climate change adaptation measures in the agricultural sector, such as water-saving irrigation, dry farming, soil moisture conservation, and conservation tillage.[6] Nonetheless, capacity among farmers and local institutions to prepare for and adapt to these changes, such as through drought- or flood-tolerant varieties, water management, or diversification of production systems, is still low.
Rising incomes and food consumption. Rapid urbanization in China has led to the loss of arable land.
The migration of rural labour force to cities, in particular young men, has resulted in labour shortages, high labour cost, and abandonment of cultivated land in rural areas.[7] Farmers generate more income from non-agricultural wages and land transfers than from the agricultural business itself.[8] China?s population is estimated to peak at 1.44 billion in 2029, which represents an increase by 40 million by 2029. Demand for food is, thus, also expected to increase. With a rapidly rising middle class, meat and dairy consumption will rise further, likely resulting in increased resource use and GHG emissions from agriculture and livestock sectors. On the other hand, increasing consumer awareness has led to growing demand for ?cleaner and greener? quality food, and food safety has become an issue of public concern in China in recent years.[9] Agriculture in China has witnessed a general trend towards larger-scale production and land consolidation. As a result, there has been a sharp increase in various types of
business entities such as cooperatives, households operating in scale, and family farms over the past few years.
China?s agricultural practices and their negative environmental impacts have global implications, given the size of the country. The five project provinces (Guizhou, Hubei, Jiangsu, Jiangxi, and Shandong) are important producers of the staple crops rice, wheat and maize, cash crops such as tea, fruits and vegetables, as well as livestock. Through promoting policy change, innovations and enhancing capacity and knowledge exchange, the project will play an important catalyzing role in addressing barriers to scaling up sustainable agricultural practices, leading to global environmental benefits in China?s food systems.
Target provinces and counties
The China child project will be implemented in five key agricultural provinces of China, as well as at the national level. The target provinces include Shandong and Jiangsu in eastern-coastal China, Hubei and Jiangxi in central/southeast China, and Guizhou in the southwest. Two to four counties were selected in each province for implementation of project activities. The target provinces and counties were selected during project identification and preparation based on a set of criteria agreed by the key project partners. In line with the FOLUR Impact Program strategy, the selected target provinces are major areas for staple crops (rice, wheat and maize), with important negative externalities of the agricultural production system. They also present high potential and capacity to address these negative externalities through an integrated landscape and value chain approach and, thereby, generate global environmental benefits. They are important strategic areas for the country?s rural revitalization, green agriculture development and innovation goals in line with China?s national priorities. Furthermore, the leadership of the provinces, and presence of co-financing from the public and private sector, were also taken into account. The five provinces represent different agro-ecological systems within China, thereby allowing to generate lessons for different agro-ecological regions in the country. Additional counties may be added during implementation. The target areas are summarized below.
Province / County Core Indicator 4 target area ?
improved practices Core Indicator 3 target area ? restoration
Shandong 1. Qihe City 2. Laizhou City 3. Laiyang City 4. Qingyun City
145,000 hectares 20,000 hectares
Jiangsu
5. Taicang City 6. Liuhe City 7. Jiangning District 8. Huaiyin District
115,000 hectares 20,000 hectares
Jiangxi
9. Fenyi County 10. Yushui County
80,000 hectares 20,000 hectares
Guizhou
11. Liping County 12. Rongjiang County 13. Congjiang County
110,000 hectares 20,000 hectares
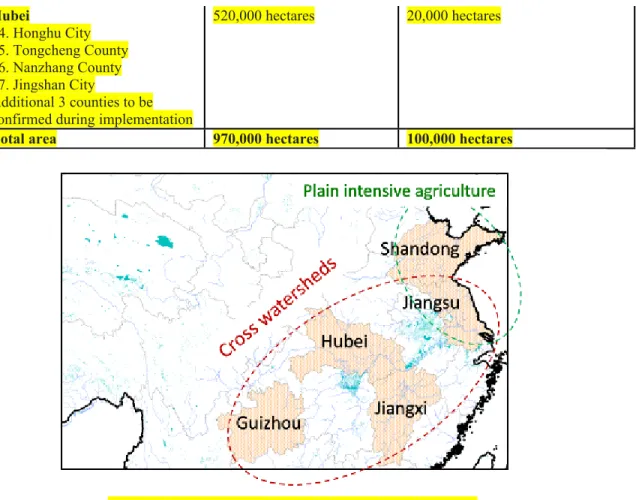
Hubei
14. Honghu City 15. Tongcheng County 16. Nanzhang County 17. Jingshan City
Additional 3 counties to be confirmed during implementation
520,000 hectares 20,000 hectares
Total area 970,000 hectares 100,000 hectares
Figure 2: Agro-ecological regions of GEF-7 target provinces
As major staple crop producing areas, the five provinces have long been pursuing high agricultural productivity at the expense of biodiversity, the farmland environment and quality. Intensive agriculture and the overuse of chemical inputs have led to a decline in soil fertility, degradation of productive landscapes, and contamination of soil and water, the depletion of groundwater and falling water tables, loss of biodiversity and habitats, and decrease in agrobiodiversity. Agriculture is an important source of pollution of rivers and lakes, and GHG emissions. Representing different agro-ecological regions, the five provinces face similar threats and drivers and are representative of the main challenges that China needs to address in order to achieve a sustainable food production system and sustainable rural livelihoods. A holistic approach involving integrated planning, incentive systems, implementation of innovative, sustainable production practices, restoration and conservation is required in order to address the challenges that these provinces face.
The Huang-Huai-Hai River Basin, the midstream and downstream of the Yangtze River, and the source basin of Zhujiang River upstream, of which the five target provinces are part, have important strategic significance in the construction of ecological civilization and the sustainable protection of agricultural products in China.
Shandong. The main issue of intensive agriculture in Shandong is that long-term large-area single wheat-maize rotation has resulted in reduced biodiversity, frequent occurrence of pests and diseases increasing year by year, and increasing use of chemical pesticides, soil erosion, soil quality degradation, salinization and drought, as well as water shortages. The severe shortage of water resources is a key issue that constrains agricultural development in the region. The per capita water
volume in the North China Plain is only 29% of the national average. Moreover, 5% of the land area in Shandong is affected by desertification; and 5.45% is affected by soil and water erosion.
Jiangsu. In recent years, the environmental problems of excessive application of chemical fertilizers such as nitrogen and phosphorus in this area have attracted many concerns, such as eutrophication of water bodies, greenhouse gas emissions and soil acidification, biodiversity loss, and deterioration of farmland ecology. In addition, due to monocropping, winter rice fields are inundated for a long period of time, causing the soil layer to become hardened and shallow. Soil organic matter content is reduced, and physical and chemical properties are deteriorated. This has become a limiting factor for improving rice yields and enhancing the ecological service function of rice fields, which has seriously restricted the sustainable development of agriculture in the region.
Jiangxi. The province is affected by soil erosion, with almost 16% of the total land area affected. This is in part due to heavy rainfall leading to surface runoff. The problems of soil acidification, hardening, nutrient disequilibrium, and soil biodiversity decline, microbial diversity reduction, occur locally. In addition to crop farming, livestock and aquaculture are a source of agricultural non-point source pollution. Most forest areas in Jiangxi are secondary or artificial forests that are low in biodiversity.
Guizhou. The major issues of land and environmental degradation in Guizhou are biodiversity decline, soil fertility decrease, and nutrient losses of crop land, as well as water soil erosion of hill land (economic trees and/or fruit orchards). The province also experiences drought and abrupt drought-flood alternations in summer.[10] The farmland is very small in size and spatially fragmented, leading to small operation scale of farmer households and low market competitiveness. Due to the modern intensive rice production system development for higher-yield, the landraces conservation and global important agricultural heritage face serious challenges.
Hubei. Hubei?s agriculture has a significant environmental footprint in the province as well as in the country. With over 650 large scale pig farms with more than 10,000 pigs each ? ranking first in the country ? Hubei contributes a sizable share to the nation?s emissions. In 2015, the Chemical Oxygen Demand (COD) from agriculture sources in Hubei was 448,100 tons and that of ammonia nitrogen was 43,800 tons. Due to the overuse of fertilizer, nearly 30 million mu of soil is acidified. An estimated one million square kilometers of farmland have experienced soil contamination, including excessive levels of heavy metals, due to pesticide overuse. Heavy use of pesticides has been especially common in rice, vegetable, and tea production. The province?s straw production totaled 38 million tons, but more than 20% was wasted. For livestock manure, the utilization rate is less than 50%. Together, these represent important opportunities for circular agriculture that have not been realized. By some estimates, the Yangtze River, which flows through Hubei, is one of the biggest carriers of plastic pollution to the ocean in the world. Food packaging and plastic mulch from agriculture are important sources of this pollution. The high levels of agricultural and rural environmental pollution in Hubei have directly affected the quality and safety of agri-food products.
Shandong has a total cropland area of 7.6 million hectares, of which around 4 million hectares of winter wheat-summer maize planting area. Jiangsu?s total cropland area is 4.6 million hectares, with 2.2 million hectares of winter wheat-summer rice rotation. Jiangxi, in turn, has 3 million hectares of cropland; with rice planting area of 3.5 million hectares[1], mostly double-season rice or rice-rapeseed rotation. Hubei has a total cropland of 5.23 million hectares, of which 2.39 million hectares for rice production, 1.22 million for vegetables, 0.93 million for canola/rapeseed, 0.37 million for fruit, 0.32 million for tea, and 0.93 million hectares for freshwater aquafarm. Guizhou has a total cultivated land area of 4.5 million hectares; its rice planting area is 700,000 hectares, and its maize planting area 1 million hectares. A description of the target provinces and selected counties, and the specific challenges
they face with regard to the degradation of the natural environment as a result of targeted commodities production, can be found below.
Province Basic information and specific challenges
Shandong Shandong lies within the North China Plain, also known as the Huang-Huai- Hai Plain. The area of ??cultivated land in the North China Plain is 23 million hectares and accounts for 18.9% cultivated land of the country. The area is semi-arid and semi-humid, and the thermal resources can meet the requirements of two-year planting. The main planting mode is the winter wheat-summer maize rotation, and peanuts, cotton, soybeans and rice are also widely planted in this area. The North China Plain has a long history of farming.
Shandong Province is located in the lower reaches of the Yellow River (Huang He), and represents an important commodity grain base of China.
Shandong has a population of 100.9 million and is the second most populous province in the country. It is among the most developed provinces in China.
Shandong is the second largest wheat-producing province (after neighbouring Henan Province), accounting for 19% of national production.
Shandong is also the second largest maize-producing province, with 10.4%
of the total national maize production.
The territory of Shandong includes two parts: peninsula and inland. The mountains in the central part, the low-lying areas in the southwest and northwest, and the gentle hills in the East form a terrain of mountains and hills interlaced with plains. The climate of the province is warm temperate monsoon climate. Shandong has rich diversity of plant species, in particular wild fungi and medicinal plants. It also hosts the rich estuarine wetland ecosystem of the Yellow River Delta, offering important habitat for migratory birds such as the vulnerable Swan Goose, White-naped Crane, as well as hawks and falcons. Shandong has a forest cover rate of 17.95%.
Laizhou City is a county-level city in Yantai Prefecture, located to the northwest of Jiaodong Peninsula[2]. The city covers an area of 192,700 hectares, of which 66,700 hectares are cultivated land, accounting for 34.6%
of the total area. Laizhou has 43,000 hectares of wheat-maize rotation sections. The main challenges with regard to land and environmental degradation associated with wheat-maize rotation in Laizhou City are the large-scale use of chemical fertilizers and pesticides leading to soil and water pollution, inadequate agricultural practices causing soil compaction, and water shortages due to overexploitation of water resources. In addition, the single planting structure (monoculture) has led to poor agro-biodiversity and landscape diversity of farmland. Sustainable agriculture practices that have the potential to be scaled up are soil fertility cultivation, high standard farmland construction, fallow and crop rotation and reduced fertilizer and pesticide use.
Qihe County is located to the south end of Dezhou Prefecture, facing Jinan across the Yellow River. The county covers an area of 141,100 hectares, including 84,000 hectares of cultivated land, accounting for 59.5% of the total area. The annual grain planting area of Qihe County is 77,300 hectares, of which 74,900 hectares of wheat-maize rotation area. Similar to Laizhou City above, the main challenges in Qihe include overuse of fertilizers and pesticides, single planting structure leading to a decline in biodiversity, unsustainable use of water resources, and a lack of more sustainable technologies due to the small scale of farmer households and the lack of incentives for technological upgrading.
Jiangsu Jiangsu is located in the lower reaches of the Yangtze River, on the east coast of China. The province has a population of 80.3 million and, like Shandong, ranks among the most developed provinces in China. The middle and lower reaches of the Yangtze River is one of the three major plains in China, with dense river networks, and numerous lakes. It is also the most developed area of ??China?s economy. The area is not only a region with the most abundant water resources in China, but also one that faces serious water pollution. The main planting modes are rice-rape, rice-wheat, single- season rice, wheat-maize, etc. It is known as the ?land of fish and rice?.
Jiangsu Province is a typical region with two harvests each year for rice and wheat in China. It is the largest japonica rice production province in the south, and also the national high-quality weak gluten wheat production advantage area. Maize, peanut, rapeseed and a variety of miscellaneous grains as well as other special grain and economic crops are grown all over the province. The terrain is mainly plain, covering an area of 70,000 km2, accounting for 70% of the total area of the province, and the low mountains and hills account for 14.3%. The province has a transitional climate from temperate zone to subtropical zone.
Jiangsu has rich biodiversity, including 20 species of rare and endangered plants or key national protected plants. Jiangsu marine and coastal wetlands, in particular Yancheng Wetland, are a migration channel between East Asia and Australia. They provide an important breeding or wintering place for endangered birds such as Red-crowned Crane and Black-faced Spoonbill.
Jiangsu has a forest cover rate of 22.9%.
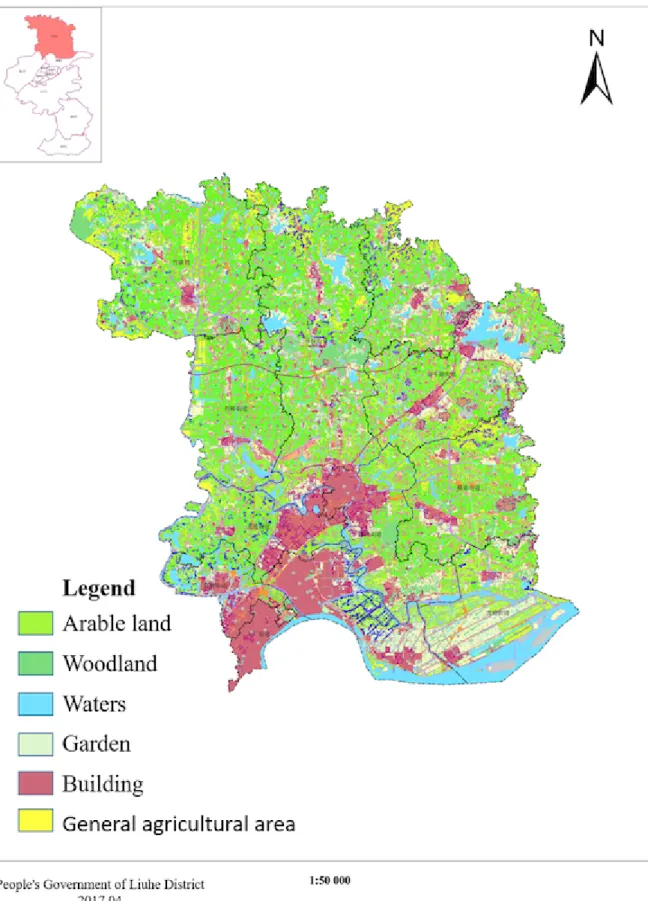
Liuhe, the northernmost district of Nanjing City, is located in the lower reaches of the north shore of the Yangtze River. The district covers an area of 129,500 hectares, including 59,400 hectares of cultivated land, accounting for 45.9% of the total area. Around 22.46% of the agricultural land is affected by reduced soil quality and fertility. The main challenges with regard to land and environmental degradation associated with rice- wheat production in Liuhe include (1) excessive use of chemical fertilizers and pesticides leading to soil and water pollution and declining soil fertility;
(2) single planting structure causing biodiversity decline; and (3) lack of suitable production techniques. In addition, the ageing of farmers and small, fragmented farmland pose challenges to the introduction of new technologies.
Taicang, a county-level city under the jurisdiction of Suzhou, is located on the South shore of the Yangtze River Estuary, bordering Shanghai to the south. The city covers an area of 81,000 hectares, including 25,300 hectares of cultivated land, accounting for 31.2% of the total area. The main challenges with regard to land and environmental degradation associated with rice-wheat production in Taicang are (1) the area of cultivated land is decreasing; (2) the fertility of farmland soil continues to decline; (3) excessive use of chemical fertilizers and pesticides.
Jiangxi Jiangxi Province is an important water source in the Yangtze River and Zhujiang River Basins. Most of the province is located in the subtropical region, and the double-season rice cultivation is the main model. The province has a population of 46.5 million and ranks among the less developed provinces of China in terms of gross domestic product (GDP).
The province is located in the southeast of China, to the South shore of the middle and lower reaches of the Yangtze River. The total area of the province is 166,900 km2. The province is surrounded by mountains on the southeast and west sides, with wide hills on the inner side and flat plain in the middle and north part. From the south to the north, it gradually inclines to Poyang Lake, forming a huge basin opening to the north. The province has a subtropical monsoon climate.
Jiangxi has rich biodiversity and forest resources, with a forest cover rate of 65%. It has numerous rare and threatened plant and animal species, including the black bear, white necked pheasant, yellow bellied pheasant, etc. The wetland of Poyang Lake, the largest freshwater lake in China (where FAO is implementing a GEF-5 project in collaboration with the Forestry Department of Jiangxi Province[3]), provides important wetland habitat for biodiversity, including migratory birds such as Swan and wild goose, and white crane.
Yushui District is one of two county-level divisions of Xinyu City and is located to the west of the central section of Jiangxi Province, along the Yuan River. It is part of the low mountain and hilly area. The district covers an area of 117,400 hectares, of which 28,800 hectares are the cultivated land, accounting for 24.5% of the total area. The main challenges with regard to land and environmental degradation associated with rice production in Yushui are the excessive use of chemical fertilizers and pesticides and soil erosion, acidification and compaction. Low yields and the low degree of mechanization pose challenges for farmers. In addition, the single planting structure leads to reduced agricultural biodiversity and increased occurrence of plant pests and diseases.
Fenyi County, the other division of Xinyu City, is located in the middle reaches of the Yuanhe River. It is a low mountain and hilly area. The county covers an area of 138,900 hectares, including 19,300 hectares of cultivated land, accounting for 13.9% of the total area. The main challenges with regard to land and environmental degradation associated with rice production in Fenyi include: (1) the cultivated land is seriously polluted and the quality is low due to overuse of chemicals and single planting; (2) the degree of agricultural scale management is low; (3) the frequency of extreme weather events is increasing; (4) the agricultural production is low.
Guizhou Guizhou Province is a typical mountainous province of China rich in biodiversity, and it is also a region of ethnic cultural diversity. It has a population of 36 million; its GDP per capita is among the lowest in China.
Guizhou Province is very diverse in minority groups, with ethnic minority people representing approximately 30.7% of the total population. Guizhou is home to some of the largest primary forests remaining in Central China and provide habitat for many rare animal species. 61.9% of the area of Guizhou is karst landscape. The Guizhou Plateau has abundant mountainous areas, and is known as ?eight mountains, one water and one field?. The landforms of the province can be summarized into four basic types of plateau, mountains, hills and basins, in which 92.5% of the area is mountains and hills. The climate in most parts of the province is mild, with no severe cold in winter, no extreme heat in summer, and four distinct seasons.
The project will involve the three counties of Liping, Rongjiang and Congjiang, located in Qiandongnan Miao and Dong Autonomous Prefecture in south-eastern Guizhou. The counties are home to the Dong, Miao as well as other ethnic minority groups. Liping County has a total land area of 444,100 ha and a cultivated land area of 44,800 ha, of which 20,300 ha of single-cropping rice.
Rongjiang County has a total area of 329,600 ha, a cultivated land area of 23,100 ha, of which 10,793 ha of rice. Rongjiang county is a ?national key ecological functional zone transfer payment county? and a ?national ecological civilization demonstration county?.
The percentage of poor farmers is 1.26% in Guizhou Province, 14.26% in Rongjiang County, and as high as 77.12% in Liping County. Nevertheless, in recent years, Liping County has achieved significant results in poverty alleviation.
The main challenges with regard to land and environmental degradation associated with rice in the three target counties of Guizhou are farmland biodiversity decline, soil fertility decrease, and nutrient loss of cropland.
Improper/excessive use of pesticides and herbicides is common due to a lack of knowledge and awareness among farmers of viable alternatives.
Furthermore, due to a lack of technologies, land fragmentation and lack of knowledge and capacity to optimize water management, flooded rice production leads to significant GHG emissions. The rate of rice straw reutilization or incorporation into the soil is very low in the three counties compared to the provincial and national average (20% or lower). In addition, the counties face serious water and soil erosion of hill land where economic trees and/or orchards are planted. There is a need to reduce the use of chemical inputs in the cropland and increase vegetation cover of hilly land to conserve and restore land and biodiversity.
Hubei Agriculture (including cropping, forestry, animal husbandry and fisheries) accounts for a
fifth of the total provincial GDP and provides livelihoods or employment for some 15% of the province?s population. Hubei is home to 59 million people, covering a total land area of 185,900 km2. Hubei?s agriculture has a significant environmental footprint in the province as well as in the country.
With over 650 large scale pig farms with more than 10,000 pigs each ? ranking first in the country ? Hubei contributes a sizable share to the nation?s emissions. In 2015, the Chemical Oxygen Demand (COD) from agriculture sources in Hubei was 448,100 tons and that of ammonia nitrogen was 43,800 tons. Hubei?s average fertilizer application rate of 400 kg per hectare is 74 kg more than the national average and third ranked in the country. Over the past three decades, the total amount of fertilizers applied in Hubei has increased by 55%. Due to the overuse of fertilizer, nearly 30 million mu of soil is acidified. Heavy use of pesticides has been especially common in rice, vegetable, and tea production. The province?s straw production totaled 38 million tons, but more than 20% was wasted. For livestock manure, the utilization rate is less than 50%. Together, these represent important opportunities for circular agriculture that have not been realized. By some estimates, the Yangtze River, which flows through Hubei, is one of the biggest carriers of plastic pollution to the ocean in the world.
Food packaging and plastic mulch from agriculture are important sources of this pollution. The high levels of agricultural and rural environmental pollution in Hubei have directly affected the quality and safety of agri-food products.
The concept of agricultural production aiming at ?3S? (Smart, Sustainable and Safe) has not yet been formed in the project area, which is mainly manifested in the lack of regional planning and design according to the goal of good agro-ecological landscapes and policies. In farmland (crops, tea gardens, orange gardens, etc.), deep plowing of the land, the absence of buffer zones, etc. lead to soil erosion; unreasonable application of pesticides and plastic waste (residual plastic bags, mulch film, etc. in the plantation area) result in chemical and plastic pollution. The quality of the ecological environment in rural areas has declined, landscape fragmentation is pronounced, and biodiversity has decreased. Agricultural technology extension departments, cooperatives, and farmers have yet to realize the importance of agricultural landscapes and biodiversity to agricultural production, and they lack corresponding knowledge and technologies. In Honghu City, the landscape tends to be fragmented and the soil stability is weakened. Excessive use of chemical fertilizers and pesticides has led to serious agricultural non-point source pollution; excessive development has led to a decline in biodiversity and deterioration of the ecological environment. The intensification of agriculture and simplification of farmland vegetation in Jingshan City have led to the degradation of natural resources and ecological functions. In Nanzhang County, the agricultural ecosystem is fragile and fragmented; overuse of chemicals causes agricultural non-point source pollution; some rice fields and tea gardens adopt deep tillage, resulting in erosion and loss of soil fertility. The agricultural landscape in Tongcheng County is characterized by monocultures and a lack of farmland biodiversity, the excessive hardening of farmland ditches and roads, and the degradation of animal and plant habitats.