LDN Target-Setting and Restoration of Degraded Landscapes in Western Andes and Coastal areas
Part I: Project Information GEF ID
10184 Project Type FSP
Type of Trust Fund GET
CBIT/NGI CBIT No NGI No Project Title
LDN Target-Setting and Restoration of Degraded Landscapes in Western Andes and Coastal areas Countries
Ecuador Agency(ies) FAO
Other Executing Partner(s) CONDESAN (Operating Partner) Executing Partner Type CSO
GEF Focal Area Land Degradation Taxonomy
Focal Areas, Land Degradation, Food Security, Sustainable Land Management, Sustainable Agriculture, Drought Mitigation, Ecosystem Approach, Sustainable Livelihoods, Integrated and Cross-sectoral approach, Income Generating Activities, Restoration and Rehabilitation of Degraded Lands, Community-Based Natural Resource Management, Sustainable Pasture Management, Improved Soil and Water Management Techniques, Land Degradation Neutrality, Carbon stocks above or below ground, Land Cover and Land cover change, Biodiversity, Biomes, Tropical Rain Forests, Paramo, Influencing models, Strengthen institutional capacity and decision-making, Convene multi-stakeholder alliances, Deploy innovative financial instruments, Transform policy and regulatory environments, Demonstrate innovative approache, Stakeholders, Communications, Awareness Raising, Behavior change, Private Sector, Capital providers, SMEs,
Individuals/Entrepreneurs, Financial intermediaries and market facilitators, Indigenous Peoples, Beneficiaries, Type of Engagement, Partnership, Information Dissemination, Consultation, Participation, Civil Society, Community Based Organization, Non-Governmental Organization, Local Communities, Gender Equality, Gender Mainstreaming, Sex-disaggregated indicators, Gender-sensitive indicators, Women groups, Gender results areas, Capacity Development, Participation and leadership, Capacity, Knowledge and Research, Learning, Adaptive management, Indicators to measure change, Theory of change
Rio Markers
Climate Change Mitigation Climate Change Mitigation 1 Climate Change Adaptation Climate Change Adaptation 1
Submission Date 1/29/2021
Expected Implementation Start 3/1/2021
Expected Completion Date 9/30/2025
Duration 48In Months Agency Fee($) 419,540.00
A. FOCAL/NON-FOCAL AREA ELEMENTS Objectives/Programs Focal Area
Outcomes Trust
Fund GEF
Amount($) Co-Fin Amount($)
LD-1-1 Maintain or improve the
flow of agro-ecosystem services to sustain food production and livelihoods through Sustainable Land Management (SLM).
GET 1,071,000.00 5,457,008.00
LD-1-2 Maintain or improve the
flow of ecosystem services including sustainable livelihoods of forest dependent people through Sustainable Forest Management (SFM
GET 1,071,000.00 6,590,579.00
LD-1-3 Reduce pressures on
natural resources from competing land uses in the wider landscape.
GET 1,071,000.00 4,200,000.00
LD-2-5 Create enabling
environments to support the scaling and
integration of SLM and LDN.
GET 1,203,210.00 12,081,200.00
Total Project Cost($) 4,416,210.00 28,328,787.00
B. Project description summary
Project Objective
Prevent, reduce and reverse land degradation processes (SDG 2, 13, 15) to promote the sustainable development of rural communities, ensuring the provision of key ecosystem services and food sovereignty, within the framework of national efforts to achieve the LDN in Ecuador (2.4.1; 13.2.1; 15.3.1).
Project
Component Financin
g Type Expected
Outcomes Expected
Outputs Trus
t Fun d
GEF Project Financing(
$)
Confirmed Co- Financing($
)
Project Component
Financin g Type
Expected Outcomes
Expected Outputs
Trus t Fun d
GEF Project Financing(
$)
Confirmed Co- Financing($
)
1:
Strengthening enabling environment for LDN implementatio n and monitoring.
Technical
Assistance Outcome 1.1:
Institutional actors make decisions with a LDN approach based on an established monitoring system that is regularly fed.
Target: LDN information gathering and monitoring system working and producing LDN national indicator reports mainstreamin g gender and interculturalit y variables.
Outcome 1.2:
Key actors at national and sub-national levels apply knowledge and tools for the
implementatio n of the LDN approach to measures planning, implementatio n and monitoring.
Targets: i) At least 100 technicians (national, sub- national, researchers) with solid knowledge and skills in LDN measures planning, implementatio n and monitoring.
ii) At least 30 community promoters trained to promote the LDN approach (40% are women; 30%
from villages and
nationalities) iii) At least 90 people with solid
capacities for the SLM practice implementatio n (40% are women; 30%
from villages and
nationalities).
Outcome 1.3:
National and sub-national authorities include the LDN
approach into national policies and planning processes, at different levels and with appropriate inter-agency coordination mechanisms.
Target: At least 1 intersectoral and/or multilevel coordination mechanism activated with LDN actors.
Output.1.1.1:
LDN indicators baseline assessed at national and local level.
Output.1.1.2:
Participatory assessment of SLM practices that prevent and reduce land degradation, restore ecosystems, reduce emissions and enhance the provision of ecosystem services.
Output 1.1.3:
Monitoring of LDN
indicators at national and sub-national levels, integrated with reporting mechanisms.
Output 1.2.1.
Capacity strengthening tools for LDN targets planning, implementatio n and monitoring, with a gender and
intercultural approach, and available, operational and
implemented by key actors.
Output 1.3.1:
National policies and sub-national territorial planning instruments (new or existing) are part of the LDN approach and consider the specific priorities of women and peoples and nationalities.
Output: 1.3.2 National LDN Action Plan designed and operational including national LDN targets.
GET 1,079,307.0 0
13,332,740.0 0
Project Component
Financin g Type
Expected Outcomes
Expected Outputs
Trus t Fun d
GEF Project Financing(
$)
Confirmed Co- Financing($
)
2:
Demonstratio n of LDN approach to promote resilient livelihoods and SLM/SFM practices in prioritized landscapes
Investmen
t Outcome 2.1:
Landowners and users adopt sustainable land management practices at intervention sites to prevent and/or reduce land degradation and restore ecosystem services.
Targets: i) 2,000 ha of forests restored to maintain ecosystem services in 3 intervention sites (GEF Indicator
#3.2)
ii) 2,000 ha of paramo and shrub ecosystems restored to maintain ecosystem services in 3 intervention sites (GEF Indicator
#3.3) iii) 4,750 ha of landscapes under SLM in productive systems in 3 intervention sites (GEF Indicator
#4.3)
iv) 20,000 ha of high value forests conserved in 3 intervention sites (GEF Indicator
#4.4) v) At least 3,750 people (1,500 women and 1,125 from villages and
nationalities) have implemented on-farm SLM practices and their full impact has been assessed (GEF Indicator #11) vi) 5?356.230 tCO2eq sequestered or avoided emissions due to SLM practices and avoided deforestation
Output.2.1.1:
Ongoing participatory plans for the LDN
implementatio n
(mainstreamin g gender, landscape, and intercultural approaches) in the context of the LDN National Action Plan.
Output 2.1.2:
Gender and intercultural- sensitive SLM/SFM practices implemented in the project intervention areas (ecosystems and productive landscapes), which restore vegetative cover, soil organic carbon, water regime and increase productive systems sustainability.
GET 2,002,205.0 0
5,214,461.00
Project Component
Financin g Type
Expected Outcomes
Expected Outputs
Trus t Fun d
GEF Project Financing(
$)
Confirmed Co- Financing($
)
3: Promoting innovative incentive mechanisms to encourage the adoption of SLM/SFM practices in agricultural and forest landscapes.
Technical
Assistance Outcome 3.1 Actors in selected value chains include the SLM approach to enhance resilience and generate socio- economic benefits based on incentives and
improvements in market access mechanisms.
Targets: i) At least 1000 beneficiaries have access to SLM
incentives and mechanisms that
strengthen SLM in value chains, and at least 480 people with strengthened capacities in LDN (disaggregate d by sex and ethnicity) (GEF Indicator #11) iii) At least 10% increase in income generated on the
smallholders?
farm who have incorporated SLM.
Output 3.1.1:
Designed and operational mechanisms and
institutional arrangements for the implementatio n of incentives to promote the adoption of SLM/SFM, mainstreaming gender and interculturality .
Output 3.1.2:
Designed and operational mechanisms and
institutional arrangements to improve market access for
smallholders (men and women) that are part of the SLM approach into the selected value chains.
GET 752,754.00 8,198,815.00
Project Component
Financin g Type
Expected Outcomes
Expected Outputs
Trus t Fun d
GEF Project Financing(
$)
Confirmed Co- Financing($
)
4: Project monitoring and evaluation and lessons learned
Technical
Assistance Outcome 4.1:
Knowledge management, M&E and disseminated lessons learned from the project.
Target:
Project outcomes achieved and demonstrating sustainability
Output.4.1.1:
Mid-term review and final evaluation carried out.
Output:
4.1.2: Overall environmental benefits, co- benefits and costs of SLM/SFM monitored, assessed and lessons learned from the project analysed.
Output:
4.1.3:
Knowledge management outputs, developed and disseminated.
Output:
4.1.4:
Communicatio n strategy developed and implemented to support the expansion of SLM/SFM to achieve LDN targets.
GET 379,131.00 233,782.00
Sub Total ($) 4,213,397.0 0
26,979,798.0 0
Project Management Cost (PMC)
GET 202,813.00 1,348,989.00
Sub Total($) 202,813.00 1,348,989.00
Total Project Cost($) 4,416,210.00 28,328,787.00
Please provide justification
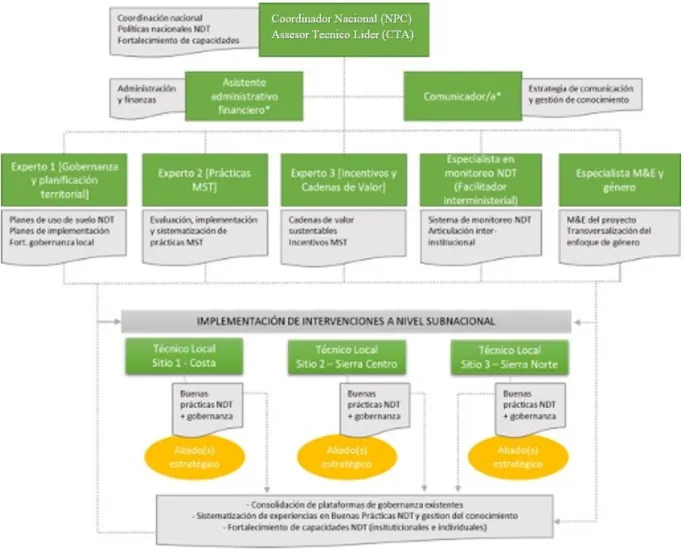
PMC slightly surpasses the 5% of GEF amount in order to provide the Operational Partner (CONDESAN) with the necessary managerial and administrative support to ensure the overall efficient management, coordination, implementation and monitoring of the project. Such support would count, for the most part, on the project coordinator, an M&E specialist and an
administrative/financial assistant.
C. Sources of Co-financing for the Project by name and by type Sources of
Co-financing Name of Co-financier Type of Co- financing
Investment
Mobilized Amount($)
GEF Agency FAO Grant Investment
mobilized
50,000.00
GEF Agency FAO In-kind Investment
mobilized 3,125,000.00
Civil Society
Organization CONDESAN In-kind Recurrent
expenditures 67,852.00 Civil Society
Organization
CONDESAN Grant Recurrent
expenditures
204,148.00
Recipient Country Government
REM Program In-kind Recurrent
expenditures 1,000,000.00
Recipient Country Government
Ministry of Agriculture
and Livestock (MAG) Grant Recurrent
expenditures 46,111.00
Recipient Country Government
Ministry of Agriculture
and Livestock (MAG) In-kind Recurrent
expenditures 18,612,692.00
Recipient Country Government
Ministry of the
Environment and Water (MAAE)
In-kind Recurrent
expenditures
4,545,914.00
Donor Agency GIZ In-kind Investment
mobilized
300,000.00
Recipient Country Government
GADP Manabi In-kind Recurrent
expenditures 77,070.00
Recipient Country Government
GADP Chimborazo In-kind Recurrent
expenditures 100,000.00
Sources of Co-financing
Name of Co-financier Type of Co- financing
Investment Mobilized
Amount($)
Recipient Country Government
GADP Imbabura In-kind Recurrent
expenditures
200,000.00
Total Co-Financing($) 28,328,787.00 Describe how any "Investment Mobilized" was identified
The total amount of investment mobilised is $4,475,000. The investment mobilized for the project considers the investments that will take place in Ecuador in the next years that contribute to the fulfilment of the proposed objectives. FAO Ecuador will provide funds in the order of USD 3,175,000, which will contribute to the achievement of the results of Component 2 (Output 2.1.2): SLM / SFM practices promoted with a focus on gender and interculturality, in the project intervention areas (ecosystems and productive landscapes), which restore vegetation cover, soil organic carbon, water regime and increase the sustainability of productive systems) and, Component 3 (Output 3.1 .2: Mechanisms and institutional arrangements designed and operational to improve market access for small producers (men and women) that integrate the SLM approach in the selected value chains). This funds correspond to the following projects: 1.- GCP / ECU / 101 / EC "Andean Landscapes: Promoting integrated landscape management for the promotion of sustainable livelihoods in the Ecuadorian Andes", will support the strengthening of value chains and processes of restoration and sustainable management of the land in the provinces of Imbabura, Pichincha and Bol?var. 2.-GCP / GLO / 931 / MUL ?Mechanism for Forests and Farms Facility? that supports value chains and initiatives for sustainable land management in the province of Imbabura. 3- GCP / RLA / 224 / SPA ?Reduction of vulnerability of rural women and their livelihoods for a resilient
agriculture? that supports sustainable land management initiatives in the province of Manab?. GIZ will contribute with a co-financing of $300.000 for supporting activities of all the projects?s Components in the provinces of Bol?var, Tungurahua and Chimborazo. This project has complimentary activities on SLM practices, value chains and governance of natural resource management.
D. Trust Fund Resources Requested by Agency(ies), Country(ies), Focal Area and the Programming of Funds Agenc
y Trust
Fund Country Focal
Area Programmin
g of Funds Amount($) Fee($)
FAO GET Ecuador Land
Degradatio n
LD STAR Allocation
4,416,210 419,540
Total Grant Resources($) 4,416,210.00 419,540.00
E. Non Grant Instrument
NON-GRANT INSTRUMENT at CEO Endorsement
Includes Non grant instruments? No Includes reflow to GEF? No
F. Project Preparation Grant (PPG) PPG Required false
PPG Amount ($) 150,000
PPG Agency Fee ($) 14,250
Agenc
y Trust
Fund Country Focal
Area Programmin
g of Funds Amount($) Fee($)
FAO GET Ecuador Land
Degradatio n
LD STAR
Allocation 150,000 14,250
Total Project Costs($) 150,000.00 14,250.00
Core Indicators
Indicator 3 Area of land restored
Ha (Expected at PIF)
Ha (Expected at CEO
Endorsement) Ha (Achieved at
MTR) Ha (Achieved at
TE)
4000.00 4000.00 0.00 0.00
Indicator 3.1 Area of degraded agricultural land restored
Ha (Expected at PIF)
Ha (Expected at CEO
Endorsement) Ha (Achieved at
MTR) Ha (Achieved at
TE)
Indicator 3.2 Area of Forest and Forest Land restored
Ha (Expected at PIF)
Ha (Expected at CEO
Endorsement)
Ha (Achieved at MTR)
Ha (Achieved at TE)
4,000.00 2,000.00
Indicator 3.3 Area of natural grass and shrublands restored
Ha (Expected at PIF)
Ha (Expected at CEO
Endorsement) Ha (Achieved at
MTR) Ha (Achieved at
TE) 2,000.00
Indicator 3.4 Area of wetlands (incl. estuaries, mangroves) restored
Ha (Expected at PIF)
Ha (Expected at CEO
Endorsement) Ha (Achieved at
MTR) Ha (Achieved at
TE)
Indicator 4 Area of landscapes under improved practices (hectares; excluding protected areas)
Ha (Expected at PIF)
Ha (Expected at CEO
Endorsement) Ha (Achieved at
MTR) Ha (Achieved at
TE)
33000.00 24750.00 0.00 0.00
Indicator 4.1 Area of landscapes under improved management to benefit biodiversity (hectares, qualitative assessment, non-certified)
Ha (Expected at PIF)
Ha (Expected at CEO
Endorsement) Ha (Achieved at
MTR) Ha (Achieved at
TE)
Indicator 4.2 Area of landscapes that meets national or international third party certification that incorporates biodiversity considerations (hectares)
Ha (Expected at PIF)
Ha (Expected at CEO
Endorsement) Ha (Achieved at
MTR) Ha (Achieved at
TE)
Type/Name of Third Party Certification
Indicator 4.3 Area of landscapes under sustainable land management in production systems
Ha (Expected at PIF)
Ha (Expected at CEO
Endorsement) Ha (Achieved at
MTR) Ha (Achieved at
TE)
8,000.00 4,750.00
Indicator 4.4 Area of High Conservation Value Forest (HCVF) loss avoided
Ha (Expected at PIF)
Ha (Expected at CEO
Endorsement) Ha (Achieved at
MTR) Ha (Achieved at
TE) 25,000.00 20,000.00
Documents (Please upload document(s) that justifies the HCVF)
Title Submitted
Updated_20210325_Annex_P_Supplementary_Material
Annex_P_Setting_targets_for_GEF_core_indicators
Indicator 6 Greenhouse Gas Emissions Mitigated
Total Target Benefit (At PIF) (At CEO
Endorsement) (Achieved
at MTR) (Achieved at TE) Expected metric tons of
CO?e (direct)
12170020 9596730 0 0
Expected metric tons of
CO?e (indirect) 0 0 0 0
Indicator 6.1 Carbon Sequestered or Emissions Avoided in the AFOLU (Agriculture, Forestry and Other Land Use) sector
Total Target Benefit (At PIF)
(At CEO Endorsement)
(Achieved at MTR)
(Achieved at TE) Expected metric tons of
CO?e (direct)
12170020 9,596,730 Expected metric tons of
CO?e (indirect)
Anticipated start year of
accounting 2020 2021
Duration of accounting 20 20
Indicator 6.2 Emissions Avoided Outside AFOLU (Agriculture, Forestry and Other Land Use) Sector Total Target Benefit (At
PIF) (At CEO
Endorsement) (Achieved
at MTR) (Achieved at TE) Expected metric tons of
CO?e (direct)
Expected metric tons of CO?e (indirect)
Anticipated start year of accounting
Duration of accounting
Indicator 6.3 Energy Saved (Use this sub-indicator in addition to the sub-indicator 6.2 if applicable)
Total Target Benefit
Energy (MJ) (At PIF)
Energy (MJ) (At CEO
Endorsement)
Energy (MJ) (Achieved at MTR)
Energy (MJ) (Achieved at TE)
Target Energy Saved (MJ)
Indicator 6.4 Increase in Installed Renewable Energy Capacity per Technology (Use this sub-indicator in addition to the sub-indicator 6.2 if applicable)
Technolog y
Capacity (MW)
(Expected at PIF)
Capacity (MW) (Expected at CEO Endorsement)
Capacity (MW)
(Achieved at MTR)
Capacity (MW) (Achieved at TE)
Indicator 11 Number of direct beneficiaries disaggregated by gender as co-benefit of GEF investment Number
(Expected at PIF)
Number (Expected at CEO Endorsement)
Number (Achieved at MTR)
Number (Achieved at TE)
Female 2,400 2,338
Male 3,600 3,112
Total 6000 5450 0 0
Part II. Project Justification
1a. Project Description
1) Global environmental and/or adaptation problems, main causes and barriers to consider (systems description)
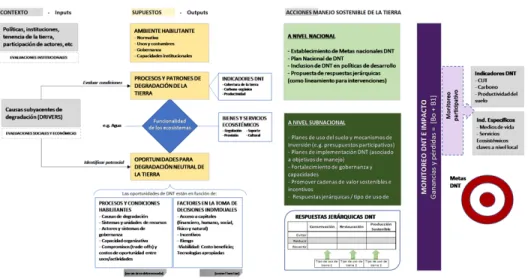
The Land Degradation Neutrality (LDN) as a comprehensive approach to responses to land degradation impact.
1. The United Nations Convention to Combat Desertification (UNCCD) defines land degradation as ?the reduction or loss, of the biological or economic productivity and complexity of rainfed cropland, irrigated cropland, or range, pasture, forest and woodlands resulting from land uses or from a process or combination of processes, including processes arising from human activities? (Article 1f, UNCCD). There are various definitions of land degradation, but in general they include long-term negative trends in the provision of benefits, caused directly or indirectly by processes of anthropogenic origin, and with social and ecological impacts (UNEP 2007; IPCC 2019).
2. The direct causes of land degradation relate to human activities and biophysical processes that have direct impact on the state of natural land capital, the functionality of ecosystems, the goods and services they provide, and human well-being, while the underlying causes correspond to social processes mediated by environmental processes that structure the proximate causes (Geist and Lambin 2002; Cowie et al. 2018). The direct causes of land degradation correspond to anthropic pressures such as unsustainable agricultural and forest practices, the use of unsuitable technologies, and ecosystem conversion, among others. The underlying causes relate to the interaction of demographic, political, institutional, cultural and market dynamics (Eswaran, Lal, and Reich 2001; Cowie et al. 2018).
3. Responses to land degradation processes require diverse strategies linked to direct and underlying causes at different spatial and time scales. For example, structural responses related to changes in the patterns of demand for food, access to education and health, access to water, productive land and other means of production, require public policy transformation processes and coordination between actors from the public-private sector, the academia and civil society that may occur over long- time scales. Interventions regarding capacity strengthening of producers, diversifying rural livelihoods, and promoting sustainable ecosystem, water and soil management practices may influence pressure processes and improve the state of the natural land capital at local scales and immediate time framework (Andersson, Brogaard, and Olsson 2011). This set of responses falls under the broad umbrella of sustainable land management (SLM), which includes the use of land resources (e.g., ecosystems, water, soils, animals and plants), to produce goods and services that meet changing patterns of human needs while ensuring the productive potential and environmental functionality of these resources in the long term (Liniger et al. 2019).
4. Land Degradation Neutrality (LDN) is a comprehensive approach that seeks to articulate SLM responses to reduce pressure on biosphere resources related to increasing demand for food, competition
for land use, and building resilience of productive systems and ecosystems (Cowie et al. 2018). Land Degradation Neutrality is defined as a ?state in which the quantity and quality of land resources needed to maintain ecosystem services and functions and improve food security are stable or increase within specific time and spatial scales? (Decision 3/COP.12, UNCCD 2015).
5. The LDN approach establishes a hierarchy of responses to prevent the degradation of productive lands that are being managed sustainably maintaining their social and ecological functions, to reduce ongoing land degradation processes, and to restore the productive potential and ecosystem functions of degraded land (Cowie et al. 2018). Avoiding land degradation processes is economically efficient and effective, for example, through forest, soil, and water conservation strategies (McConnell, Sweeney, and Mulley 2004; Van Der Hoek 2017). The LDN is one of the goals of SDG 15 of the Agenda 2030 (UN 2015), which seeks to combat desertification, restore degraded lands and soils and strive to achieve a land degradation-neutral world (Goal 15.3).
6. At the core of LDN, the goal is to avoid additional net losses of land-based natural capital in comparison to the conditions found in a specific baseline period. The mechanism for neutrality requires mapping and quantifying a baseline of pre/defined indicators, and monitoring gains and losses relative to the baseline in the future. The key requirement of LDN is that counterbalancing anticipated losses with planned gains in land-based natural capital, must occur within the same land type, such as gains in one land type cannot counterbalance losses in a different land type (Cowie et al, 2018). For a given period of application and biophysical or administrative territorial unit, LDN is achieved if no net loss or gains occur across all land use types.
Global Environmental Significance of the Tropical Andes and its Land Degradation Issues 7. The countries that share the tropical Andes belong to the group of 17 countries classified as megadiverse countries at the global level, and their territory covers two biodiversity ?hot spots?:
Tropical Andes and Choc?/Dari?n/Western Ecuador (Myers et al. 2000). This diversity is connected to the influence of the Andean mountain range, which creates pronounced environmental gradients reflected in naturally heterogeneous landscapes (Young 2011). It is estimated that 44% of the more than 84 million inhabitants of the seven Andean countries live in mountain areas, but this percentage varies from 82% in Bolivia, 80% in Colombia, 56% in Peru, 50% in Venezuela, 46% in Ecuador (Devenish and Gianella 2012). The Andes are home to headwaters that are important for their social, economic and environmental roles, so the sustainable management of Andean ecosystems and productive landscapes is important for downstream populations (McClain and Naiman 2008; Ponette- Gonz?lez et al. 2015). Landscapes in Andean countries have long histories of human settlement. Pre- Hispanic productive systems showed remarkable characteristics of adaptation to the diverse agro- ecological conditions associated with coastal areas, the Andean mountain range, and the Amazon plain.
Some of these adaptations have to do with output exchange networks of multiple altitudinal strips, complex irrigation systems and terraced crops, use of rigs, farming systems on the Amazon river banks, among others (Denevan 2001).
8. The ecosystems of the tropical Andean countries are characterized by their biological diversity and fragility, and the importance of the ecosystem goods and services they provide to local populations.
Tropical mountains have been identified as particularly sensitive and vulnerable environments to the
combined effects of climate change and land cover/land use change (Chakraborty 2019). Impacts on the composition and structure of Andean ecosystems related to upward migration of species following change in bioclimatic conditions have been documented, with implications for the provision of ecosystem goods and services at local, regional and global levels (Fadrique et al. 2018). Similarly, Andean production systems face particular challenges related to difficult agroecological conditions for production; asymmetric links between producers and local, national and international markets; changes in local organizational logics, persistence of political, social and economic processes that generate poverty cycles, among others (Stadel 2008). Paradoxically, as in other developing countries, rural populations that produce food are the poorest, and lack of access to adequate food (Schindler et al.
2015), with particularly critical impacts on women, girls and boys (Tognelli et al. 2016).
9. The main direct cause of land degradation in the Tropical Andes derives from unsustainable agricultural practices and interventions, which rely on the conversion and degradation of natural ecosystems to extract short-term goods and services (Pena et al. 2020; Santib??ez and Santib??ez 2007). Young mountain ranges, like the Andes, with their steep slopes and surface materials that move freely, are prone to large volumes of soil and rock being washed away from stream banks and ravines.
However, land erosion that occurs in the Andes is largely accelerated by farming activities. Rates of soil loss are particularly high on small farms (smallholdings) with erosive crops (e.g. maize) and where erosion control practices, when applied, are rudimentary (Southgate and Whitaker 1992).
10. Land degradation processes in Andean countries reflect the diversity of ecological and productive conditions in these countries. For example, deforestation of lowland tropical forests alters the continuous contribution of vegetation to soil organic carbon, increasing the risk of water erosion and subsequent loss of fertility. In the area of coastal Xeric deserts and scrublands, farmland clearance requires irrigation, which increases the risk of soil salinization. In paramo or puna ecosystems, there is soil and water contamination in vegetable crops (e.g. tubers) with intensive use of fertilizers, biocides and other agrochemicals (FAO and ITPS 2015). In the tropical Andes, high biological diversity is associated with high cultural diversity. Degradation processes affect the cultural identity of local communities, especially indigenous peoples, and can lead to the loss of traditional local knowledge (IPBES 2018).
The global environmental problem: Land degradation in Ecuador
11. In Ecuador, land degradation is a long-standing problem that has been documented for several decades. The Land Degradation Neutrality (LDN) Target Setting Programme implemented in 2017 with the support of the Secretariat and the Global Mechanism of the United Nations Convention to Combat Desertification (UNCCD) characterised the following direct causes of land degradation in Ecuador 1) deforestation and removal of natural vegetative cover, 2) degradation through overgrazing, 3) inadequate management of crops and pastures, 4) over-exploitation of vegetation for domestic use, 5) urban development and infrastructure, 6) other causes related to mining and industrial activities, natural events and water resources contamination. The underlying causes identified were: 1) consumption patterns and domestic demand, 2) poverty, 3) lack of access to high-quality education, 3) governance and institutions, and 4) other causes related to demographic processes (including changes in the availability of rural labour) and climate change.
12. Soil degradation: De Noni and Trujillo (1986a, 1986b) assert that the agricultural practices introduced by the Spanish colonizers had a direct consequence in accelerating erosion[1]1, especially in mountainous areas where the elements of the natural environment, such as climatic conditions, slope, soils, and vegetation, confer a condition of fragility to the Andean ecosystems (De Noni and Trujillo 1986a). In their study, carried out in the 1980s, it was estimated that approximately 48% of continental Ecuador was affected by erosion processes, mainly along the outer faces of the Andes and the sides of the intermountain valleys (De Noni and Trujillo 1986b; Southgate and Whitaker 1992).
13. The greatest soil loss occurs in the coastal hills of Manab? province and along the agricultural border at the north of the coast and east, while erosion is particularly severe in the highlands. ?In some areas of the highlands, once the arable soil has disappeared, the land is abandoned by the farmers and erosion continues on the subsoil. The quantitative results obtained in 50 m2 runoff plots in Hoya de Quito (Ilal? and Alangas?), allows to predict that, throughout his life, a peasant can see the loss of up to one meter of the soil on his property? (De Noni and Trujillo 1986b: 6). In the Coast, in the 1980s, De Noni and Trujillo (1986b) already documented areas of active erosion, either by runoff, as in the Santa Elena Peninsula in the Pedro Carbo canton, or by mass movements in Manab?, in the Jipijapa - Portoviejo depression, Chone - Eloy Alfaro watershed and the canyon flanks of the Esmeraldas River.
14. Soil erosion in Ecuador causes land productivity to decrease. With fertilizers, farmers try to partially make up for the impact of erosion on yields. However, after cumulative land degradation exceeds a threshold, crop production often becomes economically unviable. In the highlands, that threshold is quickly reached on the slopes surrounding the intermountain valley bottoms, with over 341,000 hectares (60%) of farmland abandoned or converted to grasslands since the mid-1960s (Southgate and Whitaker 1992: 798).
15. To understand the current processes and patterns of land degradation, it is necessary to understand the interactions between land use systems and bioclimatic conditions. For example, Podwojewski (2002) documents the effects on soil properties to the northwest of the Chimborazo volcano, where a long history of overgrazing, especially sheep, has led to converging patterns of degradation in a gradient from dry to wet paramo. The degraded areas have lost plant species, the soil organic carbon has decreased by 40% to 50%, and the water retention capacity has decreased by 75%, compromising the water regulation function of the paramo.
16. The abandonment of land is a problem that worsens the degradation processes. Harden (1996), based on 109 experiments with field rainfall simulation in the Paute river watershed in the highlands, demonstrated that abandoned or fallow land represents an even greater risk of organic matter loss and erosion due to increased rapid runoff, compared to productive land. The continued degradation of abandoned or fallow land in the study area in the southern Andes of Ecuador relates to unsustainable grazing practices that continue after agricultural use that do not allow vegetative cover to regenerate, leading to accelerated erosion and further land degradation (Harden 1996: 276). Soil erosion is a problem that directly affects farmers, especially small-scale farmers who only have access to fragile land for their productive activities. Other negative externalities relate to the sedimentation in water
infrastructure. In the case of the Litoral, plant nutrients attached to eroded soils contribute to water quality problems in reservoirs (Southgate and Whitaker 1992).
17. Vegetation: The latest national assessment of land degradation estimates that a 48% of natural land use systems are moderately degraded and a 17% are severely degraded. In the case of transformed land-use systems, 61% show moderate degradation and 17% show severe degradation. In total, 47% of the surface of continental Ecuador (i.e., 12,049,390 ha) shows some degree of degradation[2]2.
18. In 2016, native forest covered 50.73% (12.6 million ha), farmlands 35.88% (8.9 million ha) and shrub and herbaceous vegetation 9.48% (2.4 million ha) of the surface of continental Ecuador (MAE 2018). Native forest decreased from 13.6 million ha to 12.6 million ha in the period 2000 - 2016, with annual national deforestation rates of 0.57%/year, 0.36%/year and 0.48%/year in the periods 2000- 2008, 2008-2014 and 2014-2016, respectively. Farmland has increased from a 32.77% of the national territory in 2000 to a 35.88% in 2016 (MAE 2018).
19. The processes to convert areas of natural vegetation to crops and grasslands have been one of the main direct causes of the impact on the remaining ecosystems. Recent deforestation processes at the national level result from the interaction of different direct and underlying drivers, which vary in terms of relative importance in different regions of the country. Castro et al. (2013) identified the demand for agricultural inputs for domestic consumption and the production of permanent crops (e.g. cocoa, bananas, palm) for export as the main causes of deforestation at the national level in the period 1990 - 2008. These underlying causes are, in turn, related to more structural and long-term changes in land access and tenure patterns, rural-urban migration, and intensification of farm production (Castro et al.
2013). In the cordillera and semi-dry valleys of central and southern Manab? and Santa Elena, the main direct cause of deforestation in the 2000-2008 period was the expansion of grasslands and flint maize crops. In contrast, in the north of the Costa region the main direct causes were the expansion of permanent crops, especially African palm (Castro et al. 2013).
20. Habitat loss and fragmentation associated with ecosystem conversion produce impacts on the composition of biotic communities at different scales (Cisneros-Heredia et al. 2010; Tapia-Armijos et al. 2015). Ecosystem conversion affects ecosystem functions related to important ecosystem services, such as carbon sequestration or water regulation. The Land Use, Land Use Change and Forestry (LULUCF) sector represents the second largest source of net emissions at the national level, with a 25% after the energy sector (MAE 2017).
21. Water: The ecosystems conversion and degradation compromises the capacity at local and landscape scales for water provision and regulation (Ponette-Gonz?lez et al. 2015). The specific sources of impact differ according to the type of ecosystem and management characteristics of the existing productive systems in the watersheds. For example, cloud forests perform water regulation functions related to the capture of atmospheric humidity and horizontal rain. In areas with high seasonality of rainfall, such as dry forests on the coast, the contribution of fog water in dry periods can exceed the contribution of rain (Tobon 2009).
22. Afforestation of non-forest ecosystems and conversion to agricultural systems affects the capacity of watersheds to provide water. Conversion to cropland usually results in watersheds having more acute discharge peaks and lower dry season baseflow. This translates into lower regulation capacity of watersheds over time. Afforestation, especially in the case of paramo watersheds with exotic species, reduces water generation in the watersheds (Ochoa-Tocachi et al. 2016).
23. A direct link between land cover/land use patterns and water quality has been documented. For example, Damanik-Ambarita et al. (2016) characterized a direct influence of land use on water quality in the Guayas River watershed. Areas with a prevalence of natural vegetation had better quality conditions than areas of agricultural or urban land use. The use of pesticides in agriculture is also an important source of water pollution and impact on aquatic biotic communities (FAO 2011). A better characterization of the impact of pesticide and other agrochemicals used on aquatic ecosystems in Ecuador has been identified as a priority research line (Damanik-Ambarita et al. 2016).
24. Climate Change: Climate change is an additional pressure factor for land, both at national and local levels. Some available climate change scenarios (MAE, 2017) show that by 2040 the average rainfall could increase by 4 to 10%. However, unstable rainfall patterns add uncertainty about the availability and reliability of water for crops and other uses. It is estimated that the average temperature will increase (from 0.66 to 0.87?C) and therefore, water use and evapotranspiration will increase, and these landscapes could become more vulnerable to drought.
25. In addition, the increase in average temperature will affect the carbon storage capacity of soils and reduce the water regulation capacity of the soil, increase the risk of soil erosion and decomposition of organic matter (Buytaert et al., 2011; Urbina & Benavides, 2015; Hribljan et al., 2016). The resulting changes in these ecosystems could threaten carbon stability in the paramo and high Andean wetlands, transforming them from a long-term carbon sink to a source of emissions.
26. On the other hand, it has been documented that climate change is causing changes in the distribution of flora and fauna species (Fadrique et al. 2018) with important implications for agricultural production systems. Changes in agroecological conditions have also been documented in Andean productive systems, linked to local perceptions of increased vulnerability to natural hazards (e.g. landslides), extreme weather events and changes in precipitation patterns (L?pez, Jung, and L?pez 2017). Changes in crop distribution, pest?s incidence because of climate change and variability, are already creating local adaptation needs. For example, on the slopes of the Cotacachi volcano in Imbabura province, there has been an altitudinal migration of 200-300 m in maize crops, accompanied by producers? efforts to obtain seeds that better adapt to the new conditions (Skarb? and VanderMolen 2016).
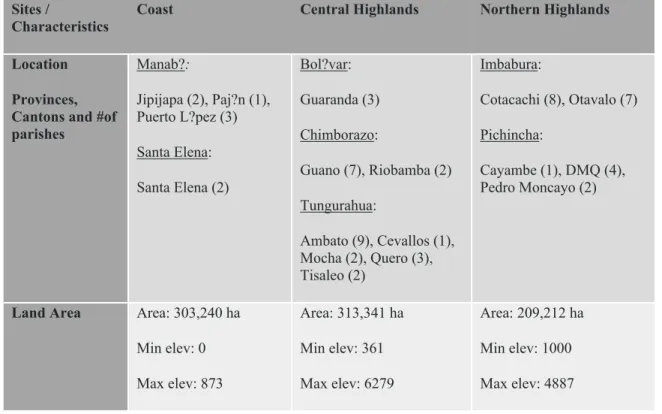
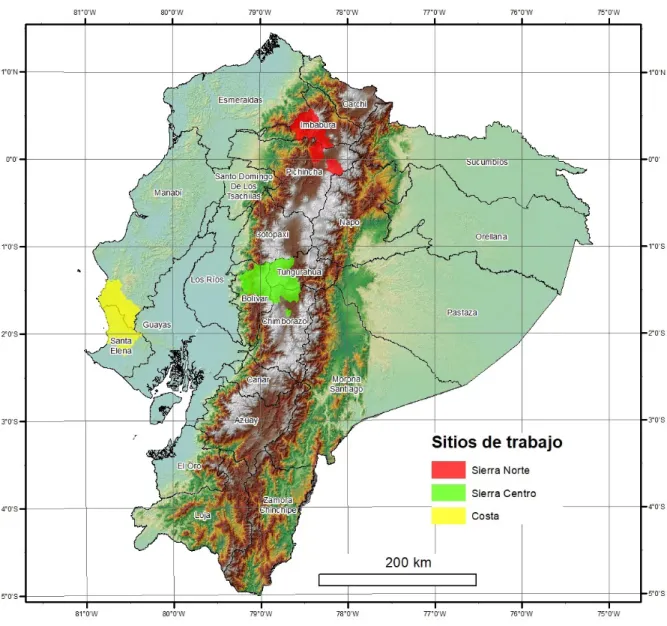
27. The project will intervene in three intervention areas: Costa, Sierra Centro and Sierra Norte, which are described in detail in section 1.b and Annex O. During the project design phase, analysis and consultations with local actors were carried out to identify the main characteristics of the land degradation in each site, and which are reflected in Table 2 of the aforementioned section.
Remaining barriers
Barrier 1: Lack of information and limited capacities for adequate monitoring of progress towards LDN at different scales
28. During the Conference of the Parties (COP) 12 of the UNCCD held in Ankara in 2015, the Parties agreed that the Land Degradation Neutrality (LDN) approach would integrate into the national plans to combat land degradation and that the voluntary LDN targets would be selected by the countries themselves. Ecuador, as UNCCD signatory country, has committed to establish voluntary LDN targets and monitor key indicators at national level such as (i) land cover and land cover changes (ii) land productivity and (iii) soil organic carbon levels. However, the necessary adjustment of LDN targets has not been fully implemented by the country due to the lack of knowledge and needs to strengthen institutional capacities to monitor national baseline indicators.
29. In recent years, there have been important advances in other monitoring processes, such as the National Forest Monitoring System (NFMS) and the National Biodiversity Monitoring System (NBMS), as well as the desertification and drought modelling processes implemented by the Ministry of the Environment and Water (MAAE) and the Ministry of Agriculture and Livestock (MAG) respectively. Institutional capacities must be strengthened to include these initiatives into an indicator monitoring system to assess the LDN progress at the national level. Some priority issues include the need for methodological and management standards and reports on soil organic carbon and land productivity.
30. In addition, at national and sub-national levels there is a lack of knowledge regarding: (i) proximate and underlying causes of land degradation; (ii) impacts of degradation processes on ecosystem services and food security; and (iii) interactions with the effects of other global environmental change processes, especially climate change. Similarly, greater conceptual integration is required to monitor the combined impacts of land degradation on other key ecosystem services, especially hydrological services (e.g., regulation, sediment control, maintenance of water quality).
31. At local scale, in Ecuador there is a lack of knowledge about the effectiveness and impact of Sustainable Land Management (SLM) and Sustainable Forest Management (SFM) practices, conservation and restoration of ecosystems, on biophysical and economic systems. SLM/SFM practices have been implemented throughout several projects and in several regions of the country; however, these practices are not being validated, registered or monitored because there is no monitoring strategy in Ecuador to create a robust baseline information, which can later be synthesized and analysed at broader scales (e.g., landscape, watershed, region, national). This restricts the possibility to replicate and scaling these practices and include them in public policies.
Barrier 2: Weak institutional framework to include comprehensive LDN approach and lack of effective inter-sectoral and multi-level coordination mechanisms
32. Despite country commitments under the UNCCD and LDN framework, there is no institutional regulatory framework to comprehensively addresses land degradation. Existing institutional and legal frameworks do not address land degradation in all sectors, nor do they consider its effects on food security and the maintenance of ecosystem services. Agricultural policies have traditionally emphasized short-term increases in production and productivity, without including a systemic
sustainable management vision. This affects land degradation processes, which affects biodiversity, food security and rural communities? resilience, contributes to the emission of Greenhouse Gases (GHG) from the Agriculture, Forestry and Other Land Use (AFOLU) sectors, and prevents the realization of socioeconomic benefits related to the maintenance of key ecosystem functions and services. In addition, no mechanisms have yet been established for cross-sectoral work, promoting a common and joint approach aimed at preventing, reducing and reversing degradation processes.
Collaboration between sectors remains limited or ineffective, especially in the key sectors of environment and agriculture. In practice, the promotion of agricultural productivity is usually addressed separately from key ecosystem services, especially water provision and regulation, maintenance of soil fertility, pollination, and so on.
33. The establishment of LDN targets at the national level and the implementation of actions at different levels lacks a solid institutionality that is exemplified by 1) the absence of a common conceptual framework adopted by competent institutions to guide the implementation of joint and comprehensive actions, 2) the current regulatory and policy framework offers some opportunities to enhance LDN actions, however, there is a high level of dispersion in its objectives and proposals for actions under strictly sectoral approaches, 3) limited institutional capacities of the various actors to design, plan, implement and monitor LDN/SLM initiatives, 4) a significant reduction in budget allocations, 5) emerging mechanisms that connect the competent bodies in planning, implementing, monitoring and assessing SLM practices (i. e. horizontal coordination), and 6) weak mechanisms of articulation between governance levels (i.e. vertical articulation), which means that, in many cases, decentralized autonomous governments act independently and results have no possibility to be scaled up or replicated.
34. In the last decade, the Central Government has promoted national economic incentive programmes to encourage restoration and reforestation as a means of alleviating the high rates of deforestation nationwide. The National Forest Restoration Programme (NFRP) for conservation purposes and the Reforestation Programme for commercial purposes, promoted by the MAAE and MAG respectively, were developed independently, without common guidelines, aimed at different objectives, and implemented according their own exclusive institutional arrangements. Despite having any number of hectares under intervention, both programmes had difficulties regarding management models, limitations of fiscal resources to maintain investments and, in some cases, lack of actions continuity by the beneficiaries. These two national incentive programmes partly exemplify the weak institutionality that exists in the country which has conditioned the implementation of actions under a common plan or with more effective inter-institutional coordination mechanisms. For example, many lessons about the conditions and institutional arrangements that influenced programmes success can be learned from these national experiences; however, so far, no joint process exists between ministries or the stakeholders that would capitalise on these experiences.
35. Finally, Ecuador has not yet established its LDN objectives. Given that it is a multi-sectoral approach, it is required that government institutions, the academia, civil society and local actors, engage in a comprehensive, multilevel and intersectoral technical and political process. The progress made by the Core Group on Land Degradation Assessment, in the framework of the GEF/FAO project
?Decision Support for the Integration and Scaling of Sustainable Land Management?, is a technical
platform of multiple decision makers that could be improved and made official, defining clear roles for the institutions involved, to fill this institutional gap for the establishment and implementation of the LDN objectives.
Barrier 3: Weak planning frameworks and governance mechanisms that do not include SLM for the achievement of LDN
36. The different administrative levels, sectors and planning tools are not coordinated in a way that they can support the LDN approach by aligning LDN/MST processes with land use planning. The LDN/MST approach has the potential to integrate actions for the maintenance and recovery of ecosystem services, responses to climate change, promote sustainable production systems, combat biodiversity loss, among other objectives, which need to be coordinated among different levels of governance.
37. There is a lack of institutional (central and local government) and community (local communities, NGOs, cooperatives, farmers' associations) capacities to include and implement SLM practices, and to establish and monitor progress in the attainment of LDN. National and local planning systems lack LDN/SLM criteria and collaboration between sectors remains limited (even at the local level).
38. The Technical Secretariat for Planning, Planifica Ecuador, provides an operational framework for spatial planning in Ecuador. The instruments for local planning are the Development and Land Management Plan (PDOT) formulated at all administrative levels (local, municipal, regional, national).
On the other hand, in recent years, efforts have been made to include ecological and economic zoning concepts in local planning instruments. The MAG has developed an agro-ecological zoning tool as part of the Agricultural and Public Information System (SIPA) to guide territorial planning at the local MAG offices. The MAAE has developed guidelines to include climate change and disaster risk management into land management processes. Both tools have relevant elements for SLM/LDN planning, but there are still no governance mechanisms to facilitate their specific articulation in the PDOT. The PDOTs identify the environmental and productive problems of the provinces and have policies, programmes and projects in which SLM practices can be more effectively mainstreamed under a LDN approach.
Barrier 4: Limited transfer and dissemination of technologies, knowledge and practices that prevent and reverse land degradation processes.
39. Overgrazing, unsustainable crops and grasslands management, and the conversion and overexploitation of forests and other ecosystems are the most important direct causes of land degradation in Ecuador and in the project intervention areas. In addition, climate change exacerbates the pressure on ecosystems and productive landscapes due to changes in temperature, rainfall and more frequent extreme weather events.
40. In addition to structural barriers related to inequity in access to productive land, dependence on unsustainable agrochemicals-intensive production practices, technical assistance and training programmes, both at central and local government levels, there are various other limitations. The
initiatives that have included notions of sustainable land management are few and have a marginal effect compared to projects that still encourage a productive model based on monoculture and use the so-called technological kits, a model linked to that of the green revolution.
41. While recent developments have increased the knowledge to combat land degradation, SLM concepts are mostly interpreted as soil fertility management, erosion control and increased use of agricultural inputs to improve productivity of specific crop and livestock activities, rather than sustainable and resilient production systems, considering a landscape approach and multiple social, economic and environmental objectives.
42. On the other hand, although there is an organic production regulation and sustainable production practices are encouraged, the application of these principles is still considered under the monoculture model, which increases the incidence of pests and, therefore, the need to apply chemicals to combat pests resistant to organic products.
43. In addition, although several SLM practices have been implemented at a pilot level, they have not been scaled up through technical packages and recommendations adapted to the specific ecosystems and particularities of each territory. The implementation of universal recipes - without these adaptations to the context - reduces the impact of agro-ecological and SLM practices.
44. The predominance of technical assistance based on unsustainable models stems from the fact that most professional careers still teach a compartmentalised agricultural production model, in which each farm subsystem is considered separately, and based on the principles of the green revolution. While some professional careers are already including notions of organic production, SLM and, to a lesser extent, agro-ecological principles in the syllabus, these initiatives are still marginal. In general, the personnel available for technical assistance is limited, and most of them teach techniques and principles based on a conventional model that promotes monoculture and the use of chemicals without a comprehensive management view between production systems and interrelations at the landscape - Agricultural Unit (AU) - plot level.
45. On the other hand, workshop methodologies of technical assistance programmes, have proven to be ineffective in passing on knowledge. The practical methodologies, the exchange of experiences or the farmer-to-farmer model, which has proven to be successful, have also been applied to a lesser extent. Hence, the impact of efforts to train in SLM practices is even more limited.
46. At the policy level, this situation is reflected in the inadequate design of agricultural support programmes and the lack of a harmonised agri-environmental strategy and financing mechanisms to promote SLM/SFM. As a result, production strategies focus on short-term productivity benefits and do not include the implementation of SLM practices in productive landscapes to maintain a variety of ecosystem services and restore degraded lands.
Barrier 5: Lack of appropriate incentives to promote sustainable land management practices
47. The Ecuadorian State, through public institutions, has not generated enough incentives to explicitly favour the SLM/SFM. There are specific programmes that promote SFM, but at the
agricultural level, non-harmonised public policies sometimes create perverse incentives that promote unsustainable practices. However, various State incentives have the potential to favour the adoption of sustainable practices if they are properly articulated with local sustainable land management initiatives promoted by local governments or civil society. Among the incentives provided by the State are the access to financing for seeds and inputs, the land allocation programme, the production security system (AgroSeguro), the access to infrastructure and equipment for collection and processing, the incentives for forest restoration and the promotion of commercial plantations and incentives for forest conservation, among others. This demonstrates that there is a political will to design and implement various types of incentives relevant to the LDN, but in a poorly articulated manner.
48. Small rural producers with family farming economies are characterized by low collateral, low profitability of their AUs, and high vulnerability to market shocks, natural disasters and the effects of climate change. This hampers the access to financial services and financial risk management mechanisms such as insurance. Added to this, there are few credit lines in the country that promote SLM/SFM for small rural producers. Small farmers have limited access to extension and financial services in the project intervention areas; only a 5.2% of agricultural producers have access to services through credits from private, public or popular and supportive banks (INEC, 2020). The lack of access to financial capital is a critical bottleneck, along with labour limitations and insecurity of land tenure, for the adoption of good practices for sustainable land management by small producers (cf. Medina 2017). Despite a growing interest among financial institutions to include sustainability criteria into their operations, formal financial services have a limited geographical reach in rural areas and their products and services are mostly based on conventional approaches.
49. Financial institutions in Ecuador lack the risk assessment capacities for non-traditional sectors related to the peasant family economy; they do not have systems to monitor and verify social and environmental impact indicators and have limited knowledge to offer green financial products to land users who are willing to invest in sustainable environmental practices and have difficulties in the access to financial services (e.g., lack of collateral). Some private financial institutions offer credit lines for the environmental sector. Not all the institutions include projects to favour sustainable land management within these lines but are mainly focused on industrial energy efficiency or cleaner production projects, and on energy-efficient household equipment. As regards the public sector, BanEcuador has made incursion into green financing with a credit line aimed at sustainable livestock.
The popular and solidarity sector is entering this market, but with a limited coverage. On the other hand, it has been identified that there are non-profit microfinance institutions which finance or collaborate in the implementation of financing mechanisms for sustainable initiatives.
50. On the other hand, there is limited access to differentiated markets that encourage the adoption of long-term sustainable practices by agricultural producers. There are weak partnership and marketing capacities. This generates value chains with low value addition and without sustainable management, which does not allow the creation and maintenance of long-term stable trade relations. Additionally, agrifood value chains have not been assessed throughout their different links and entire life cycle (e.g., inputs, production, transport and processing). Commercial enterprises and certification agencies in the country point out that there is a growing demand for products with organic certification for national supermarkets and a high demand for export markets; they also point out that other sustainability
certifications requested for export are those of Fair Trade and Small Producers. Trade certifications have an annual cost and require some level of producers? organization such as an internal control system, a traceability and accounting system and daily records of activities; sometimes organizations may require technical support. Certifications promoted by the MAG (AFC seal for family farming) and the MAAE (?Free from Deforestation? certification) are an alternative that may be used on the value chain products promoted in the project, to communicate the environmental value of the products to the consumer.
51. At sub-national level, there are marked differences in local government capacities and priorities with respect to SLM/FSM. There are some experiences and local initiatives in which decentralized autonomous governments have promoted and articulated innovative mechanisms (such as water funds) to get adequate SLM financing in their localities. The challenge is to expand their coverage, enhance their replication in other contexts and achieve financial and institutional sustainability.
2) Baseline scenario and associated projects Institutional Framework
52. In Ecuador, two national public institutions are key to sustainable land management and to foster the LDN approach: The Ministry of Environment and Water (MAAE) and the Ministry of Agriculture and Livestock (MAG).
53. As the environmental authority, the MAAE is entitled to: i) issue the national environmental policy; ii) establish norms and control and follow-up mechanisms for the conservation, sustainable management and restoration of biodiversity and natural heritage; iii) grant and control environmental authorizations according to its competencies, and iv) create, promote and implement environmental incentives. The MAAE has two undersecretariats closely related to the LDN: the Undersecretariat of Climate Change and the Undersecretariat of Natural Heritage. Also, the MAAE is responsible of the administration of the Unified Environmental Information System (SUIA), which articulates information on the state and conservation of the environment.
54. The MAAE through the Undersecretariat of Climate Change and the National Climate Change Adaptation Directorate is the technical focal point of the UNCCD. The Ministerial Decree 045 of April 2014 establishes the National Authority of Desertification, Land Degradation and Drought, presided by the Minister of the Environment and coordinated by the Undersecretariat of Climate Change. Its mandate is to support the implementation of the country?s commitments under the UNCCD trough: 1) creation of the legal framework needed to combat desertification and land degradation and promote sustainable land management, 2) coordinate efforts to generate and disseminate key knowledge items, 3) support Decentralised Autonomous Governments (DAGs) in the design and implementation of sustainable land use management initiatives to combat desertification and land degradation, and 4) promote synergies with the UN Conventions that address climate change, biodiversity, and other international instruments related to desertification and land degradation.
55. By Executive Decree No. 1007, the Water Secretariat and the Ministry of the Environment merged on 4 March 2020, and the MAAE took on the competences, powers and processes of the Single