Total economy
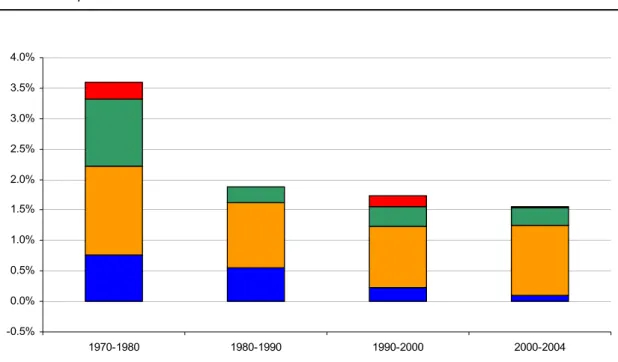
Growth of GDP per capita
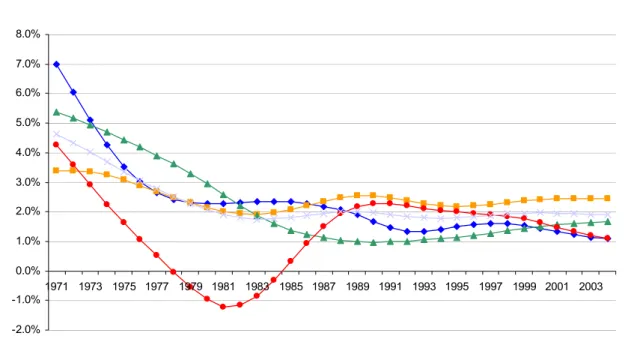
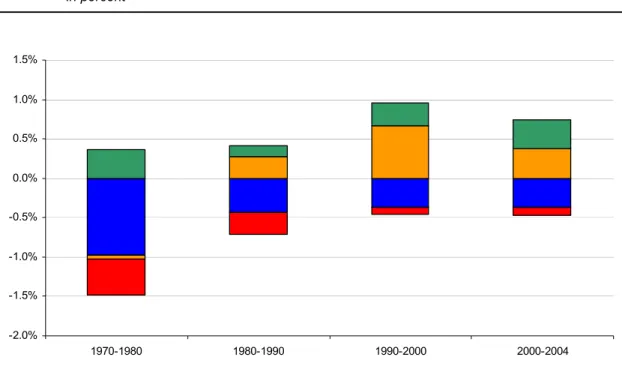
GDP per capita growth is one of the most widely used indicators of economic performance and provides an easy-to-understand picture of living standards. The growth in labor utilisation, which was strongly negative in the 1970s and the first half of the 1980s, has turned positive since the late 1980s. The largest increase in labor utilization occurred in the second half of the 1990s.
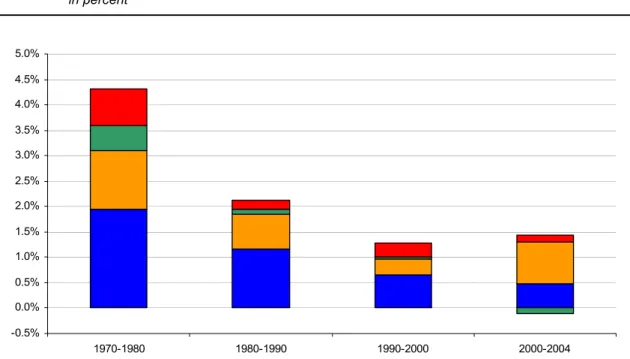
However, between 2000 and 2004, labor productivity increased again by an average of 1.3% per year, which led to a stabilization of the trend.
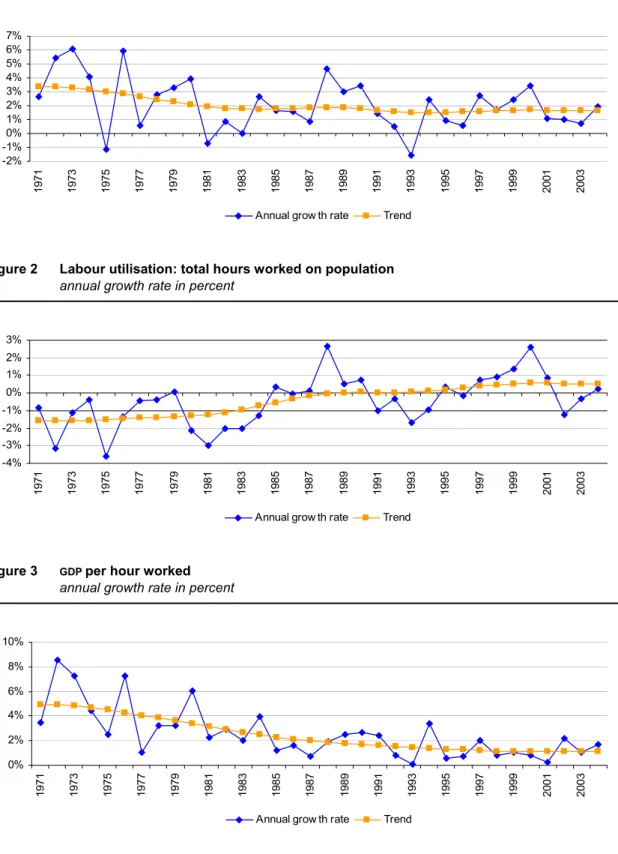
Labour utilisation
Labour productivity
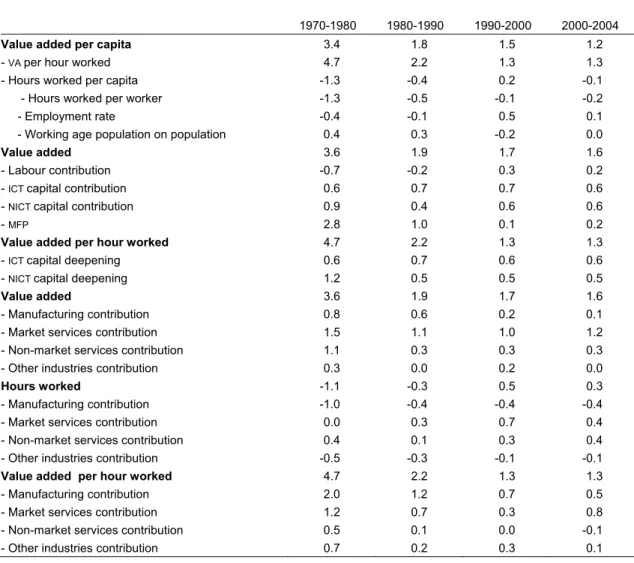
GDP growth decomposition
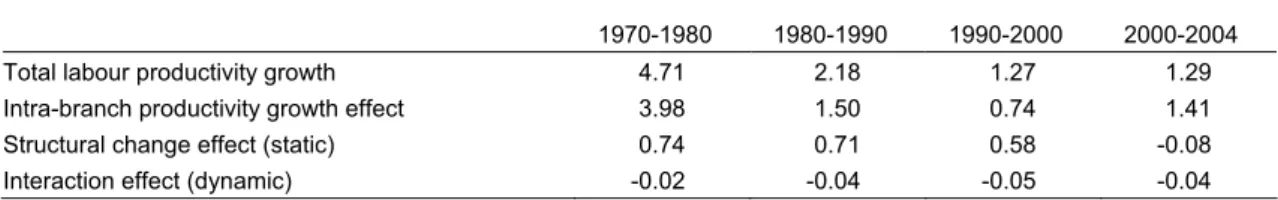
Decomposition of labour productivity growth
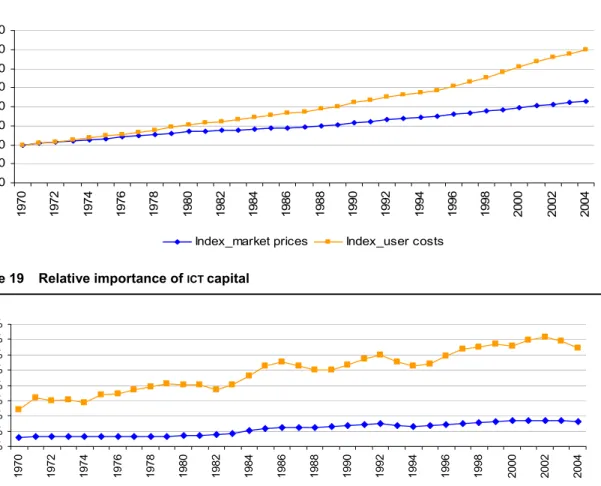
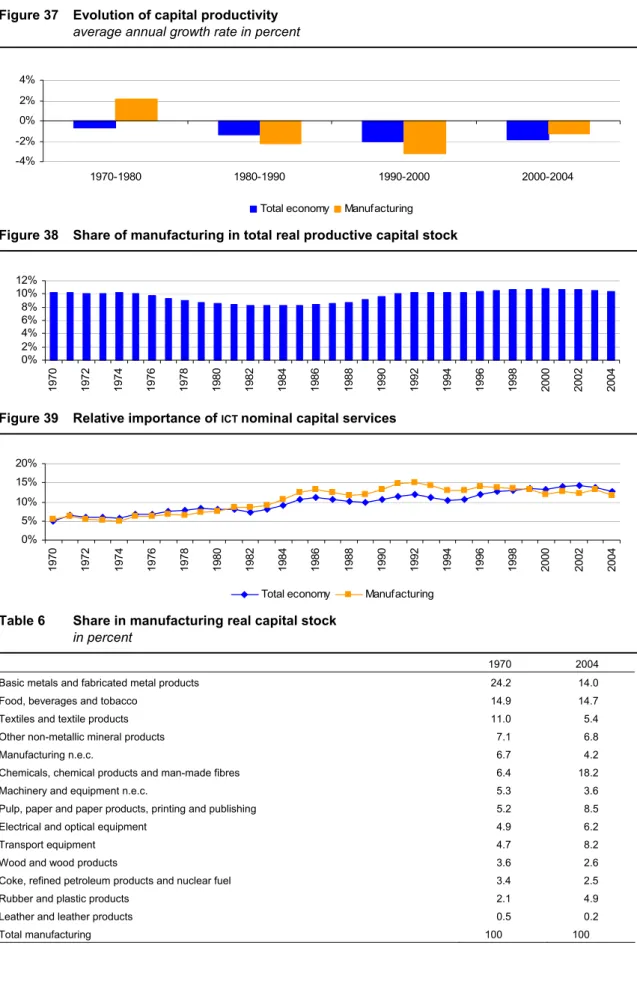
Capital productivity and ICT capital
Structural changes in activities
Industry contribution to total value added growth
Note: the contributions of industries to the average annual growth of aggregate value added are calculated at the level of industry A31. The weights reflect the average weight of each industry in total value added at the beginning and end of the period covered. Manufacturing Market services Non-market services Other industries Total economy Note: average annual growth rates are corrected for the business cycle, using the Hodrick-Prescott filter.
Industry contribution to total labour input growth
Notes: Industry contributions to annual average labor input growth were calculated at industry level A31. The weights reflect the average of each industry's share of total hours worked at the beginning and end of the period covered. Notes: Annual average growth rates have been corrected for the business cycle using the Hodrick-Prescott filter.
Industry contribution to labour productivity growth
Notes: the industry's contribution to the annual average growth in labor productivity (value added per hour worked) is calculated at the A31 industry level. This contribution can be negative as it is calculated as the difference between weighted value added and weighted labor force growth. A labor-intensive, low-growth industry can thus have a negative effect on overall growth in labor productivity.
Manufacturing Market services Non-market services Other industries Total economy Notes: annual average growth rates of value added per hours worked have been adjusted for the business cycle.
Shift-share analysis of labour productivity growth
LPLP
Manufacturing
- Relative importance of manufacturing
- Value added growth decomposition
- Decomposition of labour productivity growth
- Capital productivity and ICT capital
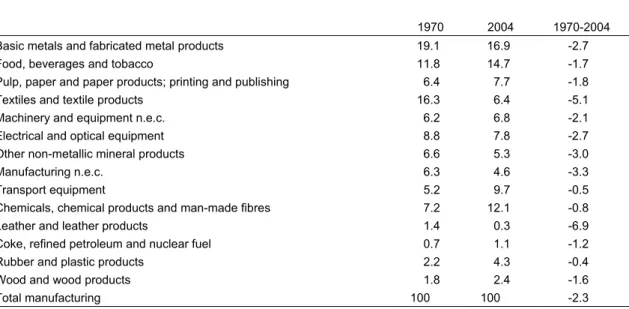
- Structural changes in manufacturing
- Industry contribution to value added growth in manufacturing
- Industry contribution to labour input growth in manufacturing
- Industry contribution to labour productivity growth in manufacturing
Therefore, the total contribution of manufacturing to total output is greater than the apparent one obtained from the share of manufacturing value added in total value added. Labor productivity growth in manufacturing helped moderate value-added price increases and led to much slower growth in the manufacturing deflator than the growth recorded by the total economy deflator. As applied to the total economy, the growth accounting model can be used to explain value added and productivity growth in manufacturing.
In contrast to labour, capital and MFP have always contributed positively to real value added growth in manufacturing. As expected from respective movements in real value added and in hours worked, the annual average growth rate of labor productivity in manufacturing was always higher than for the entire economy over the period 1970-2004. The share of chemicals in the total manufacturing value addition increased from 3.6% to 19.5% over the same period.
However, the contribution of the chemical industry to the growth of added value in manufacturing activities has declined significantly in the recent period. In addition, some manufacturing industries reduced or even had a negative impact on the growth of the aggregate value added of manufacturing activities in the second half of the entire considered period. The negative contribution of the former industry contrasts with its leading role in the creation of total value added in the 1970s.
Note: the contributions of industries to the average annual growth of aggregate value added are calculated at the level of industry A31. The weights reflect the average weight of each industry in total value added at the beginning and end of the period covered.
Market services
- Relative importance of market services
- Value added growth decomposition
- Decomposition of labour productivity growth
- Capital productivity and ICT capital
- Structural changes in market services
- Industry contribution to value added growth in market services
- Industry contribution to labour input growth in market services
- Industry contribution to labour productivity growth in market services
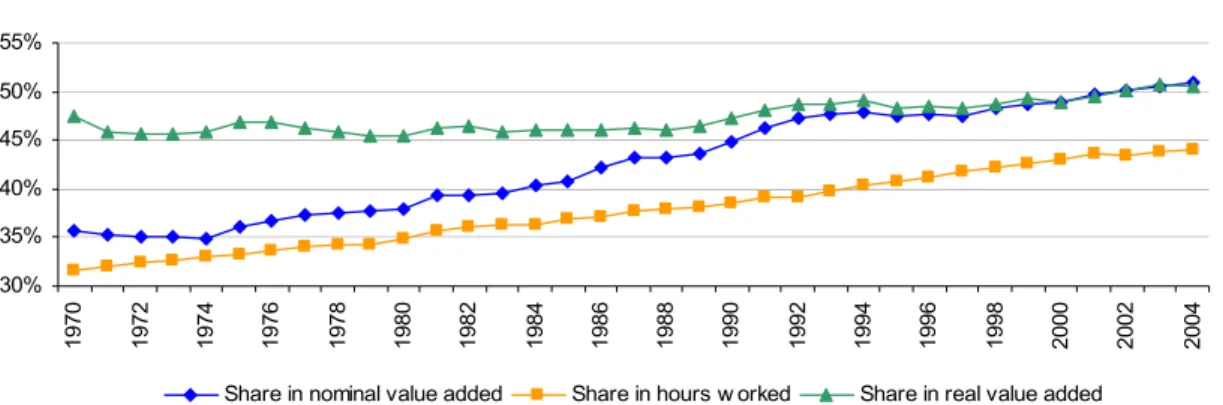
The share of market services in total real value added remained constant at around 46% throughout the 1970s and most of the 1980s. Since 2002, the share of market services in the total real added value has exceeded 50%. Since 1980, the contribution of labor to value added growth in market services has been consistently positive, particularly in the 1990s.
After a positive but limited contribution, MFP has negatively affected the growth of value added in market services since the beginning of the nineties. Labor productivity growth in market services was weaker than in the total economy, except for the most recent period, 2000-2004. In the long term, the evolution of labor productivity in market services was mainly influenced by the contribution of capital deepening.
In the most recent period, the increase in the value added of market services was mainly driven by wholesale and retail trade. Transport, storage and communication was the second most important driver of value added growth in the services market during the eighties and nineties. From the eighties, financial intermediation services also made a positive contribution to increasing the added value of services in the market.
This driving force of market services in the most recent period is mainly due to Wholesale and retail trade. During these two decades, Financial intermediation services also made a strong positive contribution to labor productivity growth in market services.
Non-market services
- Relative importance of non-market services
- Structural changes in non-market services
- Capital accumulation
In the 1970s, the share of non-market services in total real and nominal value added increased rapidly before declining in the second half of the 1980s. However, since 1970, the share of non-market services in total hours worked has continued to increase, although it has slowed since the early 1990s. The value added deflator in non-market services has been increasing much faster than in the economy as a whole, and the difference between the growth rates of the two price indices has been widening in recent years.
The various indicators must be interpreted with caution due to accounting conventions for measuring added value for non-commercial activities. The value added of non-market services is estimated based on value added components and not on the difference between output and intermediate inputs as for market industries. The only non-trade service industry with a negative average annual growth rate of real value added and hours worked is private households with employed persons.
The share of non-market services in total real capital increased until 1983, when it reached 12.5%, and then gradually declined to 10% in 2004. Between 1970 and 2004, education lost first place in terms of relative importance in the capital of non-market services in favor of public administration. Due to changes in society, Health and social care and Other social, social and personal services have increased in relative importance in the real capital of non-market services.
ICT capital accumulation in non-commercial services was lower than in the total economy. Among non-market services, other community, social and personal services held the largest share of capital services in ICT services.
Other industries
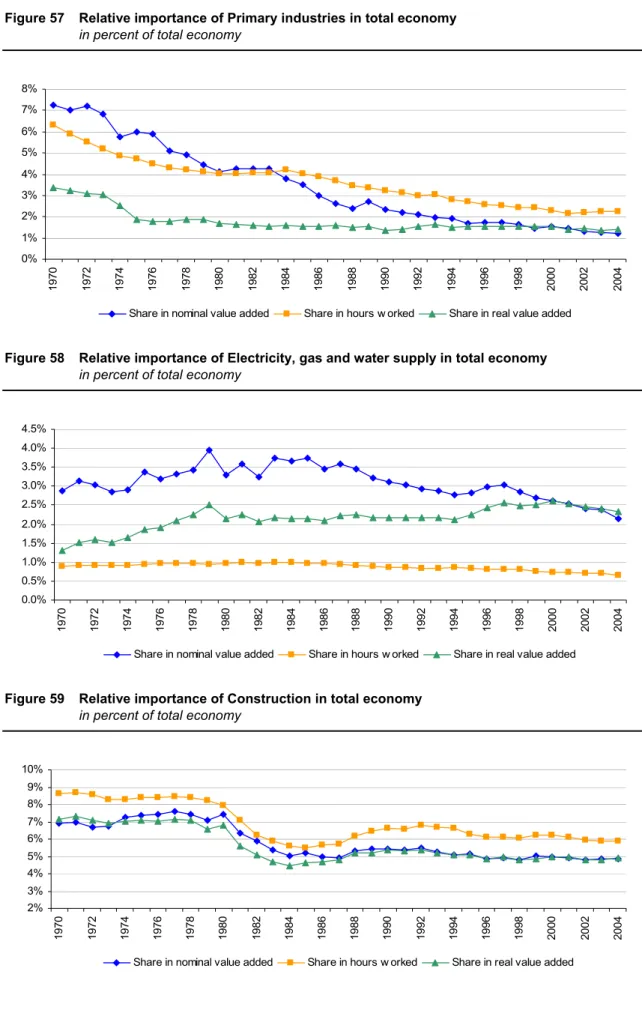
- Relative importance of other industries
- Main evolutions in Electricity, gas and water supply
- Main evolutions in Construction
Since then, the share in nominal value added has been eroded while the share in real value added has remained constant before growing again during the second half of the nineties. After being more or less constant during the seventies, the relative importance of these activities declined sharply during the first half of the eighties before recording a limited rebound during the second half of the eighties and at the beginning of the nineties and then stabilizing has. Real value growth in Electricity, gas and water supply was particularly dynamic during the seventies and to a lesser extent during the nineties.
MFP contribution to value added growth was particularly strong in Electricity, gas and water supply relative to that observed in the total economy. The relatively poor performance in terms of the most important growth components during the last few years must be analyzed with regard to structural changes in the production process of these activities. The labor cost evolution was close to that observed for the total economy, except during the eighties when wage growth was higher in Electricity, gas and water supply than in the rest of the economy.
Real value added growth in construction increased rapidly in the 1970s before declining in the 1980s and recovering from 1990 with gradually increasing growth. The last period was marked by a stronger negative contribution of work than in the 1990s. After being strong in the 1970s, the MFP contribution of construction was particularly weak in the 1980s and 1990s, but has accelerated in the recent period, reaching an average annual growth rate of 1.3%.
Labor productivity growth was influenced by and followed the same pattern as MFP: initially strong in the 1970s, then weaker in the 1980s and 1990s, and accelerating between 2000 and 2004. After rapid growth in the 1970s and slower growth in the 1980s, construction labor costs followed the same trend as labor costs across the economy.
Annex
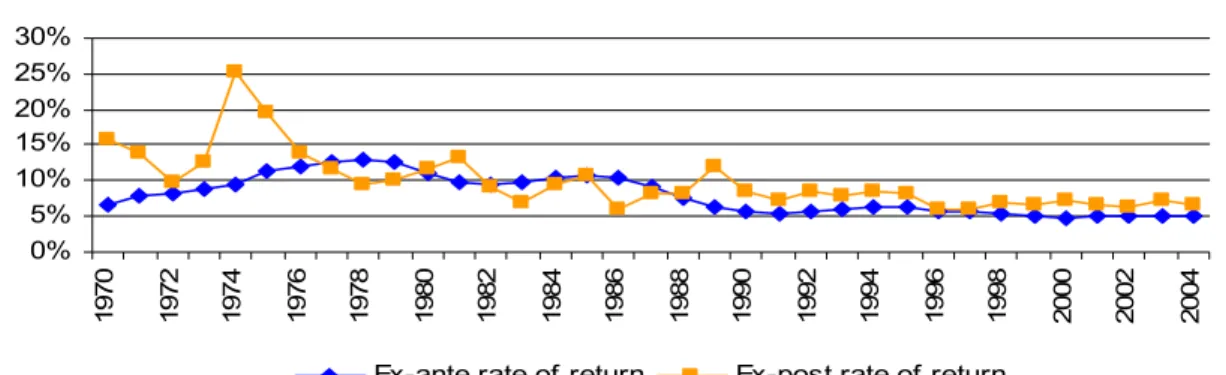
The weights used to derive a global index are the user costs of capital or rental prices, which correspond to the price of the services. This productive capital stock is obtained by the perpetual accrual method with a geometric rate of depreciation. The product of the user costs for asset i and the productive capital stock gives the value of nominal capital benefits for asset type i: uctiKti.
Two rates of return on capital can be calculated: an ex ante rate of return, based on the average interest rates observed each year in financial markets, and an ex ante rate of return calculated from the proportion of capital income to nominal productive capital. . Both rates of return on productive capital declined throughout the period 1970–2004. Since 1988, the ex ante rate of return has been systematically lower than the ex ante rate of return.
All estimates used in the report are based on data collected for the EUKLEMS project. However, this is not the only methodology available to build capital services and these different methodologies imply differences in MFP. By comparing equity-based and service-based capital contributions, it is possible to isolate the impact of capital improvement, commonly referred to as capital efficiency gains.
DE Pulp, paper and paper products, publishing and printing DF Coke, refined petroleum products and nuclear fuel DG Chemicals, chemical products and man-made fibers DH Rubber and plastic products. 6 OECD definition of IT equipment from “Working Party on Indicators for the Information Society, Guidelines for Measuring the Information Society, DSTI/ICCP/IIS(2005)6/FINAL, November 2005”.