UNITED NATIONS ENVIRONMENT PROGRAMME GLOBAL ENVIRONMENT FACILITY
PROJECT DOCUMENT
SECTION I - PROJECT IDENTIFICATION
1.1 Sub-Programme Title: Climate Change OP 6: Renewable Energy and cuts across OP5
1.2 Project Title: Cogen for Africa.
1.3 Project Number: GFL / 2328 - 2721 – 4xxx
PMS: GF/ 4010 – 07 - xx
1.4 Geographical Scope: Regional: Ethiopia, Kenya, Malawi, Swaziland, Tanzania, Uganda and Sudan.
1.5 Implementation: Energy, Environment and Development Network for Africa.
(AFREPREN/FWD)
Elgeyo Marakwet Close, Kilimani
P.O.Box 30979, 00100 GPO Nairobi, Kenya.
Tel: +254-20-3866032/ 3872144 /383714
Fax: +254-20-3861464/ 3876470/3740524
1.6 Duration of the Project: 72 months
Commencing: March 2007 Completion: Feb 2013 1.7 Cost of the Project: US$
PDF-B Project
Cost to the GEF Trust Fund 367,400 5,248,165
Co-financing
Co-financing for Technical Assistance
Government 705,600 (in-kind)
ExA: AFREPREN/FWD (related projects & TA) 50,000 (in-kind) 45,422 (cash)
AfDB 336,960 (in-kind)
COOPENER 375,000 (cash)
REEEP 50,000 (cash)
Triodos 60,000 (cash)
Leveraged Financing Private sector/ Utilities
Private Sector 60,013,368 (cash)
Co-financing Total 50,000 61,586,350
Total 1 417,400 66,834,515
1.8 Project Summary
This regional project aims to promote (mostly biomass-based) cogeneration, generating power out of (mainly agricultural) waste. The key activities of the project will include identification of opportunities, appropriate technologies and suppliers; technical advice to developers, financiers and investors; and, policy guidance (power purchase arrangements/tariffs for captive and excess firm/non firm power, etc). This active support to all stakeholders in Cogen business development in the form of capacity building, technology transfer and pre- feasibility/feasibility/Cogeneration Investment Packages (CIPs), is expected to create a conducive business
1 The total budget does not change, with the participation of AfDB as a co-implementing agency, since AfDB had already made a pledge prior to council approval.
environment for the scaling-up of cogeneration investments in eastern and southern Africa, which will in turn provide the market demand for a regional cogen centre, with associated satellite national cogen units/focal points.
The project will be jointly co-implemented by UNEP and AfDB. The executing agency is AFREPREN/FWD, based in Nairobi Kenya. AfDB has provided two letters – one which confirms their involvement as co-implementing agency, and another which commits AfDB co-financing. A detailed Cooperation Modalities Memo has been prepared by AfDB, UNEP and the Executing Agency. The Memo confirms that AfDB will be involved in all the key project decisions and will actively participate in the project Steering Committee. AfDB have also reviewed and approved the entire project document, detailed budget, draft Terms of Reference, proposed procurement and hiring processes.
Signatures
For AFREPREN/FWD, For UNEP
_________________________
Stephen Karekezi D. Hastie, Chief
Director, AFREPREN/FWD Budget and Financial Management
Service, UNON.
Date: _________________________ Date:
TABLE OF CONTENTS
SECTION I - PROJECT IDENTIFICATION...I
LIST OF TABLES... IV
LIST OF FIGURES... V
LIST OF ACRONYMS...VII
SECTION II - BACKGROUND AND PROJECT CONTRIBUTION TO OVERALL SUB-
PROGRAMME IMPLEMENTATION... 1
1. BACKGROUND AND RATIONALE... 1
1.1 WHY COGENERATION? ...1
1.2 APPLICABILITY OF COGENERATION IN AFRICA...2
1.2.1 Resource assessment and potential ... 3
1.2.2 Target/expected achievement... 9
1.2.3 Benefits of cogeneration ... 9
1.3 POTENTIAL ROLE OF COGEN IN THE REGION’S ELECTRICITY INDUSTRY...11
1.4 SUCCESSFUL EXAMPLES AND MODELS...20
2. COUNTRY OWNERSHIP... 21
2.1 COUNTRY ELIGIBILITY...21
2.2 COUNTRY DRIVENNESS...21
2.3 ENDORSEMENTS...23
3. PROGRAM AND POLICY CONFORMITY... 24
3.1 FIT TO GEFOPERATIONAL PROGRAM AND STRATEGIC PRIORITY...24
3.2 PROBLEM ANALYSIS...24
3.2.1 Current status of cogeneration in Africa ... 24
3.2.2 Baseline scenario - What happens if Cogen for Africa is not implemented?... 28
3.2.3 Alternative scenario - What would happen if Cogen for Africa is implemented successfully? ... 29
3.3 BARRIERS FOR THE DEVELOPMENT AND IMPLEMENTATION OF BIOMASS COGENERATION IN AFRICA...31
3.4 REMOVAL OF BARRIERS...37
3.5 PROJECT DESIGN AND METHODOLOGY...47
3.5.1 Objectives ... 47
3.5.2 Overall concept and approach... 48
3.5.3 UNEP/GEF and African Development Bank (AfDB) - Co-implementation of Cogen for Africa Project 48 3.5.4 The AFREPREN/FWD Regional Cogen Centre: a centre of excellence for cogeneration ... 49
3.5.5 National Cogen Offices... 57
3.5.6 Stakeholders, their involvement and commitments ... 58
3.5.7 Outcomes, outputs and detailed activities... 60
3.6 SUSTAINABILITY (INCLUDING FINANCIAL SUSTAINABILITY)...75
3.7 REPLICABILITY...76
3.8 GLOBAL ENVIRONMENTAL BENEFITS OF THE PROJECT...77
3.9 INCREMENTAL COSTS...79
3.10 MONITORING AND EVALUATION...79
4. FINANCIAL MODALITY AND COST EFFECTIVENESS... 83
4.1 FINANCING PLAN...83
4.1.1 Financing mechanisms for cogeneration projects ... 83
4.1.2 Structure of financing requirements... 86
4.1.3 Project costs and financing ... 90
4.2 COST EFFECTIVENESS...95
4.3 CO-FINANCING...95
5. INSTITUTIONAL COORDINATION AND SUPPORT... 99
5.1 CORE COMMITMENTS AND LINKAGES...99
5.2 CONSULTATION,COORDINATION AND COLLABORATION BETWEEN IAS, AND IAS AND EXAS...99
5.3 PROJECT IMPLEMENTATION ARRANGEMENTS...104
5.3.1 Organization and management of Cogen for Africa ... 104
SECTION III - WORKPLAN AND TIMETABLE, BUDGET, FOLLOW-UP... 107
SECTION IV - INSTITUTIONAL FRAMEWORK AND EVALUATION... 108
SECTION V - MONITORING AND REPORTING... 110
LIST OF ANNEXES... 113
LIST OF TABLES Table 1.1: Economic figures of the seven countries involved... 3
Table 1.2: Biomass residues by industry by country (2004) ... 3
Table 1.3: Potential for cogeneration from sugarcane in Eastern and Southern Africa ... 5
Table 1.4: Cogeneration investments in sugar factories that have been planned during the past 20 years... 7
Table 1.5: Electricity supply and demand scenario in the seven countries involved (20034 figures)11 Table 1.6: Summary of IPP investments in Kenya... 12
Table 1.7: Power Development Plan for Kenya (2006-2016), in MW... 12
Table 1.8: Projected demand and supply of power, Uganda (in MW) ... 15
Table 1.9: Planned expansion of sugar factories in Uganda... 15
Table 2.1: UNFCCC ratifications ... 21
Table 2.2: Inventory of policies supporting cogeneration in the seven participating countries ... 21
Table 3.1: Current cogeneration installed capacity in Ethiopia... 24
Table 3.2: Current cogeneration installed capacity in Kenya... 25
Table 3.3: Current cogeneration installed capacity in Malawi ... 26
Table 3.4: Current cogeneration installed capacity in Sudan ... 26
Table 3.5: Current cogeneration installed capacity in Swaziland... 26
Table 3.6: Current cogeneration installed capacity in Tanzania... 27
Table 3.7: Current cogeneration installed capacity in Uganda ... 27
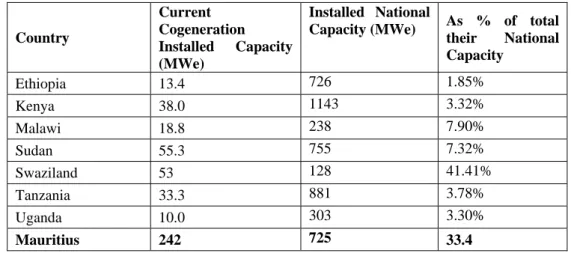
Table 3.8: Summary of current cogeneration installed capacity in some countries of Africa... 28
Table 3.9: Status of power sector reform in some African countries ... 37
Table 3.10: Summary of barriers and measures within the project to remove them ... 46
Table 3.11: Stakeholder groups, their involvement and role in, and benefits from, the Project ... 59
Table 3.12: Project risks and their mitigation... 71
Table 3.13: Risk allocation and mitigation matrix for cogeneration projects ... 73
Table 3.14: Methodology for emission mitigation potential ... 77
Table 3.15: CO2 emission mitigation potential for 40 MW installed capacity (direct project-related)78 Table 3.16: CO2 emission mitigation potential for the direct post-project installation of 20 MW installed capacity ... 78
Table 3.17: CO2 emission mitigation potential for 180 MW installed capacity (indirect project-
replicated) ... 79
Table 3.18: Monitoring and evaluation plan... 80
Table 4.1: Ranges of cogeneration projects and possible financing mechanisms ... 88
Table 4.2: Breakdown of GEF incremental financing... 90
Table 4.3: Project budget summary and corresponding sources of funds (in USD)... 93
Table 4.4: Cost incrementality... 95
Table 4.5: Projected yearly costs and funding (in USD) ... 95
Table 5.1: Relevant GEF-related projects in Southern/Eastern Africa (January 2006)... 100
Table 5.2 Relevant GEF Pipeline Data (January 2006)... 102
Table 5.3: Institutions dealing with cogeneration in selected African Countries ... 103
LIST OF FIGURES Figure 1.1: Comparison of energy balances between cogeneration and separate power generation. 1 Figure 1.2: Material balance in a sugar factory ... 2
Figure 1.3: Kenya’s installed generating capacities in 1995, 2005 and 2015 in MWe (left) and in percentage of mix (right) ... 13
Figure 1.4: Installed generating capacity grid mix (in MWe), Uganda ... 14
Figure 1.5: Power generation mix by fuel in Tanzania (2000-2004)... 17
Figure 1.6: Grid power generation in Malawi (2004)... 18
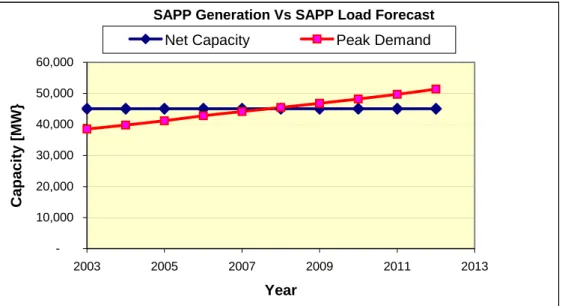
Figure 1.7: SAPP generation vs. SAPP load forecast... 19
Figure 3.1: Sustainable energy project finance continuum... 39
Figure 3.2: Security arrangements of a sound cogeneration project... 43
Figure 3.3: The Cogeneration Investment Package ... 44
Figure 3.4: Support services for FSPPs ... 44
Figure 3.5: Overview of the Cogen for Africa Project concept... 50
Figure 3.6: Contribution and involvement of International Experts/Consultants vis-à-vis Regional/Local Experts ... 52
Figure 3.7: Organizational structure of the AFREPREN/FWD Regional Cogen Centre ... 54
Figure 3.8: Matrix showing the types of sugar factories in Kenya according to ownership and degree of operational efficiency ... 55
Figure 3.9: Matrix showing the level of support required according to ownership and degree of operational efficiency ... 55
Figure 3.10: Flowchart of activities... 61
Figure 3.11: Possible structure of the financial analysis model ... 65
Figure 3.12: Growth of cogeneration capacity in Mauritius... 77
Figure 4.1: On-balance sheet financing model: Facility owner-operated and financed ... 84
Figure 4.2: Project finance model: Financing directly to project ... 85
Figure 4.3: Conventional financing participants ... 85
Figure 4.4: Innovative structure to stimulate investments in biomass cogeneration ... 86
Figure 5.1: Project management structure of the Cogen for Africa Project ... 106
LIST OF ANNEXES
The following Annexes from the Approved Project Brief are NOT included in this project document BUT are available upon request.
ANNEX C: RESPONSE TO PROJECT REVIEWERS
ANNEX E: STAKEHOLDER GROUPS, THEIR INVOLVEMENT AND ROLE IN, AND BENEFITS FROM, THE PROJECT
ANNEX G: OFFICIAL ENDORSEMENTS FROM THE 7 PARTICIPATING COUNTRIES
ANNEX H: LETTERS OF ENDORSEMENT AND COMMITMENT FROM STAKEHOLDERS AND CO- FINANCIERS
ANNEX J: SUMMARY OF CO-FINANCIERS
ANNEX K: PRE-FEASIBILITY ASSESSMENT OF COGENERATION IN SELECTED SUGAR FACTORIES ANNEX L: SUMMARY OF THE POWER SECTOR IN PROJECT COUNTRIES
ANNEX M: SUMMARY OF AGRICULTURAL PRODUCTION IN PROJECT COUNTRIES ANNEX N: LIST OF INSTITUTIONS AND PERSONS CONTACTED DURING PDF-B ANNEX O: BRIEF ON AFREPREN/FWD
ANNEX P: PRELIMINARY ASSESSMENT OF COGENERATION POTENTIAL IN SELECTED SUGAR FACTORIES
ANNEX Q: COGEN PROGRAM IN ASEAN ANNEX R: COGENERATION IN MAURITIUS
ANNEX S: NEWSPAPER ARTICLES RELEVANT TO THE PROJECT ANNEX U: POSSIBLE COGEN COUNTRY OFFICES
ANNEX V: BENEFITS OF COGENERATION ANNEX W: LEAST COST ANALYSIS
ANNEX X: CLEANER ENERGY FUND FOR AGRO-INDUSTRY IN AFRICA (CEFA) Following are the Annexes included in this Project document
ANNEX A: INCREMENTAL COST ANALYSIS ANNEX B: LOGICAL FRAMEWORK
ANNEX D: THE DESIGN OF THE AFREPREN/FWD REGIONAL COGEN CENTRE ANNEX F: MONITORING AND EVALUATION PLAN
ANNEX I: WORK PLAN, SCHEDULE AND MILESTONES
ANNEX T: QUALIFICATIONS AND RESPONSIBILITIES OF AFREPREN/FWD REGIONAL COGEN CENTER PERSONNEL
ANNEX Y: HALF-YEARLY PROGRESS REPORT FORMAT ANNEX Z: FORMAT FOR CASH ADVANCE REQUEST
ANNEX AA: FORMAT FOR QUARTERLY EXPENDITURE STATEMENT ANNEX AB: FORMAT FOR TERMINAL REPORT
ANNEX AC: FORMAT FOR REPORT ON CO-FINANCING
ANNEX AD: BUDGET IN UNEP FORMAT (in a separate excel worksheet)
ANNEX AE: FORMAT FOR INVENTORY OF NON-EXPENDABLE EQUIPMENT
ANNEX AF: AfDB-UNEP/GEF CO-IMPLEMENTATION OF COGEN AND SMALL HYDRO/TEA PROJECTS ANNEX AG: BRIEF ON PROPOSED APPROACH TO “COGEN FOR AFRICA” PROJECT
LIST OF ACRONYMS ACP African, Caribbean and Pacific
ADLI The Agriculture Development Led Industrialization
AfDB African Development Bank
AFREPREN/FWD Energy, Environment and Development Network for Africa
AIT Asian Institute of Technology
AREED Africa Rural Energy Enterprise Development ASEAN Association of South East Asian Nations
BOO Build, Operate, Own
CC Climate Change
CDM Clean Development Mechanism
CEO Chief Executive Officer
CfA Cogen for Africa
CIA Central Intelligence Agency
CIP Cogeneration Investment Package
CO2 Carbon Dioxide
Cogen Cogeneration
DBSA Development Bank of South Africa
DEG Deutsche Investitions -und Entwicklungsgesellschaft mbH
DSCR Debt Service Coverage Ratio
EADB East African Development Bank EAPLC East Africa Power & Lighting Company
EASCF East Africa Small Hydro and Cogeneration Fund
EC European Commission
EC-ASEAN European Commission - Association of South-East Asian Nations EEPCo Ethiopia Electricity Power Company
EIB European Investment Bank
EPC Engineering, Procurement, and Construction ERT Energy for Rural Transformation
ESCO Energy Service Company
EU European Union
FMO Netherlands Development Finance Company
FS Feasibility Study
FSDPs Full Scale Demonstration Projects
FSF Finchaa Sugar Factory
FSPP Full Scale Promotion Project
FWD Foundation for Woodstove Dissemination
GDP Gross Domestic Product
GEF Global Environment Facility
GHG Green House Gas
GoK Government of Kenya
GWh Giga Watt Hour
IBRD International Bank of Reconstruction and Development
IEA International Energy Agency
IPCC Inter Governmental Panel On Climate Change
IPP Independent Power Producer
IRR Internal Rate of Return
IRSEAD Institute of Research in Sustainable Energy and Development
IT Information Technology
KAM Kenya Association of Manufacturers KfW KfW Entwicklungsbank - KfW development bank
KShs Kenya Shillings
KPLC Kenya Power and Lighting Company
KSW Kinyara Sugar Works
kV KiloVolts
kW Kilowatt
kWh KiloWatt Hour
LCPD Least Cost Power Development M&E Monitoring and Evaluation
MD Man Day
MEMD Ministry of Energy and Minerals Development, Uganda
MIP Management Information Principles
MNES Ministry of Non-Conventional Energy Sources
MoU Memorandum of Understanding
MW Megawatt
MWh Mega Watt Hour
NEPAD New Partnership for Africa's Development
NPV Net Present Value
O&M Operations and Maintenance
OP Operational Program
PDF-B Project Development Facility
PDP Power Development Plan
PMC Project Management Council
PPA Power Purchase Agreement
PPD Project Design Document
PSC Project Steering Committee
REEEP Renewable Energy and Energy Efficiency Partnership RESCO Renewable Energy Service Company
RSA Republic of South Africa
SADC Southern African Development Community SBIC Swaziland Industrial Development Company, Ltd.
SCOUL The Sugar Corporation of Uganda Ltd
SPC Special Purpose Company
SSF Shoa Sugar Factory
STAP Scientific and Technical Advisory Panel TANESCO Tanzania Electric Supply Company
TANWAT Tanganyika Wattle Company
TC Tonnes of Cane
TCD Tons of Cane per Day
TCH Tonnes of cane per hour
TFA Techno-Financial Analysis
UEB Uganda Electricity Board
UETCL The Uganda Electricity Transmission Company Ltd UNDP United Nations Development Programme
UNEP United Nations Environment Programme
UNFCCC United Nations Framework Convention on Climate Change
USD US Dollar
WADE World Alliance for Decentralized Energy
WB World Bank
ZESA Zimbabwe Electric Supply Authority
SECTION II - BACKGROUND AND PROJECT CONTRIBUTION TO OVERALL SUB-PROGRAMME IMPLEMENTATION
1. BACKGROUND AND RATIONALE
1.1 Why Cogeneration?
In conventional utilities, power production and steam generation are independent of each other and separate fuel sources are used. However, it has been demonstrated that an industry’s power and thermal needs can be met using a single energy source. This is called cogeneration.
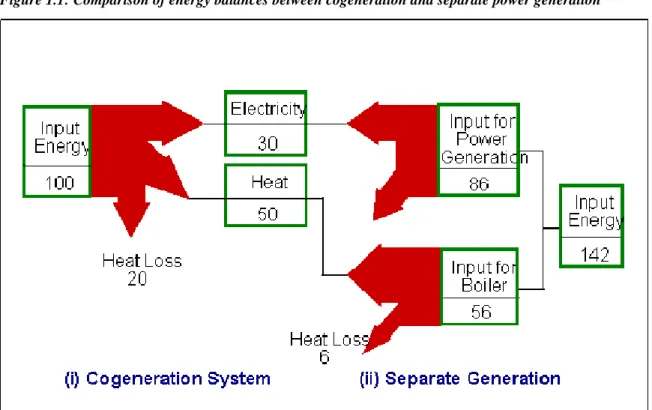
Cogeneration has the advantage of reducing the primary energy use, while providing a given quantity of two different forms of energy (usually in the forms of heat and power). Conventional energy supply systems require about 40 % more primary energy than a cogeneration system to meet the same energy needs (Figure 1.1). Therefore cogeneration can be both energy efficient and environmentally beneficial. Moreover, when biomass residues from wood and agro- industries are used as fuel for cogeneration, the plant becomes a renewable energy system which, in some instances, could replace the use of fossil fuel.
Figure 1.1: Comparison of energy balances between cogeneration and separate power generation
Source: Mohanty, 2000
Cogeneration has been widely applied in agro-industries such as sugar and palm oil factories. As the trend in wood industries is a shift towards integrated wood complexes, cogeneration plants are being implemented increasingly in this sector, too. In some cases, rice husks as well as coconut husks and shells, can also be used as a fuel to help meet the energy demands of the plant, while abating the environmental pollution associated with their disposal. If appropriate technologies are implemented, cogeneration can not only render these agro-industries self-sufficient in energy, but can also help them to earn a profit by exporting excess electricity produced to the national grid or to neighbouring industries.
The industries that produce these biomass residues have requirements for energy, usually in the form of electricity and heat. It is therefore customary for these industries to use the residues that are generated in an energy conversion system at least to cover for the internal requirements of the factory itself. Many facilities, however, approach this situation without due regard for energy or environmental merits.
For instance, in sugar factories, after the juice is taken out from the cane, there is about 30-40 % (depending on variety of sugar cane and other agronomical and climatic conditions) of bagasse generated as a waste material in the factory. In the past, because of the limited development of technology and the absence of a regulatory framework that facilitates sales of excess electricity to the grid, the sugar factories’ energy systems have been designed to generate just enough electricity and heat for the process while consuming all the bagasse to avoid its accumulation and creation of disposal problems. This approach transforms the energy system into both an energy generating unit and an incineration.
Because of recent developments in the technology which allows the production of high pressure, high temperature steam for the turbine, thus generating more power from the bagasse on one hand, and the potential for the existence of a regulatory framework that allows private generators to sell their excess power to the grid on the other hand, there now exists greater opportunities for generating cleaner power that is not only environmentally benign but an important avenue for generating an additional revenue stream for the sugar industry.
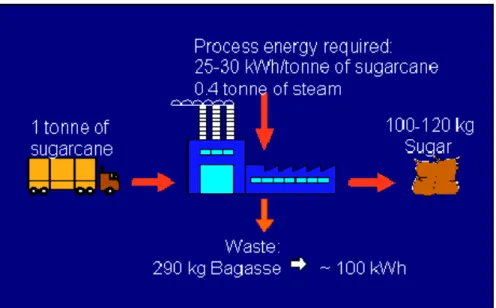
To illustrate, Figure 1.2 shows that for each ton of sugar that comes into the factory for processing, about 100 to 120 kg of sugar is produced. This process of converting sugarcane into sugar needs electricity for its prime movers, motors, pumps, etc. of about 25-30 kWh/ton of sugarcane and heat in the form of low pressure steam amounting to 400 kg/ton of sugarcane. By using the bagasse generated which is around 390 kg in an efficient high pressure Cogen system, up to 110 kWh of electricity could be produced while extracting steam enough for the requirements of the process. The 110 kWh should be able to cover for the electricity requirements of the factory with an excess of around 80 kWh. This excess electricity accounts for more than 2 to 3 times the amount needed internally by the process. This demonstrates the potential of energy that could be harnessed if the conditions are right for implementing efficient Cogen systems in relevant industries in Africa. .
Figure 1.2: Material balance in a sugar factory
With the recent developments in the global sugar market heralding the advent of low sugar prices , African sugar companies are very keen to find ways to reduce costs through efficient operations and additional revenues from complementary activities such as cogeneration. The announcement of the European Union (EU)’s plan to reduce implicit subsidies for sugar exports from African, Caribbean and Pacific (ACP) states, sent fears that the African sugar companies may find it difficult to compete against low prices from other non-African countries2. Cogeneration is increasingly perceived by sugar companies as an important opportunity for improving their financial performance by reducing their electricity bills and generating a new stream of revenues. Recent data from Mauritius indicates that half the revenue for sugar factories is from the sale of sugar and the other half from the sale of electricity from cogeneration.
1.2 Applicability of Cogeneration in Africa
Table 1.1 below summarizes the macro-economic figures of the seven African countries that are participating in this project and have expressed keen interest in promoting cogeneration in their industries. It should be observed that for most of them, agriculture alone (and more so if agro-industry is added) account for more than one-third (close to or around 50% for some of them) of the total GDP of the countries. The industries processing these agricultural products normally require energy in the form of electricity to drive their prime movers/machinery and heat for the process. At the same time, they also normally generate residues that could be used as fuel for boilers producing steam for the process and electricity when directed to a turbo-generator. The set up then becomes a cogeneration system.
2 Daily Nation, December 7, 2005, Kenya
Table 1.1: Economic figures of the seven countries involved
Real GDP growth % GDP per sector 2004 Countries
Gross domestic product (GDP) in Million
USD 2003
2002 2003 2004 Per capita GDP in USD 2003
Agricul ture %
Indus- try %
Service s %
Ethiopia 6,972 1.9 -3.7 11.6 101.6 47.0 12.4 40.6
Kenya 10,892 1.2 1.8 2.2 341.2 19.3 18.5 62.4
Malawi 1,776 2.7 4.4 4.0 162.0 54.8 19.2 26.0
Sudan 17,800 6.5 6.0 8.6 460 41.2 18.5 40.4
Swaziland 1,487 2.8 2.4 2.5 1,351.8 16.1 43.4 40.5
Tanzania 11,079 7.2 7.1 5.8 308.6 43.2 17.2 39.6
Uganda 6,959 6.8 4.7 5.0 275.3 35.8 20.8 43.6
Source: World Bank, 2005; CIA World Factsheet 2005
In the seven participating countries, the sugar industry that produces bagasse is a major sector given high priority by the governments. On the demand side, the need for additional power capacity is increasing and governments are turning to the private sector to meet the challenge of investing in power generation facilities. For instance, Uganda which is currently facing shortage in power due to the lowering of the water level in Lake Victoria which is the source of the hydro power that supplies most of the country’s electricity requirements (see Annex S), as well as Kenya and Tanzania are keen to attract private Independent Power Producers (IPPs) to install additional power generating capacities.
The sections that follow present background information and data on the resources and potential for the application of cogeneration in Africa, and the benefits that could be derived in wider application of cogeneration in the region.
1.2.1 Resource assessment and potential
Based on the information that is currently available, cogeneration has huge potential in relevant sectors such as: sugar, pulp and paper, wood processing, coffee, maize, rice, hotels, hospitals, commercial complexes, etc.
One of the key determining factors that drive the decision of project developers to implement a cogeneration system is the availability of fuel to supply the requirements of the plant at reasonable prices and at a sustained period of time.
Other than coal and natural gas, which are possible fuels for cogeneration, an abundant supply of fuel comes from the residues that are generated by the industries using wood and agricultural crops as raw material. In Annex M the statistics of agricultural produce in each of the participating countries and the availability of biomass residues generated by different industries in the different countries is provided. These agricultural products when processed into their consumable form, produce some residues in the form of biomass wastes. These so-called wastes, being combustible material with significant energy content (calorific value), could be used as fuel in energy conversion systems such as cogeneration plants. Table 1.2 shows the biomass residues produced by the sugar and rice industries in the different countries and their theoretical power generation potential. In these industries, the residues are centralized in the mills/factories where the raw material is processed, which makes it easy for these residues to be gathered and used as fuel.
Table 1.2: Biomass residues by industry by country (2004) A. Sugarcane
Country Sugarcane
(1000 tons)
Bagasse production (1000 tons)*
Theoretical power generation potential (MWh/year)**
Ethiopia 2,454 859 282,242
Kenya 4,661 1,631 536,014
Malawi 2,100 735 241,500
Sudan 5,500 1,925 632,500
Swaziland 4,500 1,575 517,500
Tanzania 2,000 700 230,000
Uganda 1,600 560 184,000
TOTAL 22,815 7,985 2,623,756
* At an average of 35% bagasse to cane ratio
** At an assumed boiler pressure of 65 bar B. Rice
Country Rice paddy
(1000 tons)
Rice husk production (1000 tons)***
Theoretical power generation potential (MWh/year)***
Ethiopia 15.50 3 1,550
Kenya 49.30 10 4,930
Malawi 49.72 10 4,972
Sudan 15.75 3 1,575
Swaziland 0.17 0.03 17
Tanzania 680.00 136 68,000
Uganda 140.00 28 14,000
TOTAL 950.44 190 95,044
*** At an average of 20% rice husk to paddy ratio
**** At an assumed boiler pressure of 20 bar
It is, however, acknowledged that due to institutional, policy, regulatory and practical constraints the above theoretical potential may not be fully realized.
One issue that concerns the use of biomass residues as fuel for cogeneration is the seasonality of some of the agricultural products. A good example is the sugar industry. There is a concern that if a cogeneration plant is implemented to supply excess power to the grid on a firm basis, the plant may not be able to operate whole year round due to lack of fuel during the off-milling season. However, experiences from Thailand (with milling season of 3 to 4 months) and Mauritius (with milling season of 7 to 8 months) has shown that a whole year round electricity production is possible to achieve either by spreading out the bagasse to cover the operation during the off-milling season (case of Thailand) or using non-bagasse secondary fuel (case of Mauritius). In most countries here in Africa, the sugar factories operate for an average period of 10 to 11 months. With longer milling duration, the sugar industries in the participating countries of Africa, bagasse production is spread throughout the year which facilitates the operation of the cogeneration plant all year round (by storing a portion of bagasse for four to six weeks into the off-milling season) and eliminates the necessity to use secondary fuel such as coal. Moreover, with the advent of the diffuser technology to extract the juice from the sugar cane instead of the conventional milling, such as the one used in Mumias Sugar factory in Kenya, the down time and scheduled maintenance is significantly reduced thus allowing factories to operate for a longer period in a year.
Other than the above solution on seasonality, the limited period of the sugar milling season might not necessarily be a barrier for cogeneration as investments in generation are often dictated by capacity shortages, instead of energy shortages. As part of the initial planning during Project implementation, capacity balance tables could be constructed for each participating country to show demand and reserves against available energy in both capacity and energy terms on a monthly basis. By obtaining the resultant deficit or surplus in capacity or energy, the need for cogeneration by month could be demonstrated. This would reveal the cost-effectiveness of cogeneration technology for meeting capacity requirements. The information will also be useful for assessing the appropriateness of the Power Purchase Agreement (PPA).
One upside in the sugar industry is the fact that sugar cane also contains tops and leaves (cane trash) which is potentially available as fuel and is comparable to bagasse in terms of its potential available energy content per ton of sugar cane. This is traditionally burned and left on the field for soil conditioning. However, a potion of this could be taken and used as additional fuel which is being done in new cogeneration plants in Thailand as well as pilot plants in Brazil.
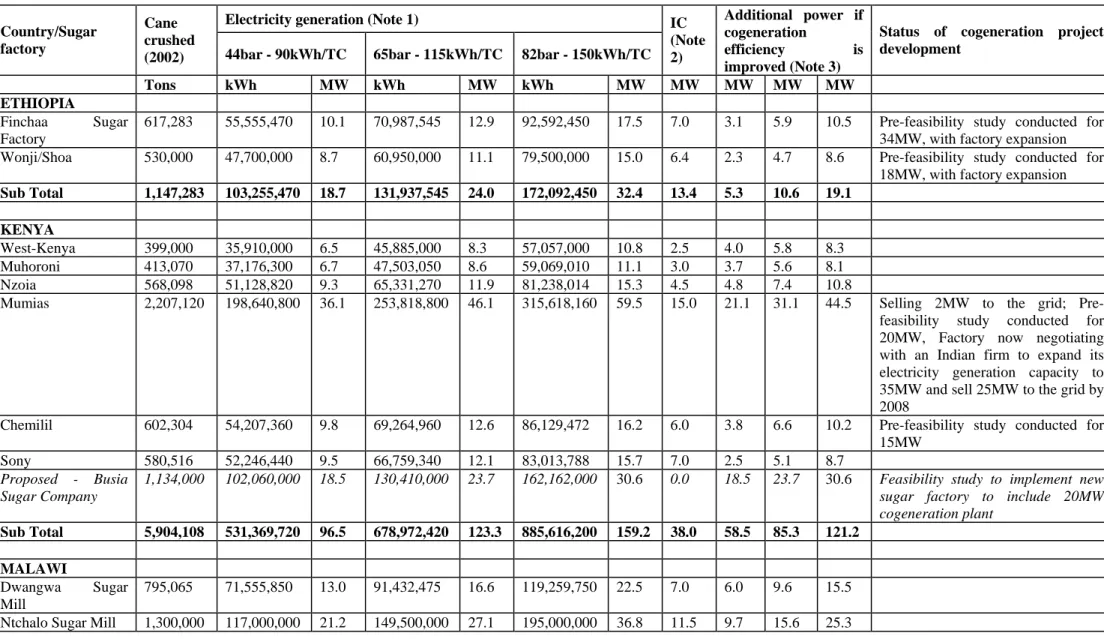
On the factory level, within the sugar industry alone (which has more accessible and organized data), the potential to harness the existing bagasse for cogeneration is undeniable. Table 1.3 provides an overview of the potential for cogeneration from sugar cane in the participating countries using 2002 data. The estimated potential is conservative as it does not take into account both the growth since 2002 as well as the future growth of the sugar production in all countries. Use of other biomass fuels (such as residues from wood/pulp/paper industries, coconut husks, rice husks, residues from maize, coffee, sisal and palm oil agro-industries) for cogeneration have likewise not been included in this estimate. In addition, alternative fuels to continue powering cogeneration plants beyond harvesting periods and milling season have not been considered. It can be seen from the table that depending on the efficiency of the system adopted (from medium efficiency to high efficiency, state-of-the-art, high pressure cogeneration systems) the additional power cogeneration capacity would vary from 225 MW to 550 MW.
Among the potential projects in the sugar industry of the participating countries, there are those that have undergone initial project development. These projects and the status of their development are provided in Table 1.4.
Table 1.3: Potential for cogeneration from sugarcane in Eastern and Southern Africa3 Electricity generation (Note 1)
Country/Sugar factory
Cane crushed
(2002) 44bar - 90kWh/TC 65bar - 115kWh/TC 82bar - 150kWh/TC IC (Note 2)
Additional power if cogeneration
efficiency is improved (Note 3)
Status of cogeneration project development
Tons kWh MW kWh MW kWh MW MW MW MW MW
ETHIOPIA Finchaa Sugar Factory
617,283 55,555,470 10.1 70,987,545 12.9 92,592,450 17.5 7.0 3.1 5.9 10.5 Pre-feasibility study conducted for 34MW, with factory expansion Wonji/Shoa 530,000 47,700,000 8.7 60,950,000 11.1 79,500,000 15.0 6.4 2.3 4.7 8.6 Pre-feasibility study conducted for
18MW, with factory expansion Sub Total 1,147,283 103,255,470 18.7 131,937,545 24.0 172,092,450 32.4 13.4 5.3 10.6 19.1
KENYA
West-Kenya 399,000 35,910,000 6.5 45,885,000 8.3 57,057,000 10.8 2.5 4.0 5.8 8.3 Muhoroni 413,070 37,176,300 6.7 47,503,050 8.6 59,069,010 11.1 3.0 3.7 5.6 8.1
Nzoia 568,098 51,128,820 9.3 65,331,270 11.9 81,238,014 15.3 4.5 4.8 7.4 10.8
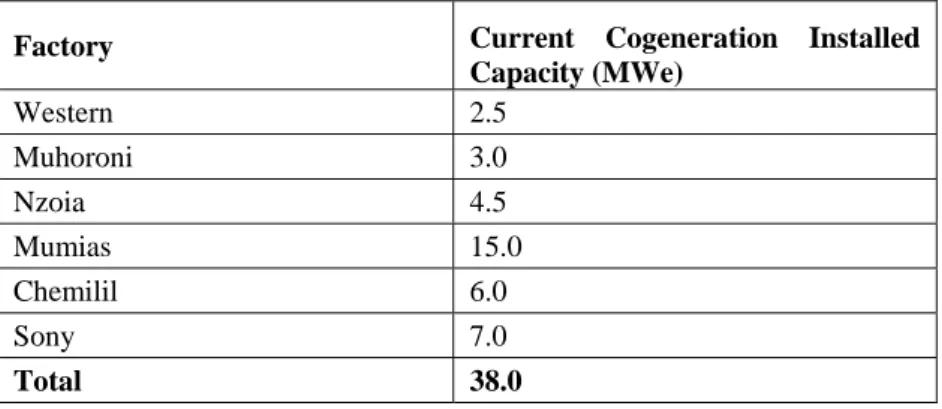
Mumias 2,207,120 198,640,800 36.1 253,818,800 46.1 315,618,160 59.5 15.0 21.1 31.1 44.5 Selling 2MW to the grid; Pre- feasibility study conducted for 20MW, Factory now negotiating with an Indian firm to expand its electricity generation capacity to 35MW and sell 25MW to the grid by 2008
Chemilil 602,304 54,207,360 9.8 69,264,960 12.6 86,129,472 16.2 6.0 3.8 6.6 10.2 Pre-feasibility study conducted for 15MW
Sony 580,516 52,246,440 9.5 66,759,340 12.1 83,013,788 15.7 7.0 2.5 5.1 8.7
Proposed - Busia Sugar Company
1,134,000 102,060,000 18.5 130,410,000 23.7 162,162,000 30.6 0.0 18.5 23.7 30.6 Feasibility study to implement new sugar factory to include 20MW cogeneration plant
Sub Total 5,904,108 531,369,720 96.5 678,972,420 123.3 885,616,200 159.2 38.0 58.5 85.3 121.2 MALAWI
Dwangwa Sugar Mill
795,065 71,555,850 13.0 91,432,475 16.6 119,259,750 22.5 7.0 6.0 9.6 15.5
Ntchalo Sugar Mill 1,300,000 117,000,000 21.2 149,500,000 27.1 195,000,000 36.8 11.5 9.7 15.6 25.3
3 Incorporated updated potential based on new data and information received after Council approval.
Sub Total 2,095,065 188,555,850 34.2 240,932,475 43.7 314,259,750 59.2 18.5 15.7 25.2 40.7 SWAZILAND
Simunye 2,352,000 211,680,000 38.4 270,480,000 49.1 352,800,000 66.5 17.0 21.4 32.1 49.5 Pre-feasibility study for 50MW conducted
Mlhume 1,764,000 158,760,000 28.8 202,860,000 36.8 264,600,000 49.9 18.5 10.3 18.3 31.4 Pre-feasibility study for 50MW conducted, with factory expansion Ubombo 2,745,600 247,104,000 44.9 315,744,000 57.3 411,840,000 77.6 17.5 27.4 39.8 60.1
Sub Total 6,861,600 617,544,000 112.1 789,084,000 143.3 1,029,240,0 00
194.0 53.0 59.1 90.3 141.0
Country/Sugar factory
Cane crushed
(2002) 44bar - 90kWh/TC 65bar - 115kWh/TC 82bar - 150kWh/TC IC (Note 2)
Additional power if cogeneration
efficiency is improved (Note 3)
Status of cogeneration project development -Feasibility Studies
Tons kWh MW kWh MW kWh MW MW MW MW MW
SUDAN
Kenana Sugar Co.
Ltd.
3,281,000 295,290,000 53.6 377,315,000 68.5 492,150,000 92.8 40.0 13.6 28.5 52.8 The factory has recently expanded its cogeneration capacity to 53MW Gunied Sugar
Factory
825,000 74,250,000 13.5 94,875,000 17.2 123,750,000 23.3 3.0 10.5 14.2 20.3 Feasibility study conducted for 28MW, with factory expansion
New Halfa Sugar Factory
835,000 75,150,000 13.6 96,025,000 17.4 125,250,000 23.6 6.0 7.6 11.4 17.6 Feasibility study conducted for 30MW, with factory expansion
Sennar Sugar Factory
880,000 79,200,000 14.4 101,200,000 18.4 132,000,000 24.9 6.5 7.9 11.9 18.4 Feasibility study conducted for 28MW, with factory expansion
Sub Total 5,821,000 523,890,000 95.1 669,415,000 121.5 873,150,000 164.6 55.5 39.6 66.0 109.1
TANZANIA
Kilombero Sugar Plant K1
403,200 36,288,000 6.6 46,368,000 8.4 60,480,000 11.4 6.0 0.6 2.4 5.4 Kilombero Sugar
Plant K2
504,000 45,360,000 8.2 57,960,000 10.5 75,600,000 14.3 2.8 5.4 7.7 11.5
Mtibwa Sugar Estate 1,764,000 158,760,000 28.8 202,860,000 36.8 264,600,000 49.9 13.0 15.8 23.8 36.9 There are plans to expand the factory capacity to generate 30MW of which 25MW is targeted for sale to the grid Kagera Sugar
Company
302,400 27,216,000 4.9 34,776,000 6.3 45,360,000 8.6 5.0 - 1.3 3.6
Tanganyika Planting 655,200 58,968,000 10.7 75,348,000 13.7 98,280,000 18.5 3.0 7.7 10.7 15.5 Pre-feasibility study conducted for
Company 20MW, with factory expansion Sub Total 3,628,800 326,592,000 59.3 417,312,000 75.8 544,320,000 102.6 29.8 29.5 46.0 72.8
UGANDA
Kakira Sugar Works 710,000 63,900,000 11.6 81,650,000 14.8 106,500,000 20.1 6.0 5.6 8.8 14.1 Agreement to sell 12MW to the grid, interested in expansion if attractive PPA is agreed upon
Kinyara Sugar Company
610,000 54,900,000 10.0 70,150,000 12.7 91,500,000 17.3 2.0 8.0 10.7 15.3 Pre-feasibility study conducted for 5MW, The factory was recently privatized when 51% of its shared were acquired by the Rai Group.
SCOUL 387,000 34,830,000 6.3 44,505,000 8.1 58,050,000 10.9 2.0 4.3 6.1 8.9
Sub Total 1,707,000 153,630,000 27.9 196,305,000 35.6 256,050,000 48.3 10.0 17.9 25.6 38.3 GRAND TOTAL 27,164,85
6
2,444,837,0 40
443.9 1,526,038,6
40
567.2 3,884,574,4 08
732.4 218.2 225.
7
349.0 514.2
Note 1: 3 scenarios are used to estimate electricity generation, based on improvements in efficiency and boiler pressure from the Mauritius experience. These are: 44 bar pressure at 90kWh/TC, 65 bar at 115kWh/TC and 82 bar at 150kWh/TC. Assumes 35% bagasse to cane ratio at 50 % moisture content
Note 2: IC = Installed capacity. This is the current installed electrical capacity of the sugar factory.
Note 3: The difference between the current installed capacity and the electricity that can be generated under the 3 scenarios, with varying boiler pressure.
Note 4: Conversion from kWh to MW assumes plant operating duration of 270 days, 24hrs a day and capacity utilization of 85%.
Table 1.4: Cogeneration investments in sugar factories that have been planned during the past 20 years
Country/Sugar factory Cogeneration Expansion plans/Pre-Feasibility Studies Planned Investment (US$) KENYA
Mumias Selling 2MW to the grid; Pre-feasibility study conducted for 21MW
12million Chemilil Pre-feasibility study conducted for 15MW 23.7million Proposed - Busia Sugar
Company
Feasibility study to implement new sugar factory to include 20MW cogeneration plant
100million (includes cost of factory setup with cogeneration component)
SUDAN
Gunied Sugar Factory Feasibility study conducted for 28MW, with factory expansion
34-39million New Halfa Sugar Factory Feasibility study conducted for 30MW, with factory
expansion
31-37million
Sennar Sugar Factory Feasibility study conducted for 13MW, with factory expansion
19million TANZANIA
Tanganyika Planting Company
Pre-feasibility study conducted for 20MW, with factory expansion
To be confirmed
ETHIOPIA
Finchaa Sugar Factory Pre-feasibility study conducted for 34MW, with factory expansion
34million Wonji/Shoa Pre-feasibility study conducted for 18MW, with factory
expansion
195million (includes factory expansion with cogeneration component)
UGANDA
Kakira Sugar Works Agreement to sell 12MW to the grid, interested in expansion if attractive PPA is agreed upon
To be confirmed Kinyara Sugar Company Pre-feasibility study conducted for 5MW To be confirmed SWAZILAND
Simunye Pre-feasibility study for 50MW conducted 77.5million
Mlhume Pre-feasibility study for 50MW conducted, with factory expansion
77.1million
Note: The variation in cost per MW from country to country could be due the use of high pressure systems, which are more sophisticated and therefore more costly. In addition, in some countries, the investment includes a bagasse handling facility, and expansion of the sugar plantation and factory.
1.2.2 Target/expected achievement4
The potential for implementing medium to high-pressure cogeneration systems (as compared to the current practice of inefficient low-pressure systems) is huge. However, it should be noted that for the past 40 years5 or more, the sugar industry in the participating countries has installed only around 200 MW of cogeneration equipment even when the need for additional capacity to reach self-sufficiency exists. Moreover, as far as the current phase of this Project has investigated, only the Kakira Sugar Works in Uganda has a 45-bar boiler, although this is still in the construction stage and is not yet in operation.
Given this scenario, it is the Project’s target that through its activities of removing the barriers that exist and assisting in transforming the cogeneration industry into a profitable cogeneration market through capacity building, technical assistance, and institutional support for policy formulation, an additional of 40 MW of modern and efficient cogeneration capacity will be implemented as Full Scale Promotion Projects (FSPPs). It is assumed that about 6 FSPPs are required to meet the 40 MW target during project implementation. These projects will act as showcases in convincing other potential project developers/owners of the technical reliability, economic viability and environmental friendliness of these types of cogeneration systems.
It is also expected that during the Project implementation another 20 MW of projects will have been directly supported through the provision of advice, services and training but are not considered as FSPPs. These projects are expected to be either being implemented or at the advanced stage of project development at the end of the Project. Once the FSPPs are implemented and used as show cases of modern and efficient cogeneration systems, replication of such systems are expected to happen most likely beyond the 6-year duration of the Project for a total of around 200 MW, which includes the 20 MW that have been supported and developed during the Project implementation.
The target of 40 MW direct project and 20 MW direct post-project is ambitious considering the long development stage of cogeneration projects vis-à-vis the Project duration of 6 years. However, taking into account the potential in the participating countries and the design of the Projects which draws lessons and experiences from successful institutional models, this target is realizable. In comparison, the Cogen Programme in Asia realized 30 MW of directly supported projects during the first 10 years and around 150 MW during the third phase and last 3 years of its operations.
It must be emphasized that in order to maximize the benefits of implementing highly efficient cogeneration systems in the sugar factories, the efficiency in the use of process steam and electricity in the sugar processing should also be improved. This will free up more bagasse to generate additional electricity for sales to the grid.
1.2.3 Benefits of cogeneration
The benefits of implementing cogeneration systems encompass the efficiency, economic and environmental aspects which governments, industries, businesses and communities of Africa as well as the global environment could gain if efficient cogeneration is properly exploited. Some of the major benefits of cogeneration are mentioned below and are elaborated in Annex V.
• Energy cost savings
These savings come mainly from not having to purchase power from the grid or from not having to buy conventional fuel for generating power and/or heat, especially if using biomass as fuel. Further savings can be realized due to the lower primary energy consumption of a cogeneration system compared to a conventional separate heat and power generation.
It is known that many sugar factories in Africa, in spite of the huge quantity of bagasse generated though their operation, are not self-sufficient in energy and are still importing power from the grid. Notable examples of this situation are mentioned in the Annex. If appropriate cogeneration systems are implemented in these factories, the amount of money spent for paying the electricity bills would be saved thus reducing production costs.
• Use of indigenous, cheap renewable fuel source instead of imported, finite fossil fuel
Biomass residues suitable for cogeneration can be found in abundant quantities in most sub-Saharan African countries.
Using these residues allows agro-industries to generate power and heat from what is considered as indigenous, cheap, environmentally friendly and renewable fuel.
Some of the countries in the region, namely, Kenya, Uganda, Tanzania are experiencing shortage of power from existing hydroelectric generating capacities and have implemented or are planning to implement thermal power plants using diesel/coal as fuel as additional capacities to augment the shortage. If the available biomass resources are
4The pre-defined target is the 40MW and it is assumed that about 6 FSPPs are required to meet the 40 MW target during project implementation and 20MW during pipeline,
5Most sugar factories were established before independence, and had ambitious cogeneration plans, which to date have not been realized. As per the limited documentation that is available, as well as personal communication with senior and retired sugar factory engineers/experts, these ambitious plans have been updated on an annual basis, with very few actual cogen plants constructed. This demonstrates that the target of 40MW of more efficient cogen investments is very ambitious for the 7 participating East and Southern African countries (in contrast to industrialized countries of Central and Eastern Europe, parts of Latin America and South East Asia/China, where a 40MW target would be perceived as unduly modest).
exploited, these additional capacities could either be delayed or could be partly or wholly replaced by cogeneration systems, while freeing up some hydropower capacities for use at more appropriate times.
• Elimination of disposal problems and associated costs for biomass residues
In Kinyara Sugar Works, Uganda, the management revealed during the stakeholders’ discussions that the company spends around 200,000 USD/year to dispose the excess bagasse 2 to 3 kilometers away from the factory. It is estimated that in the sugar factories in Africa, only 60 % of the huge quantities of bagasse produced by the sugar factories is utilized as fuel for inefficient energy systems while the rest is disposed at a cost.
By using these residues, which had been traditionally considered as a waste matter, as fuel for cogeneration systems, the disposal costs and associated hazards of disposing them could be avoided.
• Loss reduction and improvement in quality and reliability of supplies
In many countries in the African region, the reliability of the power supply from the electric utility is not very reliable, prompting the industries to have their own back up system usually using diesel generators. For example, it is estimated that the Kenyan interconnected grid-system experiences over 10,000 recorded power interruptions every month.
By implementing their own cogeneration system using the fuel that comes from their own factories, the reliability of the energy system of the factory is enhanced. In a study conducted by Bothwell Batidzirai6 on the introduction of a cogeneration plant in the sugar industry in Zimbabwe to sell excess power to the grid, the analysis showed that when embedded generation was introduced into an electricity supply system, the voltage profile on the local network was improved which translate into improved quality of service to local consumers as problems of voltage fluctuations are eliminated. In addition, with properly graded protection system in place, reliability of the local system was improved as the local network can operate in island mode when there is a failure on the main grid. System losses were also reduced significantly, and in the case of Chiredzi network in Zimbabwe, a loss reduction by up to 50 % was possible.
• Additional income
In cases where a cogeneration plant can be installed to produce electricity in excess of what is required by the host facility, extra income could be generated through the sales of excess electricity to the grid. This has been shown to be the case in countries like Thailand, India and Mauritius where sugar factories have implemented cogeneration systems that generate excess electrical capacities for sale to the grid and receive revenues from electricity which account for up to the same amount as the income from the sugar business.
• Opportunity for increasing rural electrification levels
In many biomass-producing industries, a cluster of households develops due to the presence of workers in the industry and the secondary economy that emerges as a result of this settlement. The added capacity from cogeneration could be used to electrify the villages and rural community surrounding the industry hosting the cogeneration system. Mumias Sugar factory, for instance has electrified the houses of its workers from the cogeneration system in the factory. The marginal efforts and investments in doing this is not significantly high compared to the social and economic benefits it provides to the community.
• Reduction of transmission and distribution losses
When a centralized pure power generation is implemented and electricity is distributed to the users in different parts of the country, losses of the power generated are incurred. These losses go as high as 20 % in some of the participating countries in this Project,7 emphasizing the need for embedded generation such as Cogen.
In Africa, most sugar factories are found at the edge of the country’s grid thus requiring an extensive transmission and distribution system. The introduction of embedded cogeneration facilities would significantly improve the power flow in these areas while reducing losses and costs associated with transmission of power from far-away centralized systems.
• Less burden for the national government in electricity generation investment
Because of the need to provide additional capacity for the growing demand for power, and the competing demands for the limited public financial resources, governments in the region have started to turn to the private sector for investments in new power generating capacities. The implementation of new cogeneration plants by the industries both for their own energy requirements and sales of excess power to the national grid, reduces the burden for the national government to invest in capital intensive additional power generating capacities. Moreover, the high costs associated with transmission and distribution networks are avoided.
• Environmental benefits
In general, cogeneration systems with simultaneous production of electricity and thermal energy systems saves fuel energy compared to separate production of electricity and thermal energy. This is caused by the higher overall efficiency, assuming that the cogeneration systems are designed and operated properly and that the thermal energy generation is utilized. The energy consumption is also lower because the losses in the electricity transfer system is minimal for cogeneration plants located close to the demand of electricity compared to electricity production in
6 Batidzirai, Bothwell, “Cogeneration in Zimbabwe – A Utility Perspective”, AFREPREN Occasional Paper No. 19, 2002.
7 For instance, overall system losses in the following countries are: Malawi: 19%, Tanzania: 22%, Swaziland: 16%.
centralized power systems by utilities and transmitting/distributing via the grid. The reduction in energy consumption in most cases leads to lower emissions of gasses and particulate matters harmful to the environment.
1.3 Potential Role of Cogen in the Region’s Electricity Industry
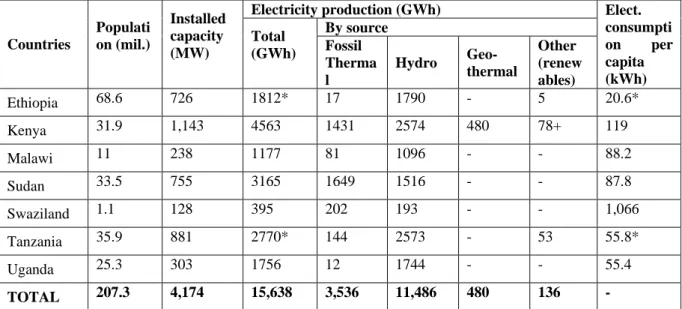
The countries in Africa, and particularly those that are participating in the Cogen for Africa Project have much lower per capita electricity consumption compared to other developing nations in other regions (please see Table 1.5). As these countries grow in economic development and also grow in population, it is expected that high demand (or high suppressed demand) in electricity would need an increase in generating capacity.
Although current sources indicate that hydro power supplies a significant portion of the electricity consumption, this resource could face limitations in the future. Already, because of on-going droughts, the water level of Lake Victoria which is the source of water used by hydro power stations in Uganda, has dropped which caused power production in some hydro plants to fall by nearly half prompting utilities to draw power from more expensive fossil-fuelled Independent Power Producers (IPPs)8. In addition, there is a need to meet an increase in demand due to increase electrification and also due to improved quality of life requiring additional electricity generation capacity.
Considering the potential that electricity from cogeneration plants could provide using indigenous and even renewable fuel and using investments coming from the private sector, it is obvious that the financial burden to the governments and environmental burden to the global environment could be reduced.
Table 1.5: Electricity supply and demand scenario in the seven countries involved (20034 figures)9 Electricity production (GWh)
By source Countries
Populati on (mil.)
Installed capacity (MW)
Total
(GWh) Fossil Therma l
Hydro Geo- thermal
Other (renew ables)
Elect.
consumpti on per capita
(kWh)
Ethiopia 68.6 726 1812* 17 1790 - 5 20.6*
Kenya 31.9 1,143 4563 1431 2574 480 78+ 119
Malawi 11 238 1177 81 1096 - - 88.2
Sudan 33.5 755 3165 1649 1516 - - 87.8
Swaziland 1.1 128 395 202 193 - - 1,066
Tanzania 35.9 881 2770* 144 2573 - 53 55.8*
Uganda 25.3 303 1756 12 1744 - - 55.4
TOTAL 207.3 4,174 15,638 3,536 11,486 480 136 -
Source: World Bank, 2005; CIA World Factsheet 2005; AFREPREN, 2005; African Energy 2005.
*2001 data. More recent estimates indicate the Installed Capacity as 1088MW, and the per capita electricity consumption at 84kWh ;
+ Natural gas and wind
In Annex L, a review of the electricity supply industry of the participating countries is conducted with the aim of analyzing the usefulness and applicability of implementing cogeneration systems to supply the additional power requirements in these countries. Below, brief analyses of some countries show the potential role of cogeneration in the countries’ electricity industry.
Kenya currently has a total installed capacity of 1155 MW, consisting of hydropower at 677.3 MW (58.6 %), followed by thermal at 349.3 MW (30.2 %), geothermal at 128 MW (11 %) and wind at 0.4 MW (0.03 % ).
For a long time, the power sector in Kenya was dominated by a vertically integrated power utility, the Kenya Power and Lighting Company (KPLC), which was the dominant player in the generation, transmission and distribution of power in the country.10 With the enactment of the Electricity Act of 1997, the generation segment was liberalized allowing the participation of Independent Power Producers (IPPs). These IPPs have installed mainly diesel power plants (284.5 MW out of the total 348.5 MW between 1997 to 2001), resulting in high tariffs at an average of 11.25 Kshs/kWh (0.16 USD/kWh). Table 1.6 presents the summary of the most recent IPP investments.
8 Daily News, November, 15, 2003; Daily Nation, January 19, 2006, Kenya; The East African News, January 23-29, 2006.
9 Incorporated updated installed capacity based on new data and information received after Council approval.
10 Mbuthi, P. and Yuko, D., A Review of Geothermal and Cogeneration Technologies in Kenya, in Sustainable Energy in Africa, AFREPREN/FWD, 2005.
Table 1.6: Summary of IPP investments in Kenya
Company Name Project
Location Project type
Project capacity (MW)
Investmen t (US$
million)
Completion Date
IberAfrica Nairobi Diesel plant 44 N/a 1997
IberAfrica Nairobi Diesel plant 12 13 October 2000
Westmont Power Mombasa Diesel plant, barge-mounted
43.5 N/a 1997
Ormat International Olkaria Geothermal Plant 64 210 12 MW by Nov.
2000, 52 MW by July 2003
BWSC (in full) Lanet Diesel Plant 55 65 July 2001
BWSC (in full) Eldoret Diesel Plant 55 65 July 2001
Tsavo Power Co. Kipevu Diesel Plant 75 85 July 2001
Source: Marandu, E., and Kayo, D., 2004
The use of thermal fossil power plants will continue to dominate the future capacity additions in the country’s electricity supply industry, as evidenced by the Least Cost Power Development Plan (PDP) issued by the Ministry of Energy. As shown in the Table 1.7, it is planned that up to 2016, 1,123 MW of power capacity (consisting of 67.5 % of total capacity additions) will come from thermal power plants mainly fuelled by coal and diesel.
Table 1.7: Power Development Plan for Kenya (2006-2016), in MW Thermal
Year Hydro Geo
Gas Coal Diesel Total thermal
Others (import/
line ext.)
TOTAL
2006 43 43 43
2007 240 240 240
2008 120.6 69.6 190.2
2009 67.2 150 150 50 267.2
2010 -
2011 150 150 150
2012 67.2 100 167.2
2013 150 150 150
2014 150 150 150
2015 150 150 150
2016 67.2 90 90 157.2
Total 120.6 271.2 133 750 240 1,123 150 1,664.8
Source: Data from Ministry of Energy, 2005
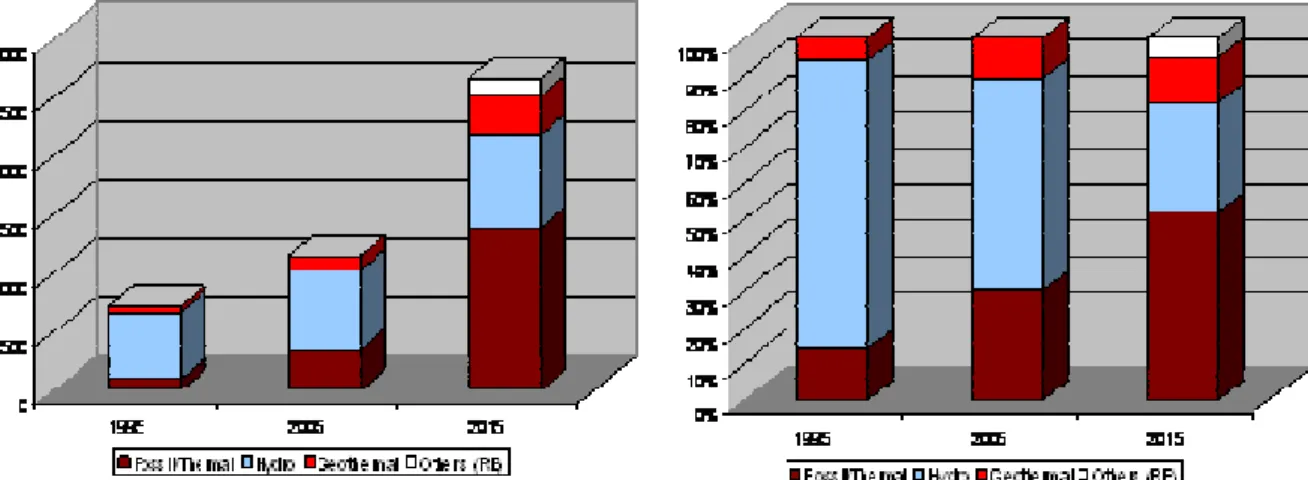
Figure 1.3 shows the trend in power source mix for the years 1995, 2005 and 2015. The 2015 figures were calculated from Least Cost Power Development Plan (PDP) issued by the Ministry of Energy. Considering the current per capita electricity consumption of 121 kWh, and the population’s access to electricity at the national level of 15 %, there is significant room for the capacity and demand to increase in the future.
Figure 1.3: Kenya’s installed generating capacities in 1995, 2005 and 2015 in MWe (left) and in percentage of mix (right)
Source: Data from PDP of Ministry of Energy, 2005
With the trend of increased fossil fuel power plants in the future, the prices of electricity is set to go higher especially in the backdrop of the insecurity linked to fluctuating world oil prices. On the environmental point of view, this certainly leads to more emissions of harmful Greenhouse Gasses.
If the sugar companies and other developers of cogeneration are given the right incentives to exploit the residues generated by the industries to implement additional capacities in order to sell excess power to the grid, cogeneration plants using bagasse and other biomass could partially replace the planned thermal plants using fossil fuel.
Although it is not reflected in the PDP, the Government of Kenya recognizes the potential role of cogeneration in supplying the growing electricity requirements of the country. In Sessional Paper No.4 of 2004 on Energy and Ministry of Energy’s Strategic Plan (2004-2009), the Government undertakes to promote the exploitation and expansion of existing cogeneration capacity in order to improve the diversity of national power supply and save foreign exchange currently used to import fossil fuels for generation of power. This undertaking has further been strengthened by the current trend of escalating fuel prices in the world market hence the government’s greater resolve to assist cogenerators and other independent power producers (IPPs) to secure favorable bulk electricity tariffs and supply related terms. In particular the government intends to:11
• Undertake appropriate studies on cogeneration
• Assess bagasse-based cogeneration potential and use the Least Cost Power Development (LCPD) criteria to implement identified projects.
• Launch medium term bagasse-based cogeneration investment programme
However, until now, there are insufficient incentives given to project owners/developers to implement efficient and high capacity cogeneration systems. The proposed Cogen for Africa Project is expected to assist in helping the government and the private sector in creating the right stimuli and transforming the market conditions so that the aforementioned plans to promote a major cogeneration industry are realized.
On the industry front, developments indicate that this project’s objectives of promoting high pressure cogeneration systems could match well with the activities and plans of the sugar industry. A recent survey and round of discussions with the sugar factories for the preparation of this PDF-B indicated that all the factories have rolled out plans to scale up their sugar crushing capacities as well as incorporate cogeneration, first to ensure power self-sufficiency as well as export to the national grid. For example, SONY Sugar Company has a two-phased programme to increase crushing capacity from 3,000 tons of cane per day to 6,500 and as a result inject 26 MW of electricity to the national grid in the first phase. In the second phase, the company has planned to increase the crushing capacity to 8,000 tons and subsequently be able to export 36 MW to the grid.
In addition to the existing factories that have plans for expansion, Busia Sugar Company which currently owns their own sugar cane plantation and manages around 8,000 farmers (with a plan to increase to 30,000 farmers) is in the advanced stages of establishing a sugar factory with a capacity of 4,200 tons of cane per day. This company plans to incorporate a cogeneration unit with a capacity of 20 MW in the initial phase, if the viability of the project could be ascertained.
11 (Government of Kenya, 2004, 2005)
It is known that in Kenya, about six million inhabitants are directly or indirectly dependent in the sugar industry. With the increased competition due to low sugar prices from other countries and the planned rationalization in the Kenyan sugar industries, cogeneration is a potential important contributor to the competitiveness of sugar sector in Kenya.
It should be noted that Kenya has other agro-industrial residues - an estimated amount of 2.7 million tons annually (Ministry of Energy as cited by Yuko, et. al., 2005) - that could be exploited for cogeneration. Details of their locations and achievable potential could be investigated further during the Project implementation.
Other national and social goals that are met by implementing cogeneration from bagasse and other biomass include:
• The power sector will benefit from additional generation of power from an indigenous source with a price regime that is more stable than oil.
• The energy will replace more expensive imported fossil fuel generation.
• The excess electricity sold to the national grid will improve the revenues and profitability of the sugar factories.
• Farmers will benefit from higher payments for their cane. In addition, they may be able to sell the cane trash for power generation, further increasing their revenues.
• It is expected that this chain of activities will result in more income and jobs (cogeneration could stimulate increased cane acreage) for the 6 million Kenyans directly or indirectly dependent on the sugar sector, and a general reduction in poverty levels.
By creating added value to the sugar cane and particularly to the bagasse and other biomass which are traditionally burned inefficiently or disposed in landfills, numerous commercial, economic, environmental and social benefits would be realized that would enhance national, industrial and individual well being.
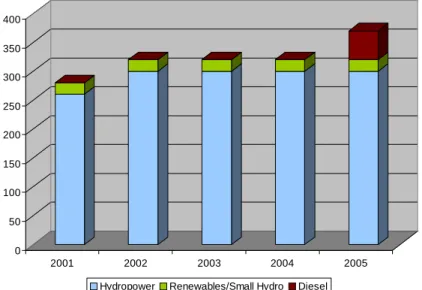
In Uganda, most of the electricity is generated by hydropower stations. The country is estimated to have a total hydropower potential of about 2,700 MW along the Nile River and a further 50 to 100 MW of mini and micro hydropower elsewhere in the country. Out of these, 320 MW of hydropower has been exploited and installed, with 300 MW coming from large hydro plants of Kiira and Nalubale, as can be seen in Figure 1.4 which shows the trend of the installed generating capacity of the grid in Uganda between 2001 to 2005.
However, prolonged drought for the past years as well as other factors12 has resulted in a drop in the Lake Victoria by about 2 meters according to several sources which reduced the effective generation capacity of the Kiira and Nalubale hydropower plants to as low as 190 MW. With a current peak demand estimated at about 330 MW, there is still a deficit of about 100 MW of electricity for the country. This has prompted the government to introduce power rationing and daytime load shedding.
Figure 1.4: Installed generating capacity grid mix (in MWe), Uganda
0 50 100 150 200 250 300 350 400
2001 2002 2003 2004 2005
Hydropower Renewables/Small Hydro Diesel
Source: Data from the Ministry of Energy and Minerals Development, Uganda
Recently, an emergency diesel thermal power plant with a capacity of 50 MW was procured to reduce the power shortage. It is therefore expected that Uganda will implement additional emergency fossil-fuelled thermal power plants which could become a baseline power supply (in the short to medium term) especially if the planned two large
12The Daily Nation, Kenya, January 19, 2006, reported that according to a Tanzanian hydrologist Dr. Raymond Mgodo, the drop in Lake Victoria’s level can be attributed to 3 factors: low rainfall, reduced in-flows from rivers and increased outflow into the Nile River due to increased power generation by Uganda.