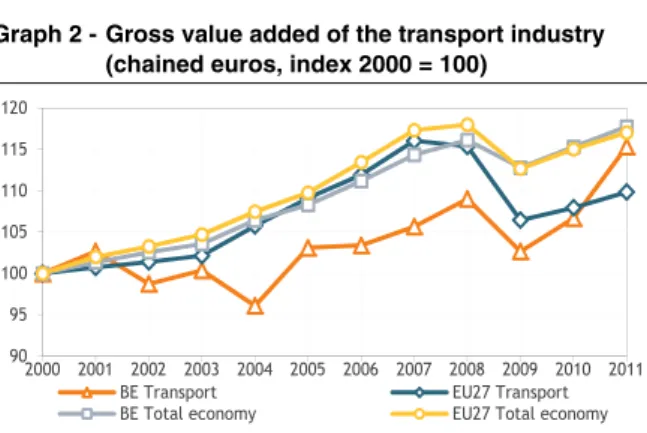
Saving energy (through implementing energy efficiency) is sometimes called the "hidden fuel" (see, eg, Journal of the International Energy Agency, Spring 2013). As transport support activities are the main branch of transport, with a share of GDP of 2.9%, the structure of the Belgian transport industry differs from that of the European transport industry.
RECENT ECONOMIC DEVELOPMENTS
Household expenditure
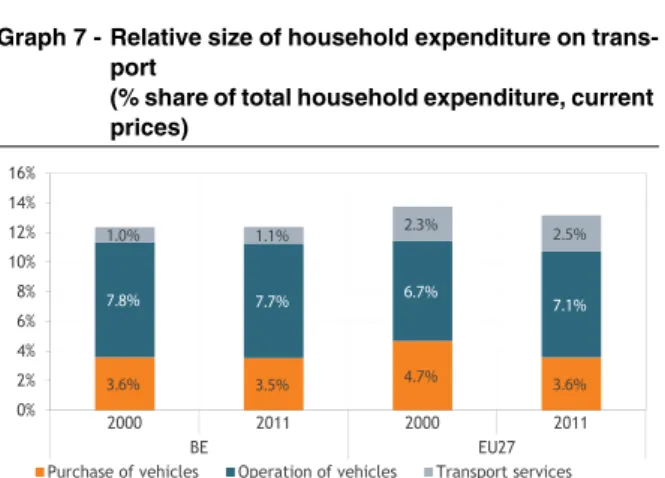
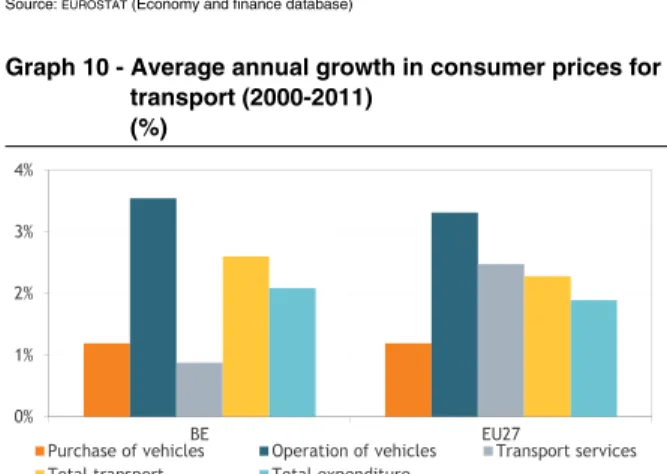
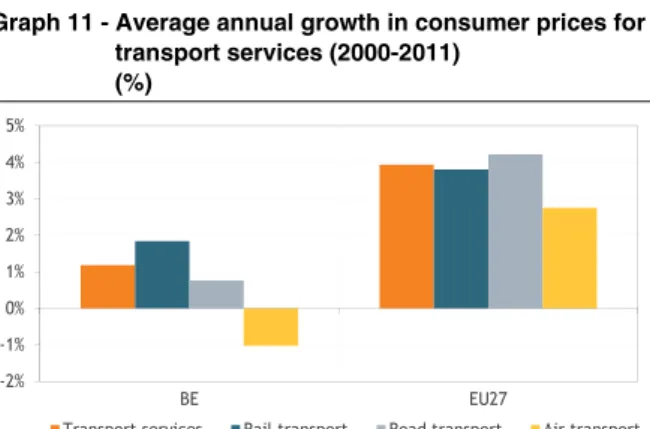
While in Belgium a structural decrease in vehicle operating expenses is observed (-9% between 2000 and 2011), this is not the case for the EU27. Prices for the use of vehicles rose faster than total transport prices: in Belgium by 3.5% per year; in the EU27 at 3.3%. The combination of these two effects resulted in a decrease in the share of 'Vehicle operation' for Belgium and a slight increase for the EU27.
In 2002, Belgian fuel prices were below the average fuel prices in the euro area (EA). Belgian fuel prices rose faster than the euro area average as a result of the introduction of the 'positive clique' system in 2003 by the Belgian government. While the share of passenger cars in the total demand for passenger transport in Belgium fell between 2000 and 2011, it increased in the EU27.
Passenger transport
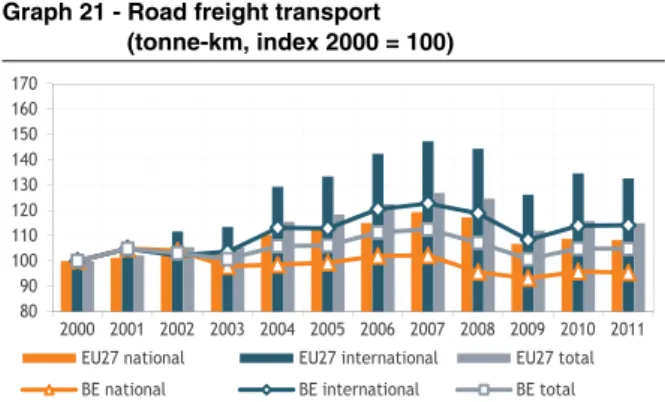
Freight growth in Belgium and the EU27 was limited to 0.4%, significantly lower than GDP growth. The growth of international transport in the EU27 was also significantly higher (+21%) than that within the Belgian territory (+11%). With a share of 55%, international freight transport was already dominant in Belgium in 2000, while the EU27 average reached 35%.
Between 2000 and 2011, the share of international transport increased by 2 percentage points for both Belgium and the EU27. The development of the share of international transport within road transport contrasts with its development for rail and. Road was the dominant form of freight transport, both in Belgium and the EU27, with a modal share of around 75%.
Freight transport
In the same period, Belgian national transport growth was below GDP growth and growth in. International transport's share of Belgian inland shipping fell significantly by 9% points; in the EU27 the decrease amounted to 2 percentage points. Between 2000 and 2011, growth in national transport exceeded international transport growth for railways and IWW, both for Belgium and the EU27.
In Belgium, international rail traffic decreased by 1.5%, while domestic traffic recorded minimal growth of 0.3%. IWW traffic growth in the EU27 was significantly lower than that in Belgium, both for national and international traffic. The reduction in the length of Belgian inland waterways was the result of the reclassification of some parts of the network.
Infrastructure
The main driver of this evolution was the growth of container transport, both in Belgium and the EU15. Already in 2010, the level of container transport in Belgian maritime ports exceeded the level of 2008. With 687,000 tons handled in 2000, the cargo department of Brussels National Airport was one of the top 10 cargo airports in Europe.
In 2011, the volume handled at Brussels Airport stagnated, while Liège Airport recorded a growth of 7%. Of the top four cargo airports, only Paris Charles de Gaulle could present better growth figures. Comparing the length of networks with the surface area of a country gives a good picture of the concentration of networks.
Passenger car stock
The relatively lower share for Belgium was mainly due to the different structure of final energy consumption, as Belgium has a large energy-intensive industrial sector. The smaller share for Belgium is due to the fact that a large proportion of Belgian homes are heated with domestic fuel oil. The sharp increase in 2008 is due to methodological changes in data collection for aviation and road transport.
In terms of energy consumption, road transport was the most important mode of transport, with a share of more than 80% in both Belgium and the EU27. To increase the penetration of biofuels, Belgium uses a quota mechanism, whereby the amount of biofuel that receives support is divided between different suppliers through tenders. In 2011, the share of biofuel in Belgian diesel and petrol consumption still lagged behind the European average.
Transport energy consumption
Reported PM2.5 emissions include fine particles that are less than 2.5 micrometers in diameter. The share of traffic in total emissions depends on the pollutant and is the largest for NOx. For NOx and PM2.5, the share of traffic in total emissions in Belgium was higher than the EU27 average.
With more than half of the electricity produced in nuclear power plants that do not emit NOx or PM2.5, the sector's emissions were much lower than in the EU. The reduction in emissions from transport in the EU27 was greater than the reduction in total emissions, thereby reducing the share of transport in total emissions. For Belgium, the reduction in transport PM2.5 emissions was in line with the reduction in total PM2.5 emissions; it was lower for the EU27.
Transport emissions
This was due to the fact that the growth in the stock of diesel cars in the EU27 was much higher than in Belgium. For Belgium, the reduction in transport PM2.5 emissions was in line with the reduction in total PM2.5 emissions; it was lower for the EU27. number per million inhabitants and per thousand accidents). In terms of population, Belgium is worse than the European average.
The severity of accidents, expressed by the number of fatalities per accident, was significantly lower than the EU27 average (18 fatalities per thousand accidents compared to 28). The EU's goal was to halve the number of people killed on European roads in the period 2001-2010. As Belgium is a cycling nation, the proportion of cyclists among those killed (8%) was higher than the EU27 average (7%).
Road security
When broken down to the scene of the accident, Belgium records deaths above the EU average on motorways and outside urban areas. The first may suggest that the fact that Belgium is a transit country contributes to the higher accident rate. The second may indicate that strip development along major feeder roads contributes to a higher accident rate.
The reduction in the number of fatalities stands in stark contrast to the albeit limited increase in the number of accidents.
RECENT PUBLICATIONS
Regional economic outlook 2013-2018
Generation adequacy outlook for Belgium to 2030
RECE NT P U BLICA T IONS
The evolution of poverty among older people: a closer look
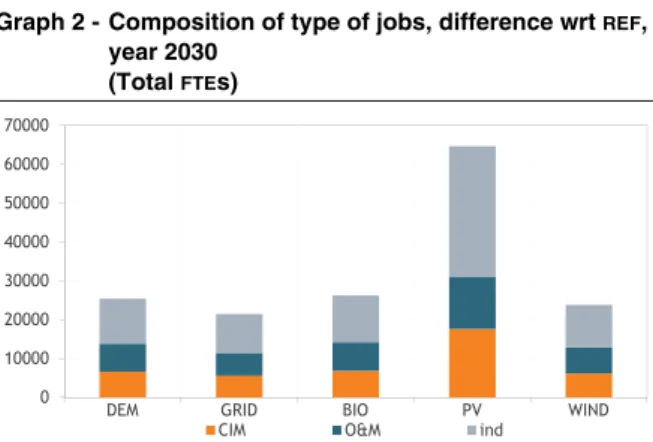
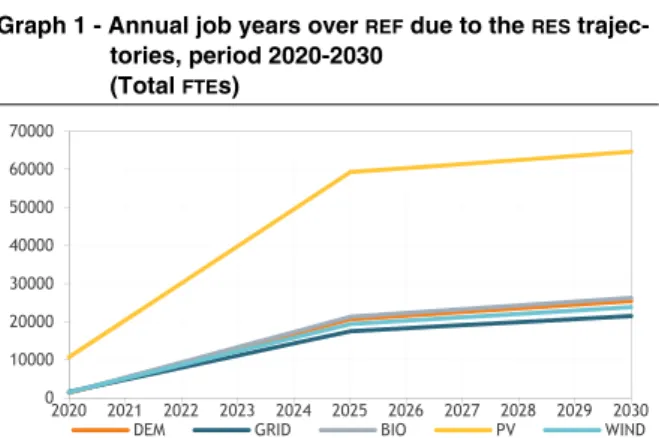
This working paper addresses jobs and job creation through a very specific channel of renewable energy development, linking energy system development to potential job creation opportunities. More specifically, this paper looks at the number of full-time equivalents created by the transformation of the current Belgian energy system, which is largely based on fossil fuels, to a system that would meet 35% of the national primary energy needs through renewable energy sources by 2030. The first obstacle in identifying the employment potential from the development of renewable energy sources is the search for an appropriate definition of the renewable energy sector itself.
Therefore, a literature search is first performed to find an accurate definition of the sector and to pave the way for further understanding. The results show that net job growth can be expected as society transitions from a fossil fuel-based energy system to one in which approximately one-third of primary energy needs are covered by renewable energy sources: the renewable pathways all create more full-time equivalents (FTE) than the fossil-based reference. At the end of the paper, a number of reflections on jobs and job content emerge.
Walking the green mile in employment: employment projections for a green future
The input-output analysis developed in the other papers consists of calculating the cumulative cost structures of the industries. This study aims to provide a detailed analysis of the output, income and employment multipliers of final demand in Belgium for the year 2005 as well as an analysis at constant prices of their evolution over the period 1995-2005. In 2005, the output multiplier of the Belgian economy was 1.58 and the average simple income multiplier was 0.70.
This indicates that the output of the entire economy had to increase by EUR on average. They represent a measure of the interdependencies between industries and indicate the industries with the most ties to other industries. Finally, the analysis of the evolution over time of output multipliers can provide information about structural shifts in the organization of business production processes.
Input-output analyses for 1995, 2000 and 2005 at constant prices
Through a process of an intermediate supply chain, the industry classification in this analytical form of the input-output table (IOT) collects the direct and indirect value added created in all industries, as well as the intermediate imports of all industries. starting from the supplies for the final demand of a given industry. In 2005, distribution services, business services and real estate were among the main direct and indirect beneficiaries of a change in final demand for various products of the economy, reflecting the tendency for companies to provide a whole range of services. At the level of the six main industries of the economy, the manufacturing industry provides the largest analytical contribution to GDP, which widely exceeds its traditional contribution.
The decrease in the amount of primary inputs manifests itself in all components of final demand. This trend is also reflected in all components of final consumption of domestic production. Compared to 1995, the energy intensity of the total economy decreased (from 6.6% to 6.3%) due to a reduction in the intensity of primary energy inputs, which exceeded the increase in imported intermediates and applied to all final demand components, excluding government consumption (which registered a small increase in energy intensity).
Other Recent Publications
Maatregelen in 2012 in de pensioensectoren: evaluatie van de effecten van het genre / Maatregelen genomen in 2012 op het gebied van werkloosheid en pensioenen: evaluatie van de effecten per geslacht”. Compétitivité de la Belgique - Défis et pistes de croissance / Concurrentievermogen van België - Uitdagingen en groeipaden”. Analyse van de impact van subsidiabiliteits- en financiële maatregelen gericht op het uitstellen van vervroegd pensioen in België: een "difference-in-differences"-benadering met behulp van panelgegevens”.
Verbruikerspryse in België en sy buurlande: Beleidskwessies / Consumer prices in Belgium and its neighbouring countries: Policy issues”,. Die omgewingsimpak van die evolusie van vervoervraag na 2030 / L'impact sur l'environnement de l'évolution de la demande de transport à l'horizon 2030". Perspectives de l'evolution de la demande de transport en Belgique à l'horizon 2030 / Prospects of transport demand in Belgium by 2030", D.
RESEARCH IN PROGRESS
Research in progress
ECONOMIC POLICY MEASURES
Recent history of major economic policy measures