MS2850A Signal Analyzer User Manual (Mainframe Operation) or MS2830A Signal Analyzer User Manual (Mainframe Operation). Signal Analyzer User Manual (Signal Analyzer Function Remote Control) MS2830A/MS2840A/MS2850A Signal Analyzer User Manual (Signal Analyzer Function Operation) Or.
Features of Spectrum Analyzer
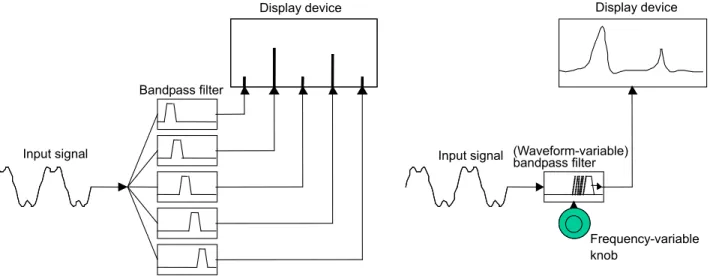
The super heterodyne method, which is one of the methods that can be used to implement a sweep-type spectrum analyzer, is. The input signal from external sources passes through an input circuit consisting of an attenuator and a preselector, and is mixed by a mixer with the local oscillator signal.
Basic Operation
Display Description
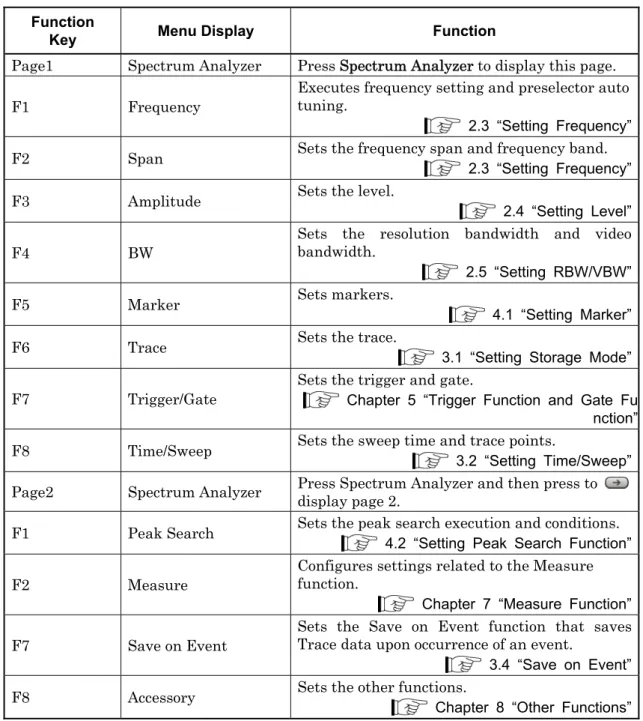
This section describes the main screen and main function menus of the Spectrum Analyzer function. Pressing when the Spectrum Analyzer function is selected in the Application Switch menu displays the main function menu.
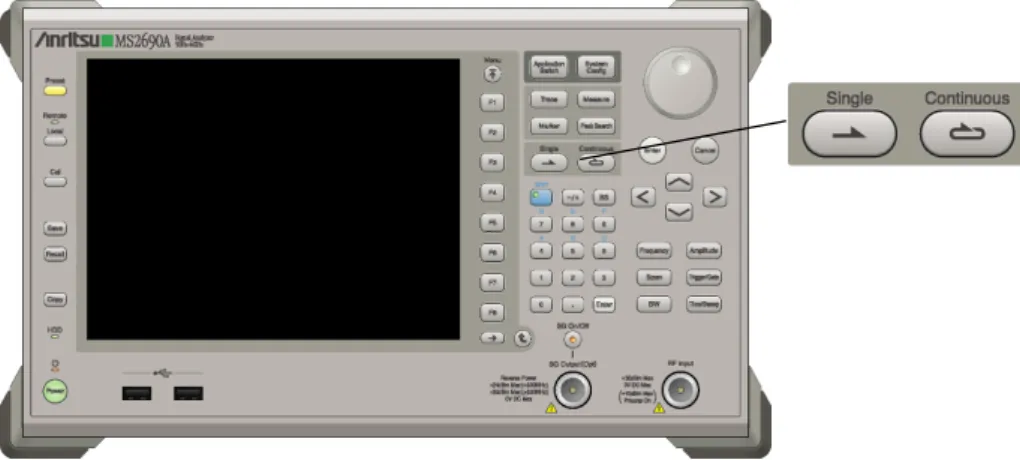
Single/Continuous Sweep
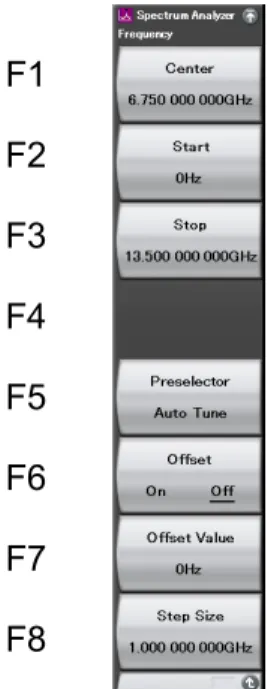
Setting Frequency
- Setting center frequency
- Setting frequency span
- Setting start frequency
- Setting stop frequency
- Setting frequency offset
- Changing frequency band
- Setting Whether To Couple Time Domain Parameters and Frequency Domain Parameters
- Setting step size
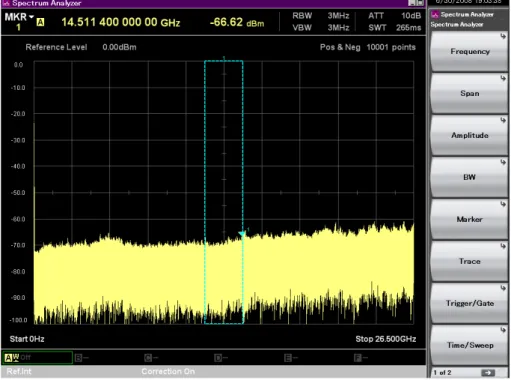
The lower cutoff frequency of the preselector can be changed from 6 GHz to 3 GHz by changing the frequency band mode. Off RBW, VBW, detection mode and trace point for the time domain are separate from those for the frequency domain.
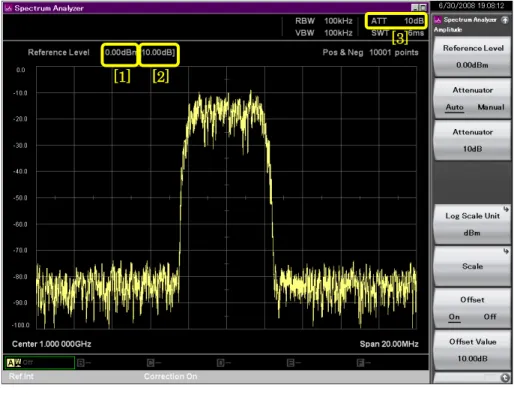
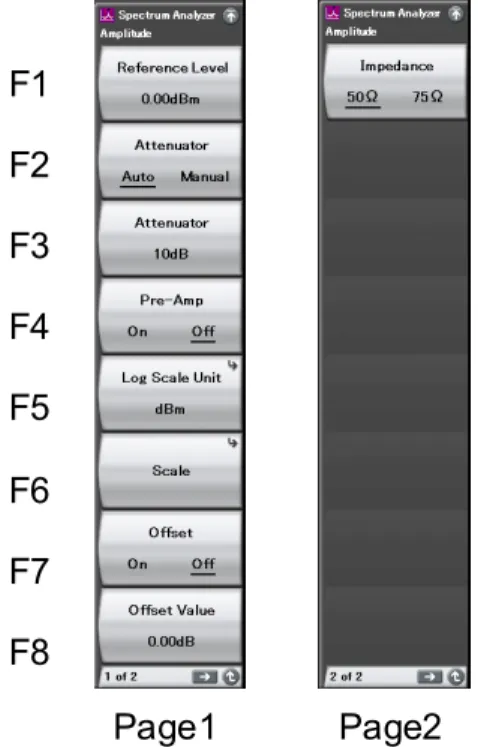
Setting Level
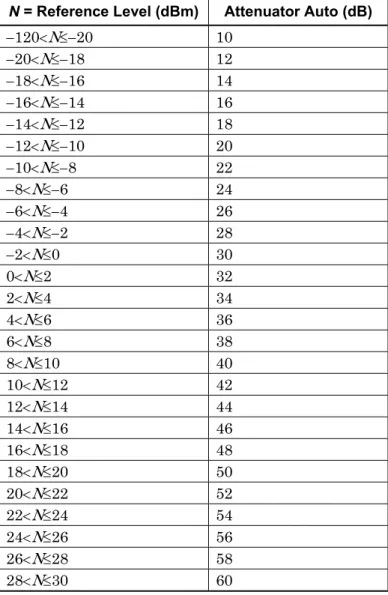
- Setting reference level
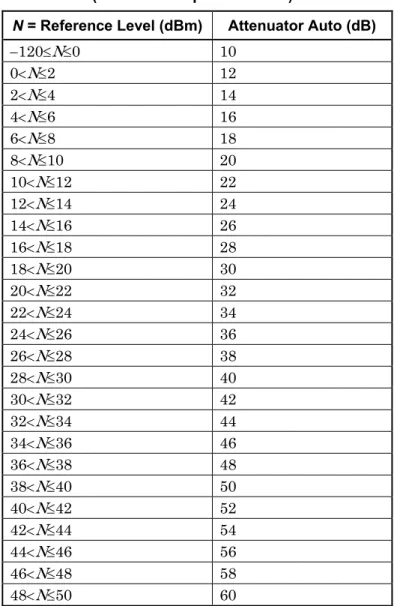
- Setting input attenuator
- Setting scale
- Setting reference level unit
- Setting reference level offset
- Pre-amp
- Setting impedance
- Microwave Preselector Bypass
When a signal of the same level as the reference level is input, the input level to the internal mixer is set to become 10 dBm or lower. The converter loss can be corrected using the Correction function and reference level adjustment setting.
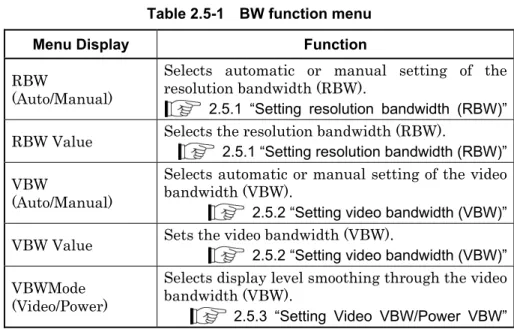
Setting RBW/VBW
- Setting resolution bandwidth (RBW)
- Setting video bandwidth (VBW)
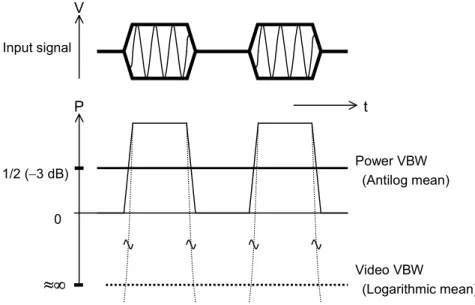
- Setting Video VBW/Power VBW
The video bandwidth is set to the same as the resolution bandwidth (RBW) or the closest value. By setting the video bandwidth to a value smaller than the resolution bandwidth (RBW), noise averaging is more efficient.
Display Mode Selection
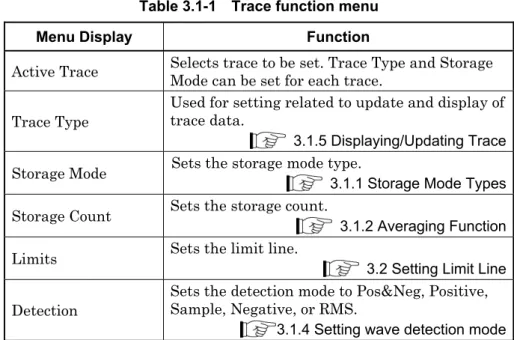
Setting Storage Mode
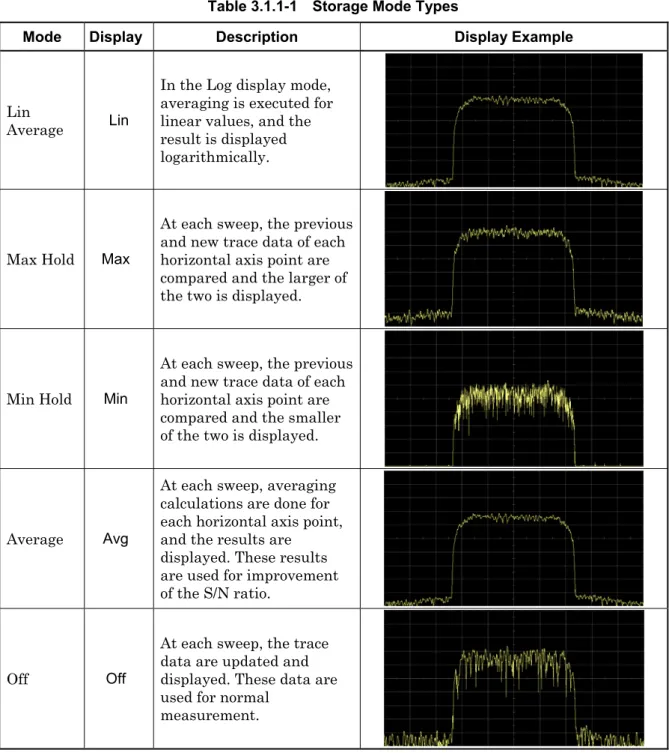
- Storage mode types
- Averaging function
- Max Hold/Min Hold function
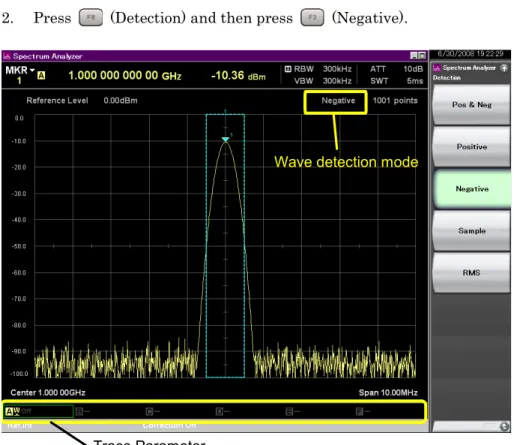
- Setting wave detection mode
- Displaying and updating Trace
Each sweep compares the previous and new trace data of each horizontal axis point and displays the larger of the two. Each sweep compares the previous and new trace data of each horizontal axis point and displays the smaller of the two.
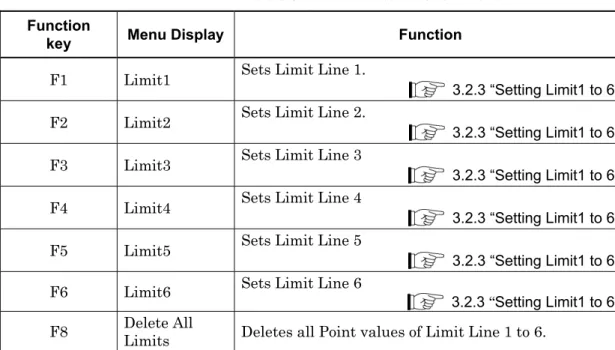
Setting Limit Line
- Setting Limit function parameters
- Setting Limits
- Setting Limit1 to 6
- Edit parameters
- Limit Envelope Function
- Saving a Limit file
- Loading a Limit file
Selecting (Limit1) to (Limit6) in the Limits function menu displays the Limit1 to Limit6 function menu. The figure below shows a boundary line (—) and a boundary point (○) that are automatically created in relation to track points (●), peak values for track point values (←→), and offset values. In the Save Limit function menu, you can save the Limit Line settings to a file.
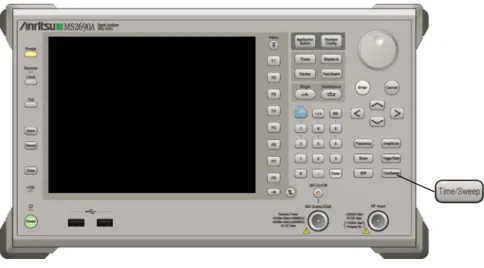
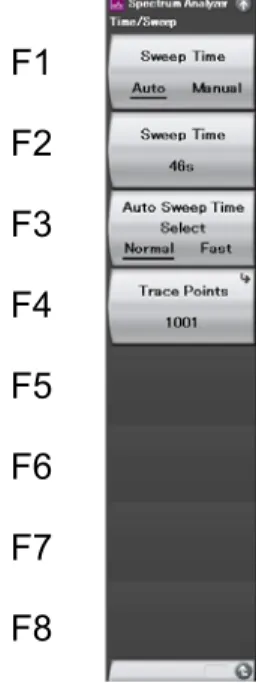
Setting Time/Sweep
- Setting sweep time
- Setting trace point
Each parameter is specified according to the already specified frequency axis or time axis measurement. When the sweep time is set to Auto, normal mode (normal sweep)/fast function (fast sweep) can be set. When Couple Time/Frequency Domain is set to Off, each parameter is specified according to the already specified frequency axis or time axis measurement.
Save on Event
- Setting Save on Event
- Waveform files for Save on Event
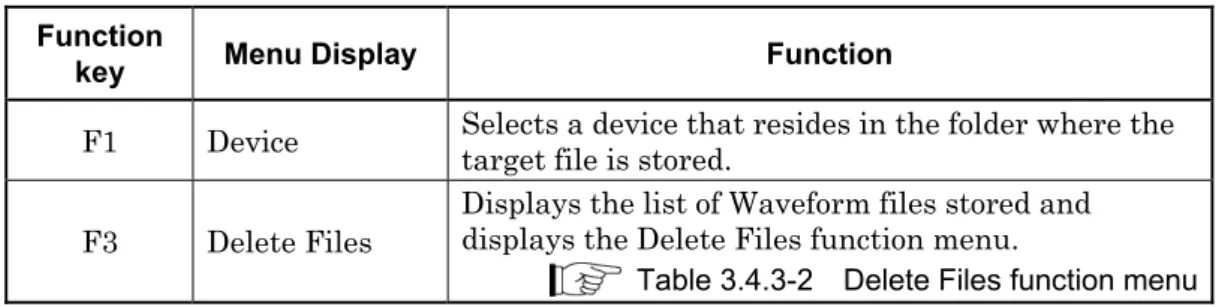
- Deleting Waveform files for Save on Event
This menu is used to set the file name (underlined part of the following) which is internal data of a waveform file to be saved as Folder.csv when the Save on event function is executed. This section describes waveform files that must be saved when the Save on Event feature is turned on. After setting the parameters, a folder is created with the name, including a timestamp of measurement start.
The recall function menu is displayed by pressing when the spectrum analyzer screen is active. Table 3.4.3-1 The waveform file recall function menu is displayed by pressing (Waveform file recall) in the recall function menu. In the Recall Waveform File function menu, you can select Save on Event Waveform files you want to delete.
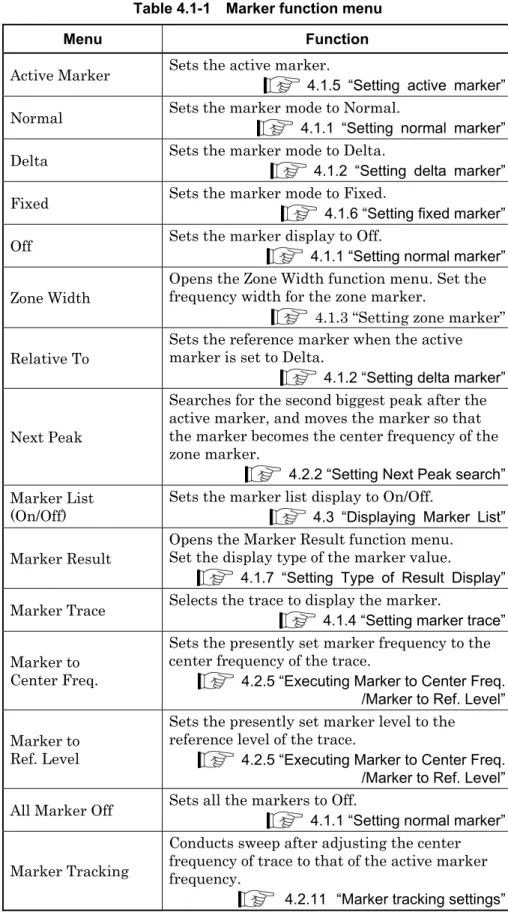
Marker Function
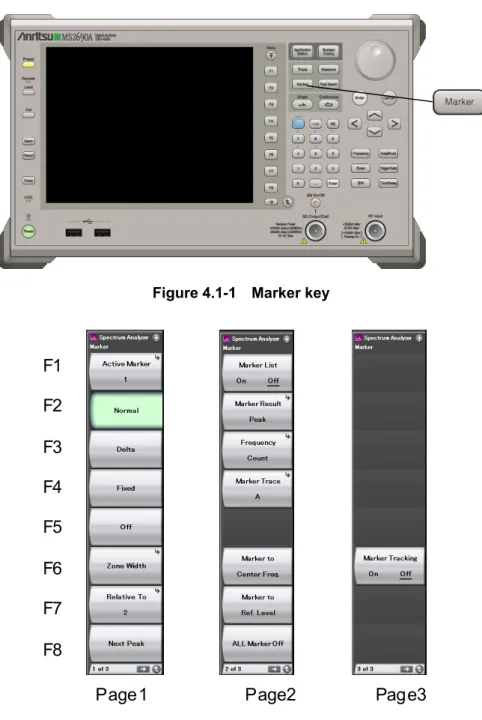
Setting Marker
- Setting normal marker
- Setting delta marker
- Setting zone marker
- Setting marker trace
- Setting active marker
- Setting Fixed marker
- Setting Type of Result Display
- Setting Freq. Count
Searches for the second largest peak after the active marker and moves the marker so that the marker becomes the center frequency of the area marker. Press to display the second page of the Marker function menu, then press (ALL Marker Off) to set all markers to Off. The frequency and level in the marker are displayed as values relative to the reference point (the marker set by Relative To).
If the marker set by Relative to is set to Off when this function is executed, the marker is set to a Fixed marker and is displayed as on the trace. Press (Marker Result) on page 2 of the Marker function menu to display the Marker Result function menu. Press to move to page 2 of the Marker Function menu, then press (Marking Result).
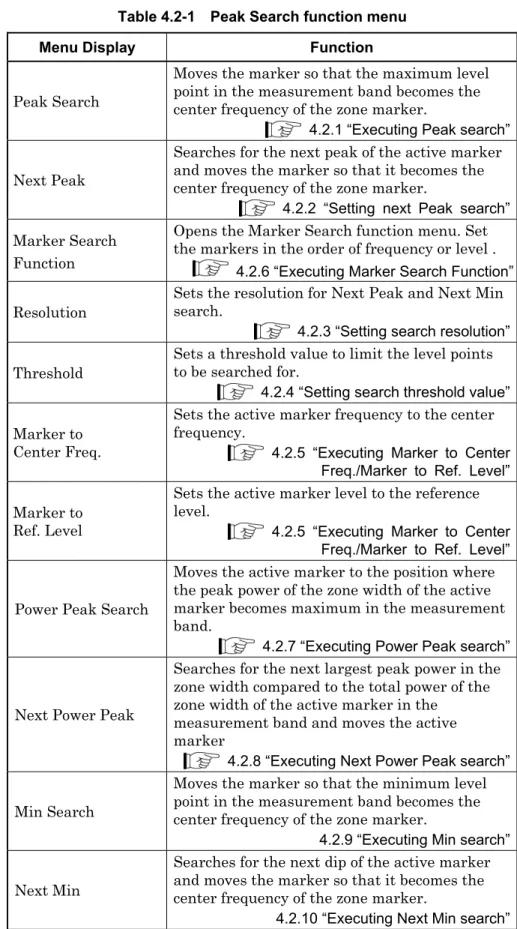
Setting Peak Search Function
- Executing Peak search
- Executing Next Peak search
- Setting search resolution
- Setting search threshold value
- Executing Marker Search Function
- Executing Power Peak search
- Executing Next Power Peak search
- Executing Min search
- Executing Next Min search
- Marker tracking settings
Move the marker so that the maximum level point in the measurement band becomes the center frequency of the zone marker. Search for the next peak of the active marker and move the marker so that it becomes the center frequency of the zone marker. Move the marker so that the minimum level point in the measuring tape becomes the center frequency of the zone marker.
Searches for the next dip of the active marker and moves the marker to become the center frequency of the zone marker. This command moves the cursor so that the minimum level point in the measurement band becomes the center frequency of the zone cursor. This command searches for the next dip of the active marker and moves the marker to become the center frequency of the zone marker.
Displaying Marker List
Trigger Function and Gate Function
Setting Trigger Function
Pressing (Trigger/Gate) from the main function menu or pressing displays the Trigger function menu.
Page 2 F1
Trigger sweep
An IF signal is detected with a wide passband of approximately 50 MHz and the sweep begins in sync with the rise or fall of the detected signal. Setting range and resolution for trigger level (wide IF video trigger) Setting range: 60 to +50 dBm. Sweep starts in sync with the rise or fall of the signal input through the Trigger Input connector.
Sweep starts in synchronization with the rise or fall of the cursor signal output from Option 020. For cursor signal settings, refer to the MS2690A/MS2691A/MS2692A Option 020 Vector Signal Generator Operation Manual (Operation). Sweep starts in sync with the rise or fall of the trigger signal output from Option 040.
Setting Gate Function
- Gate sweep
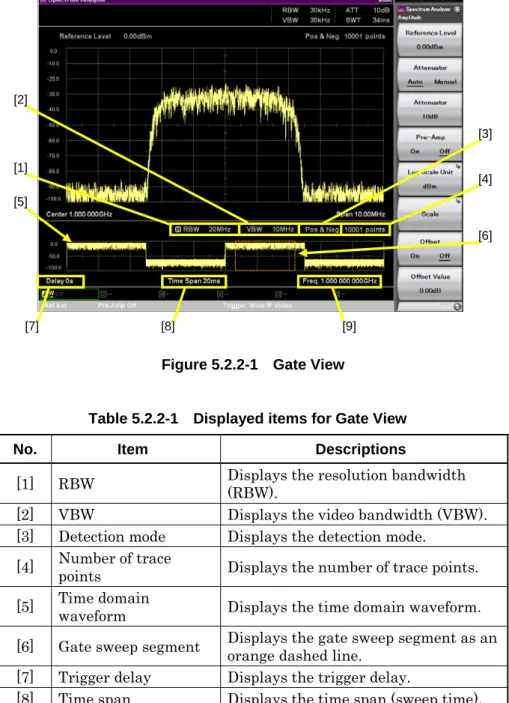
- Gate View
The center frequency for the frequency domain is set when Auto (the automatic setting) is selected. The frequency domain reference level is set and this menu item is disabled when Spurious Emission is set to Off. Selects the automatic setting or manual setting for the attenuator when Spurious Emission is set to On.
The frequency domain attenuator setting mode (Auto or Manual) is selected and this menu item is disabled when Spurious Emission is set to Off. The frequency domain attenuator is set and this menu item is disabled when Spurious Emission is set to Off. The frequency domain Pre-Amp On/Off setting is set and this menu item is disabled when Spurious Emission is set to Off.
Preselector Tuning Function
Preselector Tuning Function
- Preselector auto tuning
- Preselector manual tuning
The MS2691A/MS2692A uses a preselector to remove unwanted responses such as image response and multiple responses so that only the true signal is represented on the screen. To perform correct adjustment with the preselector, it is necessary to perform peaking bias adjustment. When the MS2691A/MS2692A is adjusted before shipping, peaking bias adjustment is not required for normal use.
However, if the tuning frequency is incorrect, the reception level decreases, so a function for adjusting the tuning frequency of the preselector (preferential tuning function) is provided to enable obtaining the highest possible response. Frequency band mode is unlikely and signal frequency is ≤ 4.0 GHz Example: To perform preselector automatic tuning when the measurement signal. Use dial or cursor key to set the peak bias to maximize the signal indication level.
Measure Function
Selecting Measure Function
By pressing (Measure) on page 2 of the main function menu, or by pressing to display the Measure function menu. When the function menu of a measurement function is entered when other than OFF is selected, the parameters are automatically loaded according to the communication method.
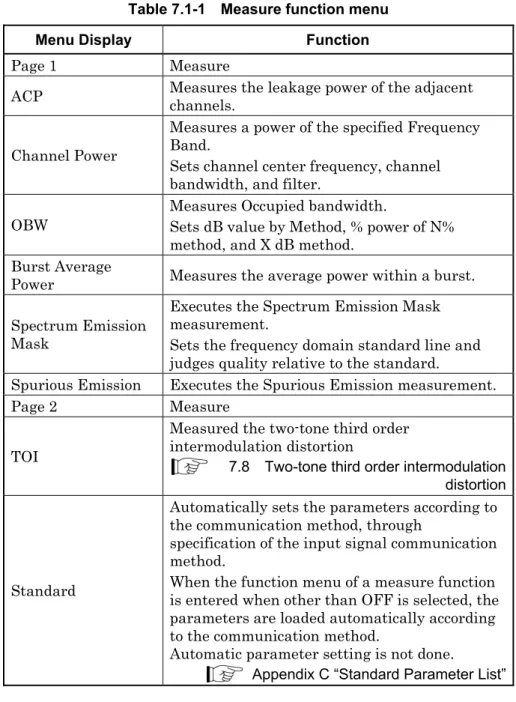
Adjacent Channel Leakage Power Measurement (ACP)
The carrying capacity of the largest carrier number is used as a reference for the upper offset, while the carrying capacity of the smallest carrier number is used as a reference. Carrier power is displayed when Carrier is selected, Offset Channel power is displayed when Ofs. The display items for the measurement results when Power Result Type is set to Offset are described below.
Shows the carrier effect on both sides when "ACP Reference" is "Both Sides of Carriers". Shows the effect of the Offset Channel bandwidth using Offset-1 to -3 as the center and the relative values to the reference effect selected in the ACP reference. The display items for the measurement results when the Power Result Type is set to Carrier are described below.

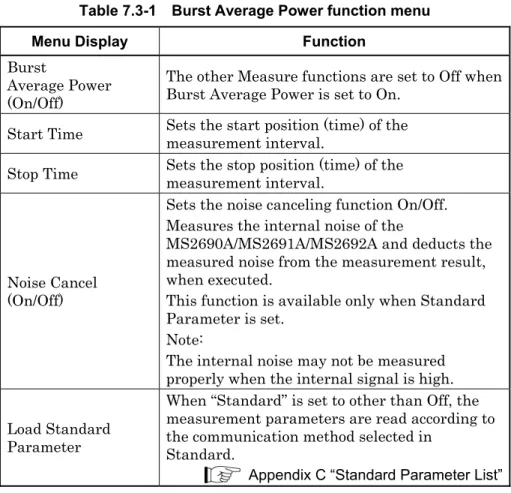
Burst Average Power Measurement
The other metering functions are set to Off when Burst Average Power is set to On. If "Default" is set to anything other than Off, the measurement parameters are read according to the communication method selected in . Power Shows the average power of the interval specified with Start Time and Stop Time.
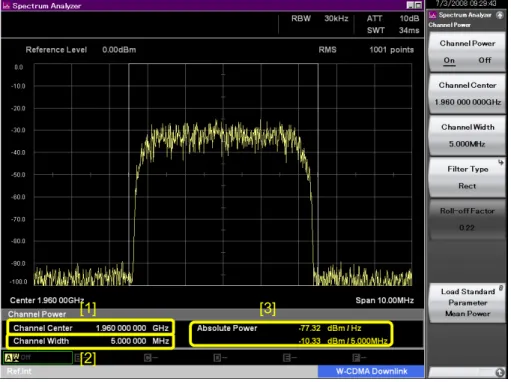
Channel Power Measurement (Channel Power)
3] Absolute Power Displays the absolute power at 1 Hz within the channel band and the integral power within the channel band.
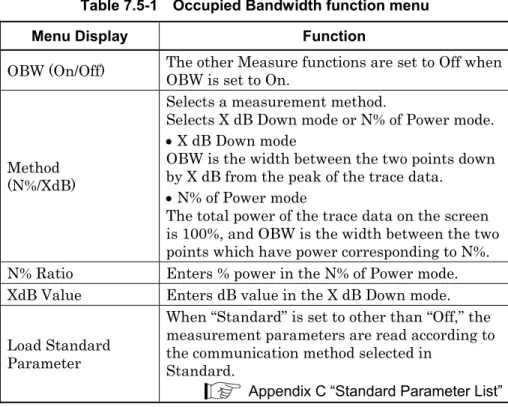
Occupied Bandwidth Measurement (Occupied Bandwidth)
OBW (on/off) Other measurement functions are set to off when OBW is set to on. OBW is the width between two points down X dB from the peak of the trace data. The total power of the trace data on the screen is 100%, and OBW is the width between two points whose power corresponds to N%.
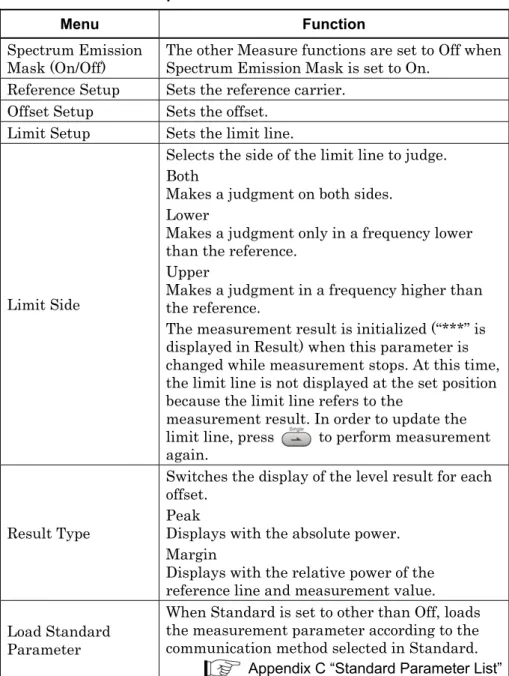
Spectrum Emission Mask Measurement (Spectrum Emission Mask)
If Auto is selected, this is the same value as the reference level when measuring the reference power. AND Judgment” is a method to merge the two reference lines and judge the lower level as a reference line. OR assessment” is a method of combining the two reference lines and assessing the higher level as a reference line.
Spurious Emission Measurement
Page 2 Page 3
Two-tone Third Order Intermodulation Distortion
By inputting two CW signals of different frequency (desired waveforms), the third-order two-tone intermodulation distortion is generated close to the desired waveforms according to the nonlinear characteristics of the DUT. The TOI (Third Order Intercept) is then calculated from the two-tone third-order intermodulation distortion. Enables and disables the function of performing a peak search in the vicinity of the frequency at which IM3 occurs, calculated from two CW signals, and then considers the peak detection frequency as the IM3 frequency.
Two-tone third-order intermodulation distortion occurring at the lower frequency of the desired wave. Two-tone third-order intermodulation distortion occurring at the upper frequency of the desired wave.

Other Functions
Selecting Other Function
Setting Title
Deleting Warmup Message
Setting Uncal Message
Adjusting Internal Reference Frequency Signal
Input Source for Reference Frequency Signal
Pre-Amp On/Off Display