Each component of the HDI is closely related to a particular phase in the life cycle. The first component extracted by a principal component analysis accounts for a maximum amount of total variance in the observed variables. First, this component will account for a maximum amount of variance in the data set that was not accounted for by the first component.
The observed variables are standardized during the analysis, that is, each variable is transformed so that it has a mean of zero and a variance of one. Since they have been standardized to have a variance of one, each observed variable contributes one variance unit to the "total variance" of the data set. Therefore, the total variance in a principal component analysis will always be equal to the number of observed variables being analyzed, and the components extracted in the analysis will partition this variance.
As a result, component 2 should explain much of the variability in satisfaction with income items. In the next exercise we provide a brief description to increase depth with sector-specific splits. As we saw in the explanation of the PCA methodology, components that explain a larger part of the variance appear first. i).
This type of component will present a negative sign in the correlation with measures of life satisfaction. iii).
The Formation of Perceptions on Human Development in Latin America
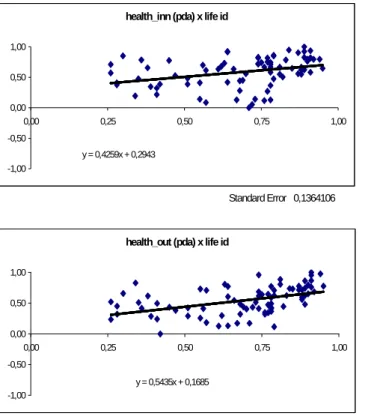
Once again, extrinsic components are less sensitive to age than intrinsic components and even less than the income sensitivity discussed above. The most direct impact of age on perceptions is seen on the internal health components, which can be thought of as the perception of the life cycle itself. Both internal health components move from 1 between the ages of 16 and 20 to 0 in the so-called third age (at age 60).
The main difference is that perceptions about more permanent health problems deteriorate more after this age period reaching -1.5 around age 80, while the other perception of internal health is about -0.27 at this age. The external health perception component is much more stable than the internal health perception components. If there is any slight improvement in external health after age 50, this may indicate that more intensive users of health services have more positive perceptions.
The internal working conditions component presents a hump-shaped life cycle format similar to the Franco Modigliani story. It crosses the horizontal axis of the zero-internal work PHDI – equal to the average perception of El Salvadoran working conditions – at ages 21 and 68. There is a kind of plateau between the ages of 30 and 55 where the index is always above 0.8. .
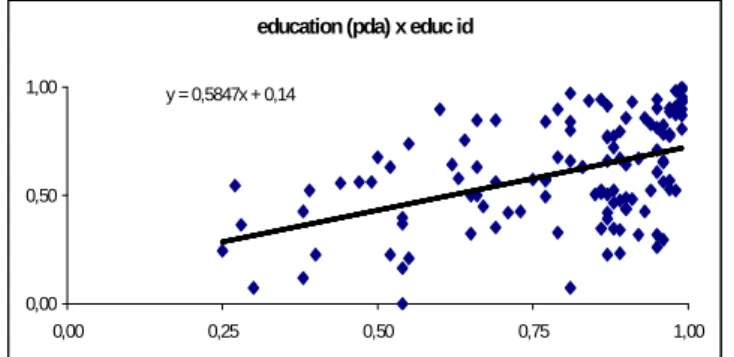
Speaking of outward perceptions about working conditions, the worst level – around 0.4 – is observed among middle-aged individuals, while the peak perceptions are reached by younger or older individuals – of 0.6 around the ages of 20 and 77. Perceptions of outdoor education do not show a clear trend, but fluctuate between 0.45 and 0.65 until age 68 and increase slightly later in life, reaching a peak of 0.68 around age 77. In contrast to outward health perceptions, those with less access to the service have better perceptions of outward education.
3 The reader can analyze similar results for each of the main questions related to the PHDI for LAC and the questions that are available for the world in Annex 1.
The Formation of Perceptions on Human Development in the World
Life-Satisfaction and the Subjective Weights of the Human Development Components
It was a proven finding5 that some countries that experienced a drastic increase in real income since World War II did not see an increase in the population's self-reported subjective well-being, which even fell slightly. Angus Deaton (2007) using World Gallup data not only challenges some more or less well-established interpretations of previous empirical literature, in particular that. The theoretical and empirical frameworks of Deaton's work are quite useful for the purposes of this paper.
Deaton's (2007) article does not refer directly to the HDI, the empirical specification of the determinants of life satisfaction not only uses the main variables of the original HDI, such as GDP per capita and life expectancy, but also the functional form used in the. Estimation of a “happiness function” using aggregated HDI components as explanatory variables and constraints that sum to one in a restricted linear least squares framework will allow an estimate of the relative weights attributed to income, health, and education in subjective well-being. The question of satisfaction with current and past life includes an 11-point scale from 0 to 10 and will be described in more detail in the next part of the paper.
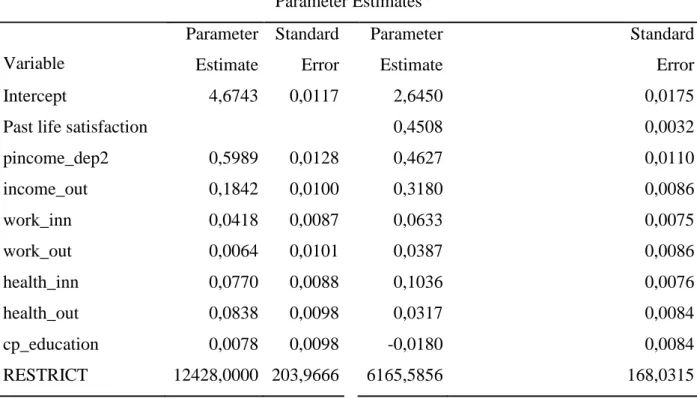
The results of the regression in Table 7 without lagged variable show a weight of 66% attributed to GDP, 31% to life expectancy, 2.2% to gross enrollment rates and 0.3% to the literacy indicator. Similarly, we examine the weights given to each of the three components in the PHDI framework common to the HDI sector-specific indicators that are its income, health and education, applicable to the current life satisfaction criteria mentioned in the previous subsection. To be sure, we first estimate a micro-level restricted linear least-squares regression in both endogenous and explanatory variables taking into account observed components on income, health and education described in the previous section of the paper.
The results of the regression without lagged variable shown in Table 8 show a weight attributed to perceptions of internal income is 64%, perceptions of external income 17.6%, internal health is 8.9%, health of external 9.1% while external education has a zero weight. These results suggest that the sum of the weights given to each of them is not so far in the order of magnitude from those estimated by the objective indicators of the HDI with most of the weight attributed to income (66% here 82% ), health (there 31% here 18%) and education (there are less than 3% here 0%). The results of the restricted linear square regression again without lagged variable presented in Table 9 show a weight attributed to internal work as 4.1%, external work practically 0%, internal perceptions of income is 60%, perceptions external income 18.4%, internal health is 7.7%, external health 8.3% while external education again represents a zero weight.
The study of satisfaction with life has an intrinsic interest as well as other motivations, such as the evaluation of alternative economic policies and the resolution of empirical puzzles of the economy. The release of the new data from the Gallup World Poll covering more than 132 countries has expanded the geographical horizon of this discussion and also allows us to gauge people's perception regarding different sectoral social policies. The first objective of the paper is to build a Perceived Human Development Index (PHDI) framework by compiling the HDI components, namely indicators on income, health and education on their subjective version.
The results of the regression show that a weight attributed to intrinsic income perceptions is 64%, extrinsic income perceptions 17.6%, intrinsic health is 8.9%, extrinsic health 9.1%, while extrinsic education has a zero weight. Healthp2 If you had to go to hospital due to an accident or illness, who would take care of the costs of your assistance.
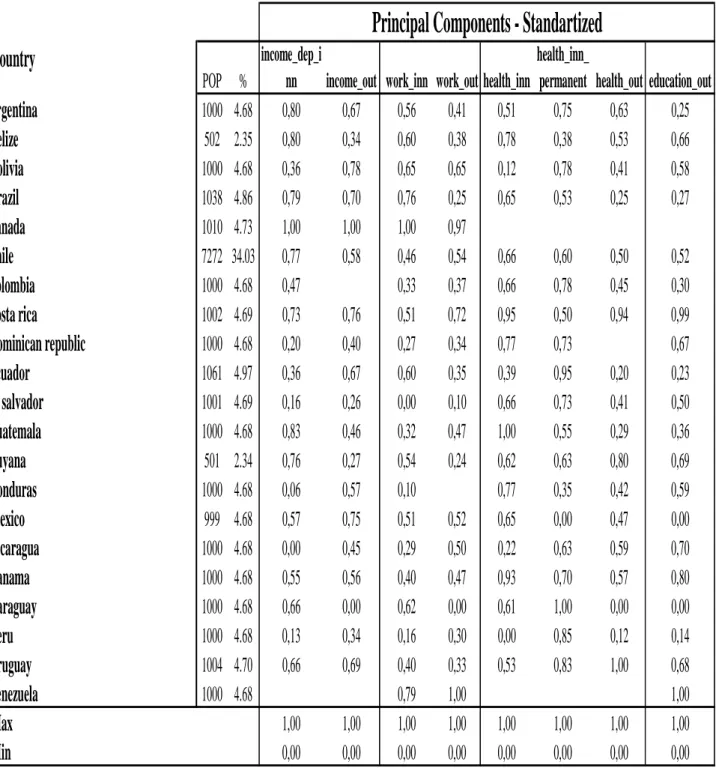
Principal Components - Standartized
Country
POP %
Standardized Principal Components and Per Capita Household Income Percentiles (PPP Adjusted) - Centered Moving Average 5 Percentiles. The Life Cycle Pattern of the Perceived Human Development Index Components - Latin American Countries Standardized Principal Components and Age Years (centered moving average of 5 years).