To appear in: Renewable Energy Received date : 13 September 2022 Revised date : 21 March 2023 Accepted date : 30 March 2023
Please cite this article as: P. Metzger, S. Mendonça, J.A. Silva et al., Battery innovation and the Circular Economy: What are patents revealing?,Renewable Energy(2023), doi:
https://doi.org/10.1016/j.renene.2023.03.132.
This is a PDF file of an article that has undergone enhancements after acceptance, such as the addition of a cover page and metadata, and formatting for readability, but it is not yet the definitive version of record. This version will undergo additional copyediting, typesetting and review before it is published in its final form, but we are providing this version to give early visibility of the article.
Please note that, during the production process, errors may be discovered which could affect the content, and all legal disclaimers that apply to the journal pertain.
©2023 The Author(s). Published by Elsevier Ltd. This is an open access article under the CC BY-NC license (http://creativecommons.org/licenses/by-nc/4.0/).
Jour
nal
Pr
e-pr
oof
Battery innovation and the Circular Economy: What are patents revealing?
Philipp Metzgera, Sandro Mendonçab, José A. Silvac, Bruno Damásioa,∗
aNOVA Information Management School (NOVA IMS), Universidade Nova de Lisboa, Campus de Campolide, 1070-312 Lisboa, Portugal
bISCTE Business School, Business Research Unit (BRU-IUL), Avenida das Forças Armadas, 1649-026 Lisboa, Portugal; UECE/REM – ISEG/ University of Lisbon, Rua do Quelhas 6, 1200-781 Lisboa, Portugal; SPRU, University of Sussex, Falmer, Brighton BN1
9RH, UK
cInstituto Dom Luiz, Faculdade de Ciências da Universidade de Lisboa, Campo Grande Edifício C1, Piso 1, 1749-016 Lisboa, Portugal
Abstract
This analysis of over 90,000 secondary battery innovations (measured by in- ternational patent families) provides a comprehensive account of the long-run progress of a knowledge base with a key role in the transition to a transfor- mative, closed-loop, Circular Economy. Innovation accelerated globally from 2000 to 2019, a sustained dynamic mostly originating in Asia. Patterns of less toxicity and more diversity in technological trajectories are detected and found to bear evidence of pro-circularity. We find a number of emergent technological trajectories, such as solid-state, lithium-sulfur, redox-flow and sodium-ion bat- teries, each one with a different potential to push ahead the circularity pathway, and which allow for the detection of country clusters. Through a methodology that can be of interest for further research, we examine the extent to which batteries have circular characteristics.
Keywords: Secondary batteries, patents, technometrics, text mining, circular economy
∗Corresponding author, [email protected]
Preprint submitted to Renewable Energy April 8, 2023
Jour
nal
Pr
e-pr
oof
1. Introduction
1
Since the early days of the first Industrial Revolution in the late 18th century,
2
global energy consumption has been on the rise (Smil (2018)). Two centuries
3
later, by the time the informational revolution was taking hold (Freeman et al.
4
(2001); Louçã et al. (2023)), the pressure was on to reduce CO2 emissions derived
5
from the coal and oil paradigms that preceded it. New socio-technical compacts,
6
from the Rio “Earth Summit" of 1992 to the Paris Agreement of 2015, have
7
been fostering a holistic reform of social organisation and of the energy sector
8
in particular. To structure this process of change there is a growing need for new
9
solutions in terms of power generation, distribution, storage, and upkeep. In
10
this context, the Circular Economy framework has been proposed to reconcile
11
economic and sustainable development (Stephan et al. (2017); Nikolaou and
12
Tsagarakis (2021)).
13
The importance of batteries has been growing as a solution in a very dynamic
14
puzzle. As a set of technologies at the intersection of the clean-digital transition,
15
their role is expected to grow further in the coming decades (Yildizbasi (2021)).
16
A report about electricity storage developments published by the International
17
Energy Agency (IEA) in association with the European Patent Office (EPO),
18
asserts that “the level of deployment and the range of applicability of batteries
19
[...] expands dramatically" in the foreseeable future (IEA and EPO, 2020, p.
20
28). In particular, battery technologies will move beyond consumer appliances
21
and into industrial-size types of equipment: “Charging batteries in electric vehi-
22
cles will become the largest single source of electricity demand, accounting for
23
around 5%of global demand by 2050" (IEA and EPO, 2020, p. 29). Further-
24
more, “the use of batteries in stationary energy storage applications is [already]
25
growing exponentially" (IEA and EPO, 2020, p. 32).
26
Identifying and monitoring the rate and direction of battery innovation as
27
a condition for a low-carbon future is thus analytically worthwhile and strate-
28
gically urgent. A growing body of empirical work has recently approached the
29
battery industry from an innovation studies perspective (see Aaldering et al.
30
2
Jour
nal
Pr
e-pr
oof
(2019),Alochet et al. (2022), Block and Song (2022a), Murmann and Schuler
31
(2022)). Such studies stress how batteries represent a shift away from carbon-
32
intensive technologies based on non-renewables (see also Jiang et al. (2022))
33
and symbiotic with post-industrial products, infrastructures and macro-societal
34
models (see Aaldering and Song (2019) and Silva et al.). Indeed, this emerging
35
patent-based literature has so far mostly dealt with the analysis of one or few
36
batteries defined from a conventional electrochemical innovation perspective.
37
In this paper, we stretch this line of work by providing a broad and long-run
38
appreciation of secondary battery innovation while considering more explicitly
39
how their technological content facilitates a deep transition toward circularity
40
characteristics. In fact, batteries not only contribute to limiting CO2 emissions
41
from fossil fuels, they also have systemically transformative effects. Whereas
42
primary batteries are one-off assets, secondary batteries are rechargeable, i.e.,
43
these technologies are therefore intrinsically more pro-circular (vis-a-vis primary
44
ones) since they have a longer and more flexible working life-cycle (the energy
45
services extracted per kilogram of employed material are overwhelmingly su-
46
perior). Thus, the contribution of (secondary) batteries to closing loops and
47
building a Circular Economy is paramount (De Jesus et al. (2019), De Jesus
48
et al. (2021a)). On the one hand, the progressive replacement of single-use bat-
49
teries for rechargeable ones reduces materials consumption. On the other hand,
50
more efficient and effective storage capabilities facilitate the progressive main-
51
streaming of carbonless power while opening the scope for new business models
52
and inducing investment in new infrastructure.
53
Batteries are, indeed, unfinished business. The introduction of the lithium-
54
ion battery represented a world-changing discontinuity, since its affordability
55
and flexibility plus energy density and reliability enabled a wave of new products
56
and equipment, from smartphones to wearable devices, from smart sensors to
57
electric vehicles (see, e.g., Aykol et al. (2020)). Furthermore, continuous change
58
and structural variation mean that other transformative impacts are possible.
59
Newer generations of batteries that have characteristics such as rechargeability,
60
higher energy-intensity, longer lifespans, that take up more environmentaly-
61
3
Jour
nal
Pr
e-pr
oof
friendly elements from nature and that reduce/avoid the use of environmentally
62
hazardous materials (like present in the conventional nickel-cadmium and lead-
63
acid technologies) are understood here as facilitating circularity. Moreover,
64
the diversity of technical development pathways also in itself matters from a
65
circular directionality point of view since it dilute the pressure on the narrow
66
pools of scarce minerals needed to engineer batteries and their components.
67
Innovations that represent departures from the technological conventions, for
68
instance by highlighting reuse and repair features, do enhance sustainability
69
in more meaningful ways as they are exemplary of headway heuristics of the
70
shifting knowledge base toward “deep transition" and a “circular economy" (see
71
De Jesus et al. (2018), Winslow et al. (2018), Zhu et al. (2021), Thompson et al.
72
(2020),Sharma and Manthiram (2020), Li et al. (2022), Wang et al. (2022)). If
73
batteries are all too often assumed as being part of green solutions, we stress
74
that considering their own circularity is a crucial dimension as “whole-of-system"
75
approaches are developed. Our study provides a way to inquire how relevant
76
batteries are for the Circular Economy approach.
77
For the present work, we built a new dataset containing 92,700 secondary
78
battery patents (consolidated in terms ofinternational patent families, or IPFs)
79
from 2000 to 2019. The raw data was extracted from PATSTAT Online (edition:
80
Autumn 2021), the web interface of the PATSTAT database maintained by the
81
EPO containing a vast collection of data extracted from worldwide patent doc-
82
uments and which is usable for purposes of statistical analysis (see De Rassen-
83
fosse et al. (2014)). In the past decades, patents emerged as crucial data for
84
evaluating technical progress (Mendonça et al. (2019)), including for tackling
85
pressing global challenges (see Mendonça et al. (2021)). Albeit a gush of recent
86
work using patents in connection with energy storage for particular technologies
87
(e.g. Silva et al. (2015); Stephan et al. (2019, 2021); Baumann et al. (2021)),
88
patents remain under-exploited for conducting integrative mapping exercises of
89
battery development, i.e. across types, geographies and long stretches of time
90
(some exceptions being IEA and EPO (2020); Távora et al. (2020); Silva et al.
91
(2023)). This paper provides a systematic analysis of patent big data (large
92
4
Jour
nal
Pr
e-pr
oof
period, global scope, all battery domains), but is also distinguished from extant
93
contributions by providing an appraisal of patent textual content from which
94
novel insights regarding “circularity" are derived (for background see Dang and
95
Serajuddin (2020); De Jesus and Mendonça (2018), Morales et al. (2022), Den-
96
ter et al. (2022)). In doing so, this paper extends battery patent analysis to
97
the circularity realm by providing a first account of how “circular" these trends
98
have been. In particular, we propose textual patent data as a suitable means
99
for appraising the degree of circularity in new battery advances. For the iden-
100
tification of inventions with circular characteristics, we propose a novel, albeit
101
simple, approach that draws on conventional definitions of Circular Economy
102
(with the emphasis on re-use, repair, recycle, recover. etc.; see, e.g., De Jesus
103
et al. (2021b)) in the textual content of patent documents.
104
We find that global battery patenting activity grew significantly in the 2000-
105
2019 period. This stylised fact means that the comparative advantages of sec-
106
ondary approaches (rechargeable, redeployable, reusable batteries) have been
107
continuously on the rise driven by innovation, making a direct contribution to
108
socio-technical circularity. We also confirm that the majority of battery patents
109
originate mostly from Far East manufacturers, but also show that several Asian
110
and European countries exhibit high battery patent per capita intensities. Four
111
battery technologies (redox-flow, solid-state, sodium-ion, and lithium-sulfur bat-
112
teries) display increased patenting dynamics from 2000-2009 to 2010-2019, a
113
pattern that can serve to cluster countries in terms of performance on emerging
114
battery types (from which inferences can be made regarding the potential to
115
contribute to circularity in the future). We find that several battery-related
116
technologies and applications, such as energy storage systems, battery manage-
117
ment systems, wireless power transmission, electric vehicle charging, and un-
118
crewed aerial vehicles (i.e., drones), grew in relevance both in absolute terms and
119
relative to general battery patenting activity. These results complete and bol-
120
ster current knowledge regarding the pathways of battery innovation that have
121
been surfacing of late and attracting policy attention (IEA and EPO (2020)).
122
The connections of battery innovation with pro-circular transformations may be
123
5
Jour
nal
Pr
e-pr
oof
non-linear (for instance, batteries are of course intensive in exhaustible mineral
124
resources), but overall we find evidence of trajectories of technical change that
125
are less-toxicity intensive, more diverse in the materials employed and more ex-
126
ploratory in the direction of technologies with greater pro-circular potential. We
127
observe non-trivial activity in the overlap of batteries and the circularity realms,
128
especially after 2010, mostly related to reuse and repair features. In this way,
129
our contribution adds to the still small, but expanding, stock of patent-based
130
scholarly work and grey literature on battery evolution.
131
This paper is organized as follows: Section 2 refers to battery technology and
132
the theoretical light in which we study them. Section 3 describes the method and
133
empirical materials. In Section 4 the results are presented. These outcomes are
134
discussed in Section 5. Section 6 concludes the article. Detailed descriptions
135
of the data selection process and the methods deployed for this analysis are
136
provided in Appendix A.1.
137
2. Batteries in innovation studies
138
We approach batteries not simply as a stand-alone "device" but as a techno-
139
logical system that is based on a multi-domain, evolving knowledge base. This
140
section sets forth how we understand our subject matter, namely, innovation
141
and the battery technology itself.
142
2.1. The empirical study of industrial innovation
143
Innovation is the process through which ideas and knowledge are converted
144
into useful applications. This means that innovation is a multi-phased pro-
145
cess, open to feedback at every stage, molded in an ongoing fashion by a va-
146
riety of players and institutional settings (Caraça et al. (2009); Ribeiro and
147
Shapira (2020)). Indeed, progress is seldom uni-linear. As it it well known
148
when evolutionary processes are concerned, the sustained dynamics of change
149
is characterised by openness, multiple learning paths and structural unfolding
150
of diverse exploration avenues (Nicita and Pagano (2001); Stirling (2007)). In
151
6
Jour
nal
Pr
e-pr
oof
the neo-Schumpeterian tradition, technology is seen as a body of useful knowl-
152
edge that can, at an analytical level, be statistically measured (Castellaci et al.
153
(2005)) and has, at a substantive level, systemic properties that can be related
154
to transformative transformations, such as the transition to the Circular Econ-
155
omy (De Jesus and Mendonça (2018)). Indeed, In the face of climate neutrality
156
targets, "being innovative in order to be circular" is emphasised as a policy
157
pathway for sustainable industrial development (Mazzanti and Zecca (2023), p.
158
303).
159
As innovation started to be regarded as an empirical phenomenon of sig-
160
nificant importance, its measurement became an increasingly topical agenda.
161
Quantification of an intrinsically qualitative process is, nevertheless, a difficult
162
and delicate task. Any approach is a partial approach since innovation is a mul-
163
tifaceted phenomenon. But empirical research is analytically desirable in order
164
to understand technological change over time, along space, and across challenges
165
(Mendonça et al. (2021)). Plus, empirical innovation studies are instrumental
166
in assisting managerial strategy and public policy (Santos et al. (2021)), espe-
167
cially when critical technologies or radical innovation is at stake (Tiberius et al.
168
(2021)).
169
2.2. Secondary batteries
170
Secondary batteries are able to receive energy in the form of electricity,
171
store it, and at a later time (and with a certain loss due to the energy conver-
172
sion processes taking place) release it again, feeding electricity back to the grid
173
or powering a given application. Secondary batteries are rechargeable, unlike
174
primary batteries which can only discharge once and then need to be discarded.
175
In the context of the ongoing energy transition (a move away from dispatchable
176
sources such as coal-fired power plants and towards alternatives such as wind and
177
solar, in which input is not controllable), batteries and other means of energy
178
storage constitute a regulating bridge that conjoins the temporal gap between
179
supply and demand while balancing the system as a whole. Moreover, acceler-
180
ated electrification in the transporting sector, especially in individual mobility,
181
7
Jour
nal
Pr
e-pr
oof
creates a focusing device calling out for more batteries and longer lifespans.
182
What is more, now in the stationary domain, the emphasis on resilience and
183
energy autonomy has only reinforced the role of batteries as backup power, in a
184
combination with inherently variable sources like solar and wind (Kosmadakis
185
et al. (2021); Ziegler (2021), see also Østergaard et al. (2022)). As with any
186
other critical technology, batteries have systemic and non-linear impacts (Marx
187
et al. (2014); Kosmadakis et al. (2019)).
188
When referring to batteries, one has to differentiate between the terms “bat-
189
tery”, “module”, and “cell”. While an entire battery pack potentially consists of
190
multiple modules that are “wired in series and/or (less often) parallel" a module
191
itself consists of multiple cells that “are connected in series or parallel" (Vezzini,
192
2014, p. 345). For simplicity’s sake, secondary batteries, meaning battery packs
193
in their entirety, will hereafter be simply referred to as "batteries".
194
2.3. How batteries differ
195
There is a plethora of battery technologies that differ in several aspects,
196
namely the type of electrodes and electrolytes, their format, applications and
197
in some cases even the working principle is different. This subsection does not
198
attempt to exhaust the full range of existing technologies, but rather to briefly
199
describe the main varieties (the groups of technologies) that are prominent in
200
our analysis.
201
Lithium-ion (Li-ion) battery is a rechargeable battery that charges and dis-
202
charges energy through the movement of lithium ions between the negative
203
electrode (anode) and the positive electrode (cathode) (Nzereogu et al. (2022)).
204
The transport of ions between electrodes occurs through an electrolyte, and a
205
separator is placed between the two electrodes to avoid direct contact between
206
them (Li et al. (2021)). Although there are several types of Li-ion batteries,
207
the core material of which is mining-intensive, the use of transition metals such
208
as cobalt and nickel also pose serious environmental, social, and even geopoliti-
209
cal issues that motivate the quest to replace them (Banza Lubaba Nkulu et al.
210
(2018); Fu et al. (2023)).
211
8
Jour
nal
Pr
e-pr
oof
Solid-state batteries (SsB) are batteries in which the liquid electrolyte is re-
212
placed by a solid-state one. Although there a several examples of non-lithium
213
SsB, most of the research is done in the context of lithium-ion technologies.
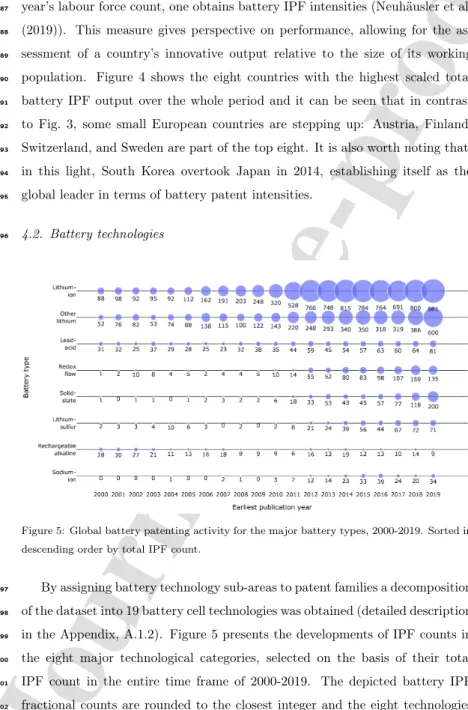
214
One of the major advantages of solid-state Li-ion technologies, when compared
215
to conventional ones, is that they avoid possible leaks of the liquid electrolyte.
216
Another problem that can be avoided with solid-state electrolytes is the for-
217
mation of dendrites of lithium which can cause the battery to explode (Kim
218
et al. (2015)). The main drawback of solid-state electrolytes is that at cool and
219
average temperatures solid oxides have a high resistance to ionic conductivity,
220
making them unsuitable to be used at low and room temperatures. Also, the
221
stress created at the electrode-electrolyte interface at room temperature tends
222
to reduce the battery lifespan (Kim et al. (2015)). Thus, although SsB theo-
223
retically have a higher life expectancy (Li et al. (2021)), presently they cannot
224
attain the durability of conventional Li-ion batteries (Block and Song (2022b)).
225
Lead-acid batteries (Pb-acid) batteries were the first rechargeable batteries
226
ever produced. The original Pb-acid battery was composed of two lead elec-
227
trodes immersed in a sulfuric acid electrolyte (Garche et al. (2015)). Although
228
there have been significant advances since, such as the Valve Regulated Lead
229
Acid (VRLA) battery (Garche et al. (2015)), the working principle of Pb-acid
230
remains the same. Pb-acid batteries use inexpensive materials, are easy to pro-
231
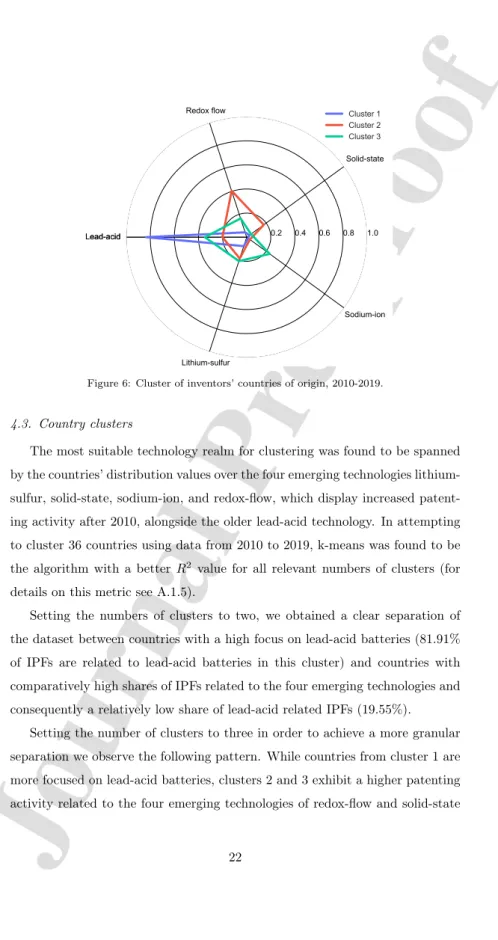
duce and the technology has a high maturity level, which makes this technology
232
cost-competitive. Pb-acid batteries are widely used as motor starter batteries in
233
combustion engine vehicles, they are also used on off-grid energy systems (May
234
et al. (2018)). The main drawbacks of Pb-acid technologies are their height,
235
short lifecycle, and the use of lead which is toxic and constitutes an environ-
236
mental problem. On the other hand, recycling for Pb-acid batteries is well
237
established and very high lead recycling rates are achieved (May et al. (2018)).
238
Lithium-sulfur (Li-S) batteries hold the promise to achieve very high energy
239
densities (i.e., beyond 500 Wh/kg), which makes them particularly suited for
240
mobile applications (Li et al. (2019)). Also, the use of sulfur as cathode ma-
241
terial, which is very abundant and environmentally friendly, makes this type
242
9
Jour
nal
Pr
e-pr
oof
of battery quite attractive (Zhao et al. (2020)). Still, the development of Li-S
243
technologies faces some significant hurdles. First, both sulfur and the discharge
244
product (Li2S) are electronic/ionic insulating thereby hindering charge trans-
245
port. Second, very large volume changes (up to 80%) during charge/discharge
246
cycling accelerate cathode degradation. Third, lithium polysulfide intermedi-
247
ates dissolve in the electrolyte and shuttle between the cathode and the anode
248
reducing the charge transfer efficiency (Coulomb efficiency) and cycling stability
249
(Manthiram et al. (2015); Zhao et al. (2020)).
250
Unlike conventional electrochemical batteries where energy is stored in elec-
251
trodes, in redox flow batteries (RFBs) energy is stored in the electrolytes. In
252
the RFBs the charge/discharge processes are based on reversible electrochemi-
253
cal reactions of two redox couples that are dissolved in electrolytes. RFBs have
254
two parts that are connected through pumps: the battery stack, where elec-
255
trochemical reactions occur, and the external tanks, where the electrolytes are
256
stored. The battery stack includes two sets of electrodes, bipolar plates, and
257
current collectors that close a membrane between two electrodes. The mem-
258
brane conducts the charge carriers and avoid the mix of the two electrolytes
259
(Zhang et al. (2017)). Since the total energy stored is determined by the elec-
260
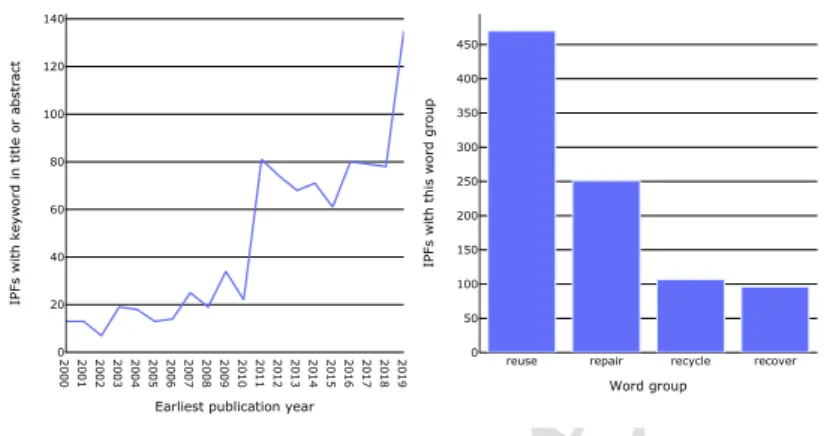
trolyte concentration and volume, and the power is determined by the current
261
density and electrode area, the RFBs energy can be sized independently from
262
its power, allowing it to adjust the energy stored by increasing the volume of
263
the electrolytes. This flexibility makes RFBs particularly suited for grid-storage
264
applications. Also, these batteries have a long lifespan, high energy efficiency,
265
and allow low cost for large-scale energy storage (Tomazic and Skyllas-Kazacos
266
(2015)). Vanadium redox flow battery is so far the most successful of RFBs
267
because, besides the advantages already mentioned, these batteries benefit from
268
the use of abundant and environmentally friendly electrolytes. The major draw-
269
backs of these batteries are their limited energy density and operating voltage
270
(Sun et al. (2017)).
271
Sodium-ion (Na-ion) batteries have been proposed as an alternative to Li-
272
ion batteries. Like Lithium, Sodium belongs to the group of alkaline metals,
273
10
Jour
nal
Pr
e-pr
oof
which means that its chemical behaviour is in several aspects very similar to
274
lithium, notably its reactivity with water. Due to this similarity, Na-ion and
275
Li-ion batteries are considered sister systems (Kubota et al. (2018)), and Na-ion
276
technologies tend to mimic Li-ion chemistry which as favoured them in terms
277
of a faster development (Tarascon (2020)). One of the main advantages of Na-
278
ion batteries is the fact that sodium is much more abundant (the fourth most
279
abundant element on Earth’s crust) and thus less expensive than lithium (Slater
280
et al. (2013)). Conversely, the chemical reactivity of sodium with water is higher
281
than that of lithium, which inhibits the use of metallic sodium in the anode.
282
Research in this area is very active and there is not a defined chemistry for the
283
sodium-ion battery, as a lot of different electrodes and electrolytes are being
284
tested (Tarascon (2020)).
285
3. Batteries and patents data
286
The empirical materials for our study are addressed in this section. Intellec-
287
tual property data on inventions can be, and have been, used to analyse battery
288
development. Whilst they remain partial and imperfect indicators, they remain
289
useful but somewhat underutilised.
290
3.1. Patents as an innovation indicator
291
Patents are intellectual property rights on inventions. A patent describes
292
claims to useful ideals and assigns rights to new knowledge. As legal documents
293
patents represent a trade-off. They ascribe ownership but also reveal as wealth
294
of information related to actors, places, dates, etc. In particular, patents dis-
295
close data on geographic locations associated with inventors, descriptions and
296
classifications of the respective inventions, and timestamps related to filling and
297
publication dates. This allows for the aggregation of patent counts alongside
298
geographic, temporal, and technological dimensions and makes them a suitable
299
material for a myriad of analytical purposes, from competitiveness studies to
300
sustainability research (Mendonça et al. (2019)).
301
11
Jour
nal
Pr
e-pr
oof
Patents are, thus, viewed as resource for capturing the notion of techni-
302
cal change. Patents grant formal protection for an idea that is (1) novel, (2)
303
showing an inventive step, and (3) capable of industrial application (OECD
304
(2009)). Typically, interested parties (inventors, owners, intellectual property
305
lawyers, patent offices, etc.) apply for formal protection before the ideas are
306
operationally tested and before getting feedback from their commercial roll-out.
307
Surely not all inventions are patented, and the value of other developments or
308
improvements can be appropriated by other means which in turn can be detected
309
and measured (a case in point being trademarks and the digital economy, see
310
Mendonça et al. (2004); Castaldi (2020); Castaldi and Mendonça (2022); Tsiro-
311
nis et al. (2022)). Hence, despite only yielding partial and imperfect evidence of
312
innovation, patents are irreplaceable in the toolbox of innovation economists and
313
business analysts (Mendonça et al. (2019)). When making a case for patents
314
as a proxy for measuring innovation, Zvi Griliches classically explained that
315
patents “are available; they are by definition related to inventiveness, and they
316
are based on what appears to be an objective and only slowly changing stan-
317
dard" (Griliches, 1990, p. 1661). They also have well-known limitations: there
318
are different propensities to patent across technology areas, their economic value
319
widely varies, service innovations are not captured, etc. More recently, new
320
methodologies have stretched the empirical usefulness of patents (Mendonça
321
et al. (2021)). For instance, patents have been repurposed to unveil new in-
322
sights with regard to pressing global challenges such as environmental progress,
323
human well-being and climate change adaptation (see, e.g., Losacker (2022);
324
Sovacool et al. (2022)).
325
Recently, patents have been increasingly mobilised to track developments in
326
green innovation, including in strategic emerging sectors like clean technology
327
and renewable energy (WIPO (2022); Jiang et al. (2022)). It is well known that
328
data beyond patent number is of interest: for instance, recent methodological
329
developments have been achieved to extract further information from patents
330
by using patent citation and also internal patent document content (Mendonça
331
et al. (2021)). Although it can be seen as a fundamental direction in a broader
332
12
Jour
nal
Pr
e-pr
oof
pro-sustainability transformation, the literature that can be found drawing on
333
battery patents is still emergent. The following subsection briefly reviews it.
334
3.2. Extant battery patent analysis
335
A number of energy-related patent-based empirical works have underscored
336
how understanding technological potential can inform eco-innovation promotion
337
and climate change mitigation strategies, including public policy and corporate/start-
338
up development efforts (Baumann et al. (2021)). Recently, a few of these studies
339
have begun to examine the dynamics of innovation in the “world-changing" field
340
of secondary batteries (Aykol et al. (2020)). These have covered especially the
341
lithium-ion variety, which is the dominant solution for today’s informational
342
lifestyle (mobile phones, tablets, laptops; see Zubi et al. (2018); Aaldering et al.
343
(2019); see also Costa et al. (2019); Cardoso et al. (2023)).
344
The scholarly research stream on battery patents is growing. Some research
345
focused on patent counts for just one type of technology for a limited number of
346
countries, namely lithium-ion for the leading countries in the field (e.g. Aalder-
347
ing et al. (2019); Baumann et al. (2021). Other studies have moved forward
348
with the empirical strategy, for instance, by proposing a citation network analy-
349
sis combining knowledge extracted from patent data with results from interviews
350
conducted with lithium-ion battery experts (Malhotra et al. (2021)). Stephan
351
et al. (2019) examined lithium-ion battery patents from a sectoral diversity per-
352
spective and emphasized how the distance from prior knowledge affects certain
353
features of subsequent knowledge (see also Stephan et al. (2021)). Kittner et al.
354
(2017) and Ziegler and Trancik (2021) employed the patent proxy in their efforts
355
to model the forces driving the prices of lithium-ion batteries, and found that
356
cumulative patent filings is the best predictor of real prices scaled by energy ca-
357
pacity. Work on alternative chemical alternatives to lithium-ion has been even
358
rare (see Aaldering and Song (2019); Block and Song (2022a)).
359
Our contribution complements the still scant, but growing scholarly work on
360
battery evolution. It also extends the existing grey literature on this matter.
361
Specifically, it aims to confirm and consolidate the findings presented in the
362
13
Jour
nal
Pr
e-pr
oof
IEA and EPO report (IEA and EPO (2020)) and it can be thus understood as
363
a continuation of their basic methodological approach, enriched by some rea-
364
sonable additions, which allow for a more granular perspective on some aspects.
365
However, our work also seeks to provide a more encompassing picture of a very
366
vibrant area, including by drilling down for content and uncovering within-text
367
patterns.
368
The IEA and EPO report presents patent trends related to batteries and
369
electricity storage. In contrast, our own study is more focused (looks at bat-
370
tery technology only) but has a longer time span. The research gaps that we
371
identified and which the current study aims to fill are how patent counts are
372
distributed across continents, how scaling them by the sizes of the respective
373
labour forces affects the outcome of the analysis, what their distribution across
374
another technological classification scheme looks like, how countries can be char-
375
acterized based on their position in technology space, and what information can
376
be extracted from patent abstracts. What is more, we are able to build bring
377
new perspective with regard to circular directionalities.
378
3.3. Data acquisition procedures and empirical categories
379
The raw bulk data used for this study were accessed via subscription at PAT-
380
STAT, the online worldwide reference patent repository harboured by EPO. The
381
source is organized according to the International Patent Classification (IPC)
382
scheme. The IPC provides a hierarchical classification scheme that categorizes
383
patents according to different technological areas.
384
Our extraction strategy for deriving our data subset is described in the detail
385
in the Appendix, and the queries (Transact-SQL) and code (Python) needed
386
to replicate this study are also made available. On the basis of substantive
387
knowledge of the technology (namely the reference EIA and EPO report, but
388
also the recent scholarly battery patent literature) the search was conducted
389
iteratively, with time and care so as to arrive to a robust final dataset. It is on
390
this final dataset that we compute occurrence counts, including when we run
391
content searches for an array of strings on all English titles and abstracts.
392
14
Jour
nal
Pr
e-pr
oof
This study builds on battery patents that can roughly be characterized in the
393
following way: (1) inventions related to the casing, wrapping, or covering, i.e.,
394
non-active parts of batteries; (2) developments in battery electrode manufac-
395
turing; (3) innovations related to the manufacturing process of secondary cells;
396
and (4) advances related to charging of batteries. Patents belonging to these
397
four fields were identified using the international patent classification system
398
(IPC). The IPC provides a hierarchical classification scheme that categorizes
399
patents according to different technological areas. While several specific analyt-
400
ical options and constraints are discussed in the analytical section of this paper,
401
the complete details regarding data acquisition and processing are supplied in
402
Appendix A.1.
403
In this study, we use the concept of international patent families (IPF). A
404
relevant patent application is a formal request made by one or several applicants
405
at any given patent office of their choice for a unique invention. These could be
406
the European Patent Office (EPO), the United States Patent and Trademark
407
Office (USPTO), or any other national or regional patent office. The IEA and
408
EPO report uses IPFs for aggregating and counting patent applications. They
409
claim that an IPF “is a reliable proxy for inventive activity because it provides a
410
degree of control for patent quality by only representing inventions for which the
411
inventor considers the value sufficient to seek protection internationally" ((IEA
412
and EPO, 2020, p.4)).
413
The termpatent familyrefers to the whole set of patent applications covering
414
the same invention (Dechezleprêtre et al. (2017)). By counting patent families
415
instead of individual applications, double-counting of inventions is avoided. By
416
restricting the scope of the search protocol to only patent families that contain
417
an international patent application, at least one application to a regional patent
418
office, or applications to at least two distinct national patent offices, one obtains
419
IPFs. One benefit of this restriction is that only patents of higher expected value
420
are assessed, resulting in a more homogeneous dataset with better comparability
421
between elements. In this study we use the same criteria to identify IPFs that
422
the IEA and EPO report used. The regional patent offices are the African
423
15
Jour
nal
Pr
e-pr
oof
Intellectual Property Organization, the African Regional Intellectual Property
424
Organization, the Eurasian Patent Organization, the EPO and the Patent Office
425
of the Cooperation Council for the Arab States of the Gulf.
426
A drawback of IPFs is that several different definitions are used in patent
427
studies. Moreover, as Schmoch and Gehrke (2022) discussed, three limitations
428
regarding the IPF concept itself should be considered: First, the propensity to
429
patent in foreign territories differs between countries of origin, meaning that,
430
for example, an applicant from a European country might be more inclined
431
to seek protection in another European country than an applicant from China
432
might be inclined to seek protection in the US. This can be problematic because
433
both situations would imply that the respective patent is filed in two countries,
434
thus making their patent family an international patent family. Second, patent
435
numbers for some countries in specific technologies, such as Japan in micro-
436
electronics, may be overestimated. Third, there can be some turbulence in the
437
evidence since IPFs with seemingly two members at the stage of applications can
438
be reduced to one member, later on, something that may happen with Chinese
439
inventors (regarding the Chinese case, we further refer to Frietsch and Kroll
440
(2020)). Schmoch and Gehrke (2022) discuss several other concepts that exist
441
parallel to IPFs, highlighting their advantages and limitations.
442
To ensure comparability with the recent IEA and EPO report, we have kept
443
IPFs as our frame; therefore, all depicted counts refer to IPFs. However, there
444
are some discrepancies between their study and our own; this is something
445
that we are not able to fully account for but works as a stimulus for future
446
research which serves as further attempts to validate the findings of a prior
447
analysis. The comparison between these two studies is not direct because our
448
numbers depict “Lithium-ion” and “Other lithium” separately, because the IEA
449
and EPO report uses another classification system (the Cooperative Patent
450
Classification (CPC)), and because we decided to include charging technologies.
451
Notwithstanding, it is reassuring to note that both studies detect a step-jump
452
around the year 2010 and that the counts are very correlated (ours and their
453
counts yield a Pearson correlation coefficient of 0.9940 (rounded to the fourth
454
16
Jour
nal
Pr
e-pr
oof
decimal place); see Appendix A.3).
455
4. Results
456
In this section aggregate data is used to highlight the major patterns con-
457
cerning battery progress. Desegregated data is then examined to show how
458
patents reveal more specific information, regarding different, technologies, and
459
connections to circularity.
460
4.1. Basic stylized facts
461
The global aggregate yearly volume of battery IPFs increased almost every
462
year during the time frame assessed in this study. There were slight decreases
463
only for two pairs of adjacent years: from 2001 to 2002 and from 2014 to 2015.
464
The whole time period’s average yearly growth rate in battery IPFs is 14.3%so
465
between 2000 and 2019 the total IPF output increased more than 11-fold. This
466
dynamic is displayed in Fig. 1.
467
N N N N N
(DUOLHVW SXEOLFDWLRQ \HDU
1XPEHURI,3)V
Figure 1: Total number of battery IPFs, 2000-2019.
Asian countries dominate the battery scene: the Asian continent’s mean
468
annual battery IPF output is approximately four times higher than Europe’s
469
and North America’s (a factor of 3.57 and 4.10, respectively). Furthermore, the
470
17
Jour
nal
Pr
e-pr
oof
N
$VLD (XURSH 1RUWK $PHULFD
$XVWUDOLD DQG 2FHDQLD (XURSH $VLD
$IULFD 6RXWK $PHULFD
(DUOLHVW SXEOLFDWLRQ \HDU
1XPEHURI,3)V
,Q 3$767$7 WKH 5XVVLDQ )HGHUDWLRQ DQG 7XUNH\ DUH FODVVLILHG DV (XURSH $VLD
Figure 2: Battery IPFs by inventors’ continents of origin, 2000-2019.
Note: The y-axis is log-scaled and all values are incremented by 1. It is clear that the number of battery IPFs from Asia (blue) is considerably higher than that of any other continent.
-DSDQ 6RXWK .RUHD 86$
*HUPDQ\
&KLQD 7DLZDQ )UDQFH 8.
(DUOLHVW SXEOLFDWLRQ \HDU
1XPEHURI,3)V
Figure 3: Battery IPFs by inventors’ countries of origin, 2000-2019.
Note: The eight countries with the highest total battery IPF counts over the given timeframe are displayed. Japan (blue) has the highest battery IPF output in the given timeframe, whilst other countries’ IPF counts (especially South Korea’s (red) and China’s (orange)) have been surging in the recent decade.
18
Jour
nal
Pr
e-pr
oof
6RXWK .RUHD -DSDQ 7DLZDQ
*HUPDQ\
$XVWULD )LQODQG 6ZLW]HUODQG 6ZHGHQ
(DUOLHVW SXEOLFDWLRQ \HDU
1XPEHURI,3)VSHU0ZRUNHUV
Figure 4: Battery IPFs per 1M workers by inventors’ countries of origin, 2000-2019.
Note: The eight countries with the highest total battery IPF intensities over the given time- frame are displayed. In this perspective, South Korea (blue) overtook Japan (red) in 2014.
number of IPFs from Asia increased by 15.96%on average every year during
471
the 2000-2019 period. The average increase for Europe and North America was
472
13.46%and 10.80%, respectively (see Fig. 2; log-scaled y-axis).
473
Breaking down battery IPF counts by inventors’ countries of origin, the
474
dominance of Asia becomes even more apparent. Figure 3 shows the eight
475
countries with the highest total battery IPF output over the whole timespan.
476
By 2019 the three top countries in terms of battery IPF output were from
477
the far east: Japan, South Korea, and China. These were followed by the US,
478
Germany, France, Taiwan, and the UK. Japan, the undisputed leader in battery
479
IPF counts during the whole time frame, has been displaying a vibrant rate in
480
the dynamics of inventive output since 2016. China is catching up fast with
481
South Korea, which has held second place in battery IPF output since 2011
482
when it surpassed the US (for the Chinese case see Hsu et al. (2021)). Germany
483
also displays growth in battery IPF output. These results echo those of the IEA
484
and EPO report (IEA and EPO (2020), Figs. 6.2 and 6.3).
485
By scaling the numbers shown in the previous plot by each country and
486
19
Jour
nal
Pr
e-pr
oof
year’s labour force count, one obtains battery IPF intensities (Neuhäusler et al.
487
(2019)). This measure gives perspective on performance, allowing for the as-
488
sessment of a country’s innovative output relative to the size of its working
489
population. Figure 4 shows the eight countries with the highest scaled total
490
battery IPF output over the whole period and it can be seen that in contrast
491
to Fig. 3, some small European countries are stepping up: Austria, Finland,
492
Switzerland, and Sweden are part of the top eight. It is also worth noting that,
493
in this light, South Korea overtook Japan in 2014, establishing itself as the
494
global leader in terms of battery patent intensities.
495
4.2. Battery technologies
496
Figure 5: Global battery patenting activity for the major battery types, 2000-2019. Sorted in descending order by total IPF count.
By assigning battery technology sub-areas to patent families a decomposition
497
of the dataset into 19 battery cell technologies was obtained (detailed description
498
in the Appendix, A.1.2). Figure 5 presents the developments of IPF counts in
499
the eight major technological categories, selected on the basis of their total
500
IPF count in the entire time frame of 2000-2019. The depicted battery IPF
501
fractional counts are rounded to the closest integer and the eight technologies
502
20
Jour
nal
Pr
e-pr
oof
with the highest total battery IPF count over the given time frame are displayed
503
in descending order.
504
While the number of IPFs related to lead-acid batteries (i.e. arguably the
505
least circular of the technological options) has been relatively stable over the
506
depicted 20 years, which resulted in its overall share in battery IPFs decreasing
507
steadily over this time period, and while rechargeable alkaline batteries exhibit
508
a slight downwards trend, lithium-ion batteries and other lithium-based bat-
509
tery technologies have soared drastically. Less relevant today than lithium-ion
510
batteries, but with considerably higher counts than other smaller battery tech-
511
nologies, are the four remaining categories presented in Fig. 5: patenting activity
512
related to lithium-sulfur, solid-state, sodium-ion, and redox-flow batteries have
513
seen a notable increase in IPF counts in 2010-2019. In 2019 solid-state batteries
514
reached an all-time maximum.
515
As previously mentioned, solid-state batteries are a specific configuration
516
mostly implemented in the framework of lithium-ion solutions. In that sense,
517
one might assert that the emergent redox-flow, lithium-sulfur, and sodium-ion
518
technologies provide a substantial contribution to technological heterogeneity
519
and can lead to higher diversification of the materials used in battery manufac-
520
ture thus avoiding the over-exploitation of scarce resources available in nature
521
such as those already extensively used in the dominant lithium-ion technologies
522
(like lithium, nikel and cobalt). In this sense, the increase in technology diver-
523
sity promoted by innovation has the potential to promote the overall circularity
524
of battery development.
525
The observation that the recent decade displayed increased patenting activity
526
in these four emerging technologies motivates the way the next part of the
527
analysis is set up: The following subsection describes the results obtained by
528
clustering countries based on their position in a technology space computed
529
using their technology distribution of the years of 2010-2019 (6).
530
21
Jour
nal
Pr
e-pr
Lead-acid
oof
Lithium-sulfur
Sodium-ion Solid-state Redox flow
Lead-acid 0.2 0.4 0.6 0.8 1.0
Cluster 1 Cluster 2 Cluster 3
Figure 6: Cluster of inventors’ countries of origin, 2010-2019.
4.3. Country clusters
531
The most suitable technology realm for clustering was found to be spanned
532
by the countries’ distribution values over the four emerging technologies lithium-
533
sulfur, solid-state, sodium-ion, and redox-flow, which display increased patent-
534
ing activity after 2010, alongside the older lead-acid technology. In attempting
535
to cluster 36 countries using data from 2010 to 2019, k-means was found to be
536
the algorithm with a better R2 value for all relevant numbers of clusters (for
537
details on this metric see A.1.5).
538
Setting the numbers of clusters to two, we obtained a clear separation of
539
the dataset between countries with a high focus on lead-acid batteries (81.91%
540
of IPFs are related to lead-acid batteries in this cluster) and countries with
541
comparatively high shares of IPFs related to the four emerging technologies and
542
consequently a relatively low share of lead-acid related IPFs (19.55%).
543
Setting the number of clusters to three in order to achieve a more granular
544
separation we observe the following pattern. While countries from cluster 1 are
545
more focused on lead-acid batteries, clusters 2 and 3 exhibit a higher patenting
546
activity related to the four emerging technologies of redox-flow and solid-state
547
22
Jour
nal
Pr
e-pr
oof
batteries (cluster 2) and lithium-sulfur and sodium-ion batteries (cluster 3).
548
In comparing these results with a two-cluster scenario, one finds that the
549
lead-acid focused cluster from the previous stage is still fairly intact, while
550
the “emerging technologies" cluster has been separated into two. This division
551
results in one country cluster displaying a stronger focus on redox-flow and
552
solid-state batteries and another exhibiting a higher relative focus on sodium-
553
ion and lithium-sulfur-related IPFs. Figure 6 shows the distribution profiles of
554
the three-clusters solution generated with the k-means variable “random_state"
555
set to zero. The variable “random_state" determines the centroid initialization
556
of k-means and results in deterministic runs of the algorithm when a value is
557
assigned to it.
558
While the approximate shape of the clustering profile depicted in Fig. 6
559
is fairly insensitive to alterations or non-assignation of “random_state", the
560
affiliation of the countries to their clusters varied enough to motivate running k-
561
means a higher number of times (with the variable “random_state" undefined)
562
to compute each country’s cluster affiliation distribution for assessing which
563
cluster each country belongs to in the majority of events. Running k-means
564
10,000 times resulted in the following most probable cluster affiliations:
565
• Cluster 1 (16 countries):
566
India , Turkey , Russia , Bulgaria , New Zealand , Luxembourg , Poland ,
567
Sweden , Mexico , Malta , North Korea , Serbia , Greece , Hungary ,
568
Kazakhstan , Israel .
569
• Cluster 2 (13 countries):
570
USA , Germany , Taiwan , Austria , Netherlands , Thailand , Switzerland ,
571
South Korea , Japan , Belgium , Italy , Australia , Hong Kong .
572
• Cluster 3 (7 countries):
573
Canada , Spain , Ukraine , UK , France , Norway , China .
574
Inside each cluster, countries are ordered by (1) their probabilitypto be in
575
this cluster, and (2) their total IPF count in the five categories. Each country’s
576
23
Jour
nal
Pr
e-pr
oof
name is colored according to the following schema, indicating its probabilityp
577
to belong to the respective cluster:
578
p= 1 p∈[0.99, 1) p∈[0.9, 0.99) p∈[0.5, 0.9)
A value ofp= 1indicates that a country was assigned to this cluster during
579
each of the 10,000 runs, meaning that its cluster affiliation appears to be quite
580
insensitive to the algorithm’s centroid initialization.
581
In terms of circularity, in line with what was mentioned in the previous sec-
582
tion, we can assert that due to their higher technological diversity countries in
583
clusters 2 and 3 have the potential to provide a higher contribution to a more
584
Circular Economy than cluster 1, which is mainly focused on lead-acid technolo-
585
gies. In comparing cluster 2 and 3, it stands out that cluster 2, while having
586
a strong emphasis on solid-state batteries (which as mentioned is essentially a
587
particular type of lithium-ion battery), is mainly focused on two emerging tech-
588
nologies (redox-flow and lithium-sulfur). In contrast, cluster 3 reveals robust
589
innovation activity in three emerging technologies outside the lithium-ion tech-
590
nologies framework (i.e., redox-flow, lithium-sulfur, and sodium-ion), suggesting
591
that countries driving cluster 3 could have a higher potential to contribute to
592
circularity in the future since it is more diversified in its exploration of future
593
alternatives.
594
4.4. Patent title and abstract mining
595
The content material of patents is relevant evidence that can be mined,
596
processed, and sorted to leverage classic patent analysis (Hsu et al. (2020);
597
Denter et al. (2022)). The top 50 trigrams in terms of their intensity increase
598
between 2000 and 2019 are displayed in Figure 7. The terms are displayed in
599
descending order of total increase over the given 20-year time period.
600
The method that was implemented to analyse patent wordage was as follows.
601
Both patent abstracts and titles were searched for meaningful phrases. Besides
602
simply counting occurrences of n-grams for each year (analysis not shown), the
603
24
Jour
nal
Pr
e-pr
oof
Figure 7: Trigram occurrence intensities in battery patent abstracts.
25