ec
2015
PCI Big Beam Report
Department of Civil Engineering
College of Engineering
University of Washington’s Mr. Beam (Team #2)
Faculty Advisor
Dr. John Stanton
PCI Producer Member
Table of Contents
Executive Summary ... 2
Acknowledgments ... 4
Design Process ... 5 !
Design Concept ... 5
Flexural Design ... 5
Shear Design ... 5
Materials ... 7
Concrete ... 7
Prestressing Strands ... 8
Welded Wire Fabric ... 8
Rebar ... 9
Beam Fabrication ... 10
Reinforcement Construction ... 10
Strand Prestressing and Beam Casting ... 11
Testing ... 13
Results ... 15
Lessons Learned ... 15
Appendix ... 19
Executive Summary
In 2015, the University of Washington’s Mr. Beam Team entered the Big Beam Competition under the supervision of UW faculty advisor Professor John Stanton. The team was tasked with designing, constructing, and testing a prestressed concrete beam according to PCI Big Beam Competition criteria and while meeting ASTM and ACI standards.
The team comprised of three seniors and two juniors: Wai Lok Chung, Kok Wong, Si Kei Ngan, Givens Lam, and Yousif Alshaba, respectively. In the initial design stages, the seniors were enrolled in a reinforced concrete course, but no team members had any prior prestressed concrete experience.
Throughout the project, the team learned from their faculty advisor, prestressed concrete lecture, and ACI 318-11. Some seniors would go on to take the prestressed concrete course the following quarter.
The team designed an I-Beam shaped beam of constant depth and cross-section with the exception of web stiffeners at the loading points and supports. To reinforce the beam, the team used WWF, two #3 reinforcing bars, and four prestressed strands with debonding of the middle 11’. The strands were partially debonded with the goal of reaching a higher deflection at peak load. A detailed description of the beam is given in the report’s Design Process section.
After the design and construction stages were complete, the team worked on predicting and
assessing the effect of the loads on the beam. Initial predictions were made during the design stage using hand calculations with the assistance of a spreadsheet. However, the greatest challenges lay in determining the strand stress and beam deflection at peak load because no suitable theory exists for performing those calculations.
The cracking load was established using conventional methods. The beam was analyzed as an uncracked member, and the external load needed to achieve the cracking stress was calculated.
The two largest unknowns were the prestress loss and the true cracking strength of the concrete.
However, the predicted cracking load was very close to the measured one.
For the ultimate load and corresponding deflection, the beam was treated as three rigid bodies (left end, middle and right end) connected by the tendon. For any given strand stress, the strand
elongation—and, thus, the beam deflection—could be calculated. The challenge was in establishing the strand stress at ultimate conditions.
Initially, Equation (18-2) from ACI 318-11 was used. However, the result appeared too small—the strand stress was only slightly higher than the effective stress and the predicted deflection was only a fraction of an inch. The problem appeared to lie with the span/depth ratio, which for the beam was 11.3, but the ACI equation is based on test results for slabs, which are typically much more slender.
This suggested that Eq (18-2) might give a poor estimate of fps for such a stocky member.
Consequently, the same calculation was repeated by assuming the strand would yield and reach a total strain of 1%. This number was chosen arbitrarily, but some assumption was needed. The
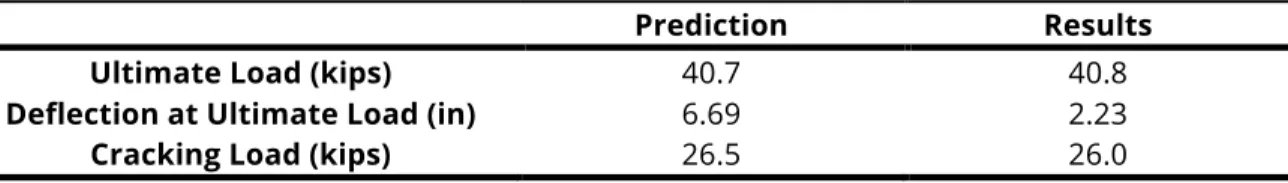
Table 1. Predictions vs. Results
Prediction Results
Ultimate Load (kips) 40.7 40.8
Deflection at Ultimate Load (in) 6.69 2.23
Cracking Load (kips) 26.5 26.0
While load predictions were relatively accurate, deflection predictions were not. This may have been due to incorrect assumptions made during prediction calculations. A detailed discussion can be found in the Results section.
Acknowledgments
The team would like to express the deepest appreciation to those who have helped them prepare for competition.
First, the team would like to the support they received from the University of Washington. They would like to thank Dr. John Stanton, who guided them through the design process and subsequent analysis. He patiently and clearly explained concepts to those who had not yet learned all required for designing and constructing the beam. His passion for and experience in structural engineering are deeply appreciated.
The team would also like to thank graduate students, Mr. Matthew Sisley and Mr. Travis Thonstad.
Sisley’s willingness to help the team at every step was invaluable. Having participated in the 2014 Big Beam Competition, he shared what his team had done and used his experience to lead this year’s team on aspects of beam construction and design. He sacrificed his own time to help them bend the WWF and prepare the prestressing strands. Thonstad’s advice and guidance have also been
invaluable. Having advised the 2014 team, he shared his experiences on the beam design process and what previous teams have encountered.
Additionally, individuals from Concrete Technology Corporation (CTC) have helped the team
significantly. The team would like to thank Mr. Austin Maue, a design engineer at CTC. He reviewed shop drawings to ensure the construction process went according to the team’s design. Moreover, he guided the team on assembling the shear reinforcement and helped solve a last minute problem they had before casting. For his experience and responsibility, the team would also like to thank Mr.
Dave Chapman, the Chief Engineer at CTC. He helped check the team’s work at the site to make sure that everything went smoothly. Moreover, the team would like to thank the crew at CTC for casting and prestressing the beam in an organized manner without delay.
The team would like to thank Davis Wire and Sumiden Wire Products Corporation for donating the WWF and strands, respectively.
Finally, the team would like to thank PCI and Sika for sponsoring the competition. The competition has been a challenging and unique experience from which team members will benefit in their future careers.
Design Process
This section will cover Mr. Beam’s design concept, flexural design, and shear design.
Design Concept
In initial meetings, the team went over prestressing concepts and competition rules, as well as brainstormed beam shapes. The team considered a “T,” “I,” and bulb-shaped cross-sections, as well as whether the beam should be prismatic or non-prismatic. After a few weeks, the team settled on an I-Beam of constant depth and cross-section with stiffeners at the loading points and supports.
An I-Beam would resist torsional buckling better than a T-Beam while optimizing cost and weight.
Due to construction issues faced by last year’s team, especially in terms of formwork construction, this year’s team chose a prismatic shape with straight prestressed strands.
The strands were designed to be unbonded to increase the deflection at peak load. The concept was that a significant strain increase would occur over a greater length of strand, leading to more strand elongation—and so more deflection—than would be the case for a bonded system
Additionally, to reduce weight and costs, the team designed the beam to be 18’ long instead of the allowed 19’. Because of the shortened beam and unbonded strands, steel plates and strand vices were added to the beam ends for additional strand anchorage.
Flexural Design
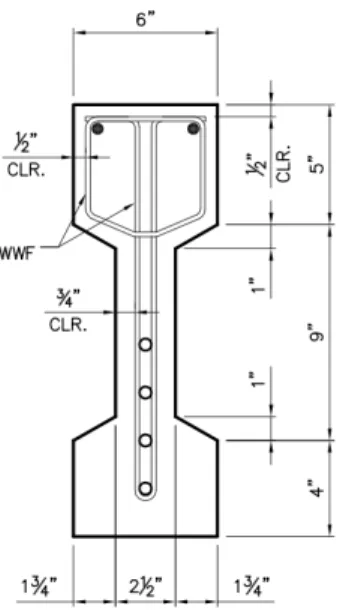
Several iterations were analyzed to select the appropriate number of strands, the location of the strands, and the size of the beam. The final beam cross-section dimension and reinforcement locations are shown below in Figure 1.
Figure 1. Typical Beam Cross-Section
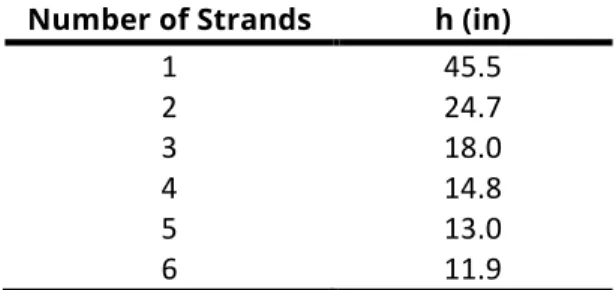
Strand sizes readily available were 0.5 in. and 0.6 in. dia. The larger strands offered too few design choices, so the team concentrated on using 0.5 in. dia. strands. Using an assumed strand stress at failure of 260 ksi, an ultimate load of 40 kips could be achieved with the combinations shown in Table 2.
Table 2. Heights for Number of Strands Number of Strands h (in)
1 45.5
2 24.7
3 18.0
4 14.8
5 13.0
6 11.9
After evaluating the combinations for cost and constructability, the four-strand solution was
selected. The strands were designed to be unbonded for 11’ at the center of the beam with sheaths to increase ductility. The unbonded length was made as long as possible to maximize deflection at ultimate load. Meanwhile, the ends were bonded about 3’ at each end to provide anchorage.
Although this was expected to be enough for transfer, it risked being too short for the development length. For this reason, strand vices were attached at each end just before testing.
Moreover, two #3 rebars were added to the top flange to provide tensile strength at initial conditions and some additional compression strength at ultimate. Four stiffeners were added to help to transfer the vertical concentrated loads and the support reaction forces to the web.
Shear Design
To ensure flexural failure, a large amount of W2.9 3X3 welded wire fabric (WWF) was used to provide shear reinforcement. More reinforcement was used than last year due to availability and last year’s experience with the strands bursting through the web. Due to this year’s thin web, the W2.9 WWF was bent into a narrow U shape and used along the whole length of the beam. The WWF was also bent into a wider U shape to provide more shear reinforcement and concrete confinement in the stiffeners. This would later be tied to the confinement cage in the top flange. Instead of cutting and placing sheets of WWF, the bending was to provide better anchorage.
Materials
This section will cover the materials used in the project. This includes concrete, prestressing strand, welded-wire fabric, rebar, steel plate, and strand vices.
Concrete
CTC produced the concrete used in the beam. The same concrete mix was used for the whole beam.
Lightweight coarse and fine aggregates were used for the beam because the team wanted to minimize beam weight. The concrete had a w/c ratio of 0.4, a design unit weight of 105.4 pcf, and an actual unit weight of 109.8 pcf. No slump was measured. Below is a summary of the mix.
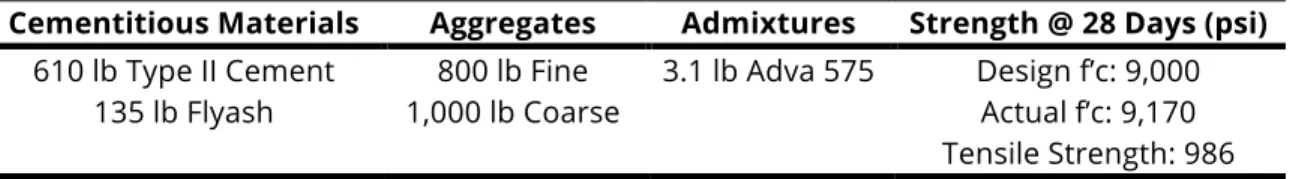
Table 3. Concrete Mix for One cy of Concrete
Cementitious Materials Aggregates Admixtures Strength @ 28 Days (psi) 610 lb Type II Cement 800 lb Fine 3.1 lb Adva 575 Design f’c: 9,000
135 lb Flyash 1,000 lb Coarse Actual f’c: 9,170
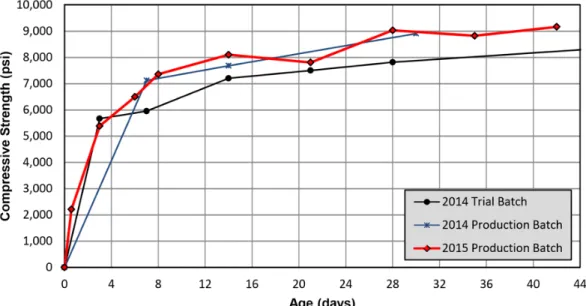
Tensile Strength: 986 Additional mix details can be found in the Appendix. The concrete was almost perfect for the application because it provided the lowest possible weight within the category of lightweight
concrete, but at the same time gave almost the largest possible strength (10,00 psi) without the cost penalty of using high strength concrete. Below is the strength verses time curve of the mixture.
Figure 2: Concrete Strength vs. Time Curve
Prestressing Strands
The prestressing strands used in the beam were low relaxation ½” dia. ASTM A416 grade 270
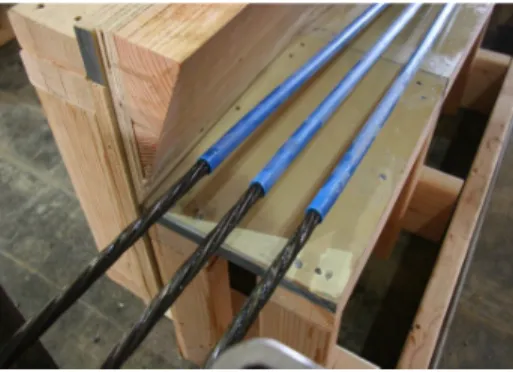
strands. Sumiden Wire Products Corporation provided the strands with a yield point of 39.6 kips and a modulus of elasticity of 28,400 ksi. The strands were straight throughout the whole beam and covered in plastic sheathing to debond the strands. A steel plate and strand vices were applied to the ends of the beam to keep the strands from slipping. Detailed strand properties can be found in the Appendix.
Figure 3. Sheathed Strands
Welded Wire Fabric
Davis Wire provided the welded wire fabric (WWF) used in the beam. Three 5’ x 10’ sheets of WWF were used to construct the shear reinforcement. Two sheets of WWF were cut and bent into “U”
shapes to provide web reinforcement along the whole beam length. Meanwhile, one sheet of WWF was cut and bent into a square cage to provide confinement for the top flange in the middle part of the beam. Last, about half a sheet of the remaining WWF was cut and bent into U shapes to provide reinforcement for the stiffeners.
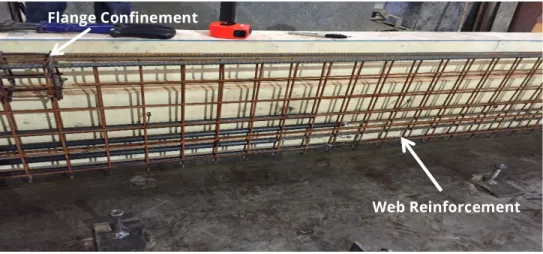
Figure 4. WWF Reinforcement Flange Confinement
Web Reinforcement
Rebar
Two #3 ASTM A615 grade 60 rebar were used in the top flange throughout the whole beam to provide anchorage for the shear reinforcement and to act as compression steel. The yield strength and tensile strength for the rebar were 69 ksi and 108 ksi respectively, and elongation in 8” was 15.6%. At jacking and transfer states, the rebar could act as tension steel as well.
Beam Fabrication
Beam fabrication started with the shear reinforcement on April 9, 2015. By April 13, bending the shear reinforcement was finished in time for reinforcement assembly, which involved setting the reinforcement in the formwork, tying the reinforcement together, and pre-tensioning the strands.
On April 14, the beam was cast, and on April 21, the strands were released and the beam was released from the form.
Reinforcement Construction
Reinforcement construction began with cutting and bending 3” x 3” - W2.9 Welded Wire Fabric (WWF) sheets. Three different shapes and sizes of shear reinforcement were to be assembled inside the beam: a narrow “U” shape throughout the beam, a wider “U” shape for the stiffeners at the load points and supports, and a confinement cage at the beam midspan. To create these shapes, three 5’
x 10’ WWF sheets were cut and bent to appropriate sizes and shapes. Due to the limited size of WWF sheet, the small “U” was separated into two 10’ x 3’ sections with a 2’ of overlap at midspan. There were a total of four big “U” reinforcements needed—two for the supports and two for the stiffeners.
Each required a 3/4’ x 3’ of WWF. Finally, the confinement cage required a 10’ x 2’ sheet of WWF to protect the top flange’s critical region.
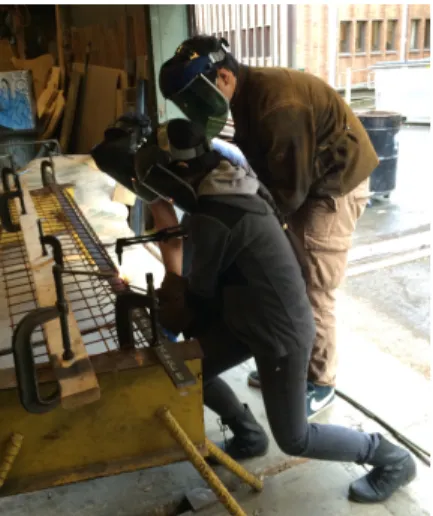
Figure 5. Cutting the WWF
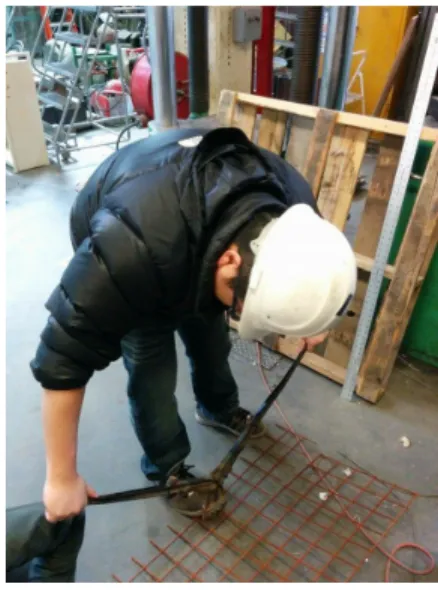
After all the WWF pieces were cut into appropriate sizes, each of the shear reinforcement pieces was bent into the appropriate shapes using an oxy-acetylene torch. The wire was too brittle to cold-bend the tight radius needed. The small “U” was bent by marking the bending area and placing a ½”
diameter steel bar at the middle to form the bent shape. Each took about 4 hours to bend; a total of 8 hours were used to bend the small “U”-shaped reinforcement.
Figure 6. Hot-Bending the Top Flange Confinement
Additionally, the shape of the cage was changed to rectangular due to construction difficulties—the WWF was difficult to bend into the non-rectangular configuration originally intended. Before bending, each area to be bent was marked. A ½” diameter steel bar was placed at the bending location to form the 90 degree angle. From the moment the torch first heated the steel, the process took about 5 hours to finish. A similar method was used to bend the big “U” reinforcements, which took only took 1 hour to finish.
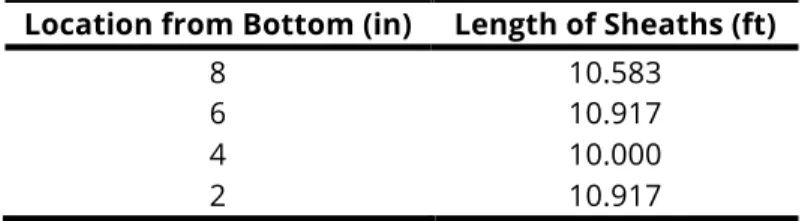
The prepared reinforcement was then assembled at Concrete Technology Corporation (CTC). The two small “U” sections were made to overlap by cutting several vertical wires and forcing the horizontal wires to fit into the other’s grid. The big “U”s were placed at the four aforementioned positions—support and load point stiffeners—and the small “U” was placed between them. The sheathed strands were then slipped through the small “U.” Prior to casting, sheath lengths were checked, and the team discovered that the strands weren’t 11’ long. The lengths of each strand’s sheaths are tabulated below.
Table 4. Lengths of Sheaths for Each Strand Location from Bottom (in) Length of Sheaths (ft)
8 10.583
6 10.917
4 10.000
2 10.917
Afterward, the top flange confinement cage was fitted over the “U”-shaped web reinforcement at midspan. This involved cutting several of the small “U’s” horizontal wires to ensure the cage would fit into the proper position. After all the WWF was in place, the compression steel bars were slipped through the cage. Finally, all the reinforcement was tied together and kept in place.
Figure 7. Assembling the WWF Reinforcement
Strand Prestressing and Beam Casting
The strands were then pre-tensioned—a two-step process. First, all the strands were pre-tensioning to half the prestress load. After checking that the reinforcement was still in the appropriate position, the pre-tensioning process continued to the appropriate stress. The next day, the beam was cast and the strands were released one week later on April 21.
Figure 8. Strand Jacking
Testing
Prior to test day, cylinders were tested at CTC, and the beam was placed on roller supports spaced 17’ apart under the “Baldwin” testing machine. The team reused the previous year’s testing rig and supports.
Figure 8. Testing Rig
On June 2, 2015, at the University of Washington’s More Hall Structures Lab, testing began. Before testing, strand vices were added to the ends of the strands to provide additional anchorage. A stand-off was placed between the end of the beam and the strand vices to facilitate subsequent removal, and the vices were tightened as closely as possible against the stand-off.
The location of the supports and loading points were then marked. A steel bar was hot-glued into place between the loading points. Strings tied to the ends of the bar were attached to
potentiometers underneath the beam to measure deflection. Additionally, a meter stick was placed vertically at mid-span to provide manual deflection readings in case the electronic instrumentation malfunctioned. Two video cameras, one fixed still camera, and one mobile still camera recorded the test. The video cameras were placed on either side of the beam during testing. Because cracks are more difficult to visually detect in a prestressed beam than in a conventional reinforced beam, the video footage was used to relate displacements with when cracks were visibly—as well as audibly—
noticeable. Individual tasks were assigned to each individual: time-keeping, data acquisition, video camera start and stop, still camera, watching for cracks and recording the time and load at which they occurred, etc.
The beam was initially loaded to 5 kips to test instruments. Afterward, the load was removed, the instruments were re-zeroed, and testing began. During loading, observers stood behind safety screens but watched for cracks. None were seen in this first loading stage. Once the load reached 22 kips, loading stopped, and the team checked the beam for cracks at close range. Then the beam was loaded to failure. A series of well-distributed cracks formed over the central 5’ or so of the
Strand Vices
Stand-Off
beam. Eventually one crack, almost exactly at mid-span, dominated and became much wider. A load noise was heard, the large crack opened much wider, and the load dropped. The beam failed from crushing of the cover concrete above the confinement cage. The concrete in the cage appeared to be largely intact. The peak load was 40.8 kips, and the corresponding deflection was 2.23”.
Figure 9. Beam at Failure
Results
After the testing, collected data was used to plot the load-deflection curve shown in Figure 6.
According to Figure 6, the load-deflection curve appears to be nonlinear, but the beam was still elastic with unbonded strands stretching inside. The reason for this is that the beam’s cross- sectional area was changing after the cracks formed.
During testing, the team checked for any cracks formed at certain loads. At 22 kips, loading stopped for the PCI representative to check for cracks, and he found none. However, the curve seems to have lost its linearity at around 22 kips. Figure 11. shows a zoomed in version of the plot for loads from 15 to 25 kips.
The curve appears to be only slightly non-linear which may have been caused by micro-cracks.
15 17 19 21 23 25
0 0.1 0.2 0.3 0.4 0.5 0.6 0.7 0.8 0.9 1
Load (kip)
Deflection (in)
Figure 11. Load-Beam Deflection Curve: 15 - 25 kip Loads
R² = 0.99658
0 5 10 15 20 25 30 35 40 45
-0.5 0 0.5 1 1.5 2 2.5 3
Load (kip)
Deflection (in)
Figure 10. Load-Beam Deflection Curve
Upon beam failure, the team determined that the ultimate load was 40.8 kips, which was 0.2% larger than the predicted 40.7 kips. From Figure 10. and audibly from the video footage, the first crack was determined to be around 26.0 kips, which was 2% smaller than the predicted 26.5 kips. Meanwhile, the deflection at peak load was found to be 2.23”, which was 67% smaller than 6.69”.
After failure, one major crack was found at the middle of the beam. This suggests that the force was concentrated at the middle of the two loading points. Beam failure occurred when the top flange concrete crushed. The deflected shape of the beam was V-shaped rather than U-shaped because as the beam had unbounded strands which distributed the moment throughout the strands and could deflect larger and quicker within the beam relative to the concrete.
Because the predicted deflection and the actual deflection were so different, the team set out to determine what went wrong during prediction calculations. With the failure load, actual deflection, and Dr. Beam software, the peak moment could be found, which in addition to a self-weight moment yielded a total moment of 1740 k-in. The force in the strands was then found to be 152 kips. From there, the deflection at the ultimate load can be back calculated to be 1.89”, which is 17.9% smaller than the actual deflection but much closer to the actual than in the previous prediction.
This may have been caused by two events:
• Strands yielding and behaving nonlinearly
• Unbounded length being shorter or longer than used due to construction All calculations can be found in the Appendix.
Lessons Learned
Throughout the competition, the team has learned many lessons design, construction, and post- failure analysis.
The first lessons came from prestressed concrete topics. Prior to and during competition, most of the team member had not taken any Prestressed Concrete course. Consequently, the team did not know much about prestressed concrete, but throughout the competition, the team learned about the difference between reinforced concrete and prestressed concrete. They learned about the different modes of failure, different tensile reinforcement, and different concerns for deflection.
After understanding the basics materials, the team was able to design their own prestressed concrete beam.
The team also learned the importance of communicating through clear drawings—how to draft the beam using AutoCAD and how to use elevation, plan, and cross-section views to communicate their ideas to CTC. They found that appropriate selections of drawing views and dimensioning were key in good communication and that it could save time for repeating revisions.
The largest lesson learned in construction occurred in shear reinforcement construction. The team was responsible for constructing the beam shear reinforcements. They learned how to use a torch to hot bend long spans of reinforcement—that is, the cage and web reinforcement—and to use hand tools to cold bend short span reinforcement—that is, stiffener reinforcement. They not only learned about tool operation but also about the close correlation between design and construction.
In designing the confinement cage, the dimension of the reinforcements was pushed to the design code’s limit to maximize concrete confinement. While constructing the cage, they discovered how difficult it was to follow design dimensions. As a result, they decided to simplify the cage geometry.
Moreover, they learned the importance of construction planning because brainstorm types of tools to use and sequencing the construction saved the team a lot of time.
Last year’s beam had stiffeners that catastrophically failed during testing. As a result, this year’s stiffeners were designed to be beefier by increasing their width and reinforcement. The team was glad to find that the stiffeners remained intact after failure.
The team chose to use lightweight concrete to decrease beam self-weight. The results showed that the beam’s performance was comparable to high strength concrete. The compressive strength of the lightweight concrete was 9,220 psi with a modulus of rupture around 986 psi. Although costs were higher with lightweight concrete, the benefits offset the cost increase.
Using and analyzing unbonded strands introduced many new concepts to the team. The team decided to use unbonded strands to increase the deflection during loading, but results showed that unbonded strands did not help much with deflection. Although the unbonded strands would have allowed for wider cracks, the top flange concrete limited beam deflection, and the beam failed from crushing due to the high compressive stresses. Apart from concrete crushing between the loading points, most of the concrete remained intact. If unbonded strands were to be used to increase deflection, a different type of concrete may be considered for concrete between and around the loading points.
Because of a designed bonded length of about 3’ on either end, the team prepared for strand slippage by adding strand vices for increased anchorage. However, to the team’s surprise, no slippage occurred. Had slippage occurred, the strand vices would have exerted such a large force on the stand-offs at the beam ends that they wouldn’t have been as easy to remove. The concrete strength, and possibly the web reinforcement, may have contributed to the excellent bond.
Rarely do engineers get to design, construct, and test to failure. The team is thankful for the opportunity to do so, and the experience and the lessons learned will no doubt serve the team well as they move on to their future careers.
Appendix
1. Certification from CTC 2. Test summary form 3. Calculations
a. Prediction of cracking load, max moment, and deflection at max moment b. Post-Failure Analysis
c. Cost and weight
4. Total load/midspan deflection graph 5. Concrete Specifications
6. Strand Specifications
7. Drawings of beam cross section(s) and elevation
Predictions: Deflection
Failure Deflection
According to ACI, the following equation is used to calculate the !!"
!!"=!!"+!!!+ !!!
100×!!=170.9!"#+9.2!"#+ 9.2!"#
100×4×0.1519!!! 6!"×13in
=191.9!"#
Then, ∆!! can be calculated using !!".
∆!!=!!"−!!"
!! =191.9!"#−170.9!"#
28400!"# =7.398×10!!
After that, assuming c = 1 in, ∆!!" can be calculated by calculating !!".
!!"=!"#$%&! !"#$"%&%!!"#$%ℎ +!!"−!!"
1000 ×!!
!!"= 10!7+10'11"+10'+10'11
4 +0.1×191.9!"#
1000 ×1/2"!
!!"=127.26!"
∆!!"=∆!!×!!"!
∆!!"=7.398×10!!×127.26!"!
∆!!"=0.0941!"
The following can then be used to calculate ∆! (assume c = 1in).
∆!= ∆!!"
!!−!= 0.0941!"
13!"−1!"=0.00784!"#
Finally, the expected deflection can be calculated
∆!↓=!!"#$
2 ×∆!=17×12!"
2 ×0.00784!"#=0.800!"!!
The deflection calculated was too low by using the ACI method. This may be due to the value of !/ℎ. The length-to-height ratio for the beam is 17×12!" /18!"=11.33, but this value is far larger than the value from ACI when they are dividing the equation. Therefore, the ACI method may not be suitable for this beam.
!!"=!!"
!!= 170.9!"#
28400!"#=0.00602
!!"=!!"+∆!!⇒∆!!=0.00398
By using the PCI code, the following equation can be used to calculate !!".
!!"=268− 0.075
!!"−0.0065<0.98!!" !"# !!"#ℎ!270!"#!!"#$%&!
!!"=268− 0.075
0.01−0.0065!
!!"=246.57!"#
Then, c can be calculated.
!!=!!"=!!"×!!=246.57!"#×4×0.1519!!!=149.82!"#$!
!= !!
0.85×!!!×!= 149.82!"#$
0.85×9.2!"#×6!"=3.193!"!
!= !
!!=3.193!"
0.65
By repeating the steps above. The failure deflection is calculated to be 6.39in.
Total Deflection
Deflection due to camber is calculated to be 0.148 in based on our pre-stress spreadsheet.
Deflection due to cracking load is 0.154 in based on our pre-stress spreadsheet.
The total deflection can be calculated using the following formula,
∆!"!#$=∆!"#$%&+∆!"#!"#$%+∆!"#$%&'!
∆!"!#$=0.148!"+0.154!"+6.39!"!
∆!"!#$=6.692!"
Predictions: Cracking Load
We are using the following equation for calculating the cracking moment, !!",
−!!
! −!!!!
! +!!"
! =!!"
−170.9!"#$×4×0.1519!!!
80!!! − 1.175+3.175+5.175+7.175 !"×170.9!"#$×0.1519!!!
300.259 + !!"
300.259
=0.965
!!"=1113!!"#−!"!
By that, we can calculate the cracking load, !!",
!!"= !!"
!!"#$%&'!!"!!"##$%& =1113!"#−!"
7×12 !" =13.25!!"#$!!"#!!"#ℎ!!"#$%&'!!"#$%
Predictions: Ultimate Load
Ultimate moment can be calculated using the following equation,
!!"#=!!"× !−!
2 !
!!"#=149.82!"#$× 13!"−3.193!"
2 !
!!"# =1708.5!"#−!"!
The ultimate load can be calculated using the following equation,
!!"#= !!"#
!!"#$%&'!!"!!"##$%&=1708.5!"#−!"
7×12!" =20.34!"#$!!"#!!"#ℎ!!"#$%&'!!"#$%
Comparing Predictions with Results
Equations
(1) !"#$"%&!!"!!"#"$%"=|!"#$%&!!"#$%!!!!"#!$%&'(!!"#$%|
!!!"#!$%&'(!!"#$% ×100 Calculations
For ultimate load,
!"#$"%&!!"##$%$&'$!!"#!!"#$%&#'!!"#$=40.8−40.7
40.7 ×100%=0.2%
For the first crack,
!"#$"%"&!!"##$%$&'$!!"#!!ℎ!!!"#$%!!"#!$ =26.5−26
26 ×100%=1.9%
For maximum deflection,
!"#$"%&!!"##$%$&'!!"#!!"#.!"#$"%&'()=2.23−6.69
×100%=66.7%
Post-Failure Analysis
Equations (2) !=
∆!
!
!!!!! (3) ∆!"#$%&'(=!"!
(4) ∆!"!#$=∆!"#$%&'(+∆!"#$%&+∆!"#$%&'"(()$*
(5) !!=!! !!−!! !.!"!!!
!!!
(6) !"#$"%&!!"##$%$&'$=!"#$%&!!"#$%!!!!"#!$%&'(!!"#$%
!!!"#!$%&'(!!"#$% ×100%
Calculations
∆!=1"
!!=13”
!=2”
!=17!
!!=1740!−!"
From our predictions,
∆!"#$%&=0.148”, ∆!"#$%&'"(()$*=0.154”
From Equation (2),
!= 12
13−1 = 1 24 From Equation (3),
∆!"#$%&'(=17×12× 1
24
2 =1.59"
From Equation (4),
∆!"!#$=1.59+0.148+0.154"=1.89"
By using the “goal seek” tool in Excel with Equation (5),
!!=152.2!!"#$
From Equation (6),
!"#$"%&!!"##$%$&'$=2.23−1.89
2.23 ×100=17.9%
Length (ft) =18
Typical Cross-Sectional Area Calculation Detail Volumes
Flange Width (in) = 6 Triangular Volumes (in3) = 25.375 Top Flange Height (in) = 5 Loading Point Stiffener Volumes (in3) = 113.75 Bottom Flange Height (in) = 4
Web Height (in) = 7 End Triangle Volumes (in3) = 6.125 Web Width (in) = 2.5 End Stiffener Volumes (in3) = 576 Sloped Run (in) = 1.75
Sloped Height (in) = 1 Beam Weight
Web Area (in2) = 17.5 Beam Volume (in3) = 17085
Sloped Area (in2) = 4.25 (ft3) = 9.89
Top Flange Area (in2) = 30 (yd3) = 0.3662
Bottom Flange Area (in2) = 24
Unit Weight (pcf) = 109.8 Typical Cross-Section Area (in2) = 75.75
Beam Weight (lb) = 1086
Cost Amounts of Steel
Unit Cost Cost
(ft2) lb/sf Total Concrete ($/cu yd) 110 40.28
Steel Plate 0.94 20.4 19.27 WWF ($/lb) 0.50 18.00
WWF 59 0.61 35.99 Plate Steel ($/lb) 0.06 1.06
(ft) (lb/ft) Strands ($/ft) 0.3 21.60
Regular #3 Rebar 36 0.376 13.536 A615 ($/lb) 0.45 6.09
Forming ($/sf) 1.25 6.01 Surface Area Calculations
Total Cost ($) = 93.03 Surface Area of Stiffeners (in2) = 73
End Stiffener SA (in2) = 63.5 Beam SA without Detailing (in2) = 7758
Mr. Beam Cost and Weight Calculations
R² = 0.99658
0 5 10 15 20 25 30 35 40 45
-0.5 0 0.5 1 1.5 2 2.5 3
Load (kip)
CONCRETE TECHNOLOGY CORPORATION
SHEET: 1 of 1
JOB NAME: U.W. BIG BEAM 2014 BY:
JOB NO.: 15X05A DATE:
Target Values per ONE CUBIC YARD yield
MIX #: LOB2 = =
Cementitious Material S.G.
Cement: 610 lbs. 3.15
Flyash: 135 lbs. 2.00
Silica: 0 lbs. 2.20
Slag: lbs. 0.00
Aggregate (SSD) Absrp.
Fine: 800 lbs. = 44 % of total aggregate 1.82 10.0 Coarse: 1,000 lbs. = 56 % of total aggregate 1.50 8.0 Water
Water: 298 lbs.
=
35.7 gal. 1.00Admixtures (oz./100 wt)
WRDA 64: 0.0 = 0.0 oz.
=
0.00 gal. = 0.0 lbs. 1.21 Adva 575: 6.0 = 44.7 oz.=
0.35 gal. = 3.1 lbs. 1.07 DCI: 0.00 = 0 oz.=
0.00 gal. = 0.0 lbs. 0.84 Daravair 1000: 0.0 = 0.0 oz.=
0.00 gal. = 0.0 lbs. 1.00Entrained Air: %
Σ 2,846 lbs. Σ ft3
γ Fresh Conc.: 105.4 pcf Target Volume: ft3
w/c : 0.400 Total Volume Air: ft3
mortar: 16.0 cf/cy % Air:
Moisture Content Corrections
Total Moisture Content (%) Constants
Cement: 0.0 = 0 lbs free water Density of Water: pcf
Flyash: 0.0 = 0 lbs free water (1) Gallon: ft3
Silica: 0.0 = 0 lbs free water (1) Gallon of Water: lbs.
Fine: 14.04 = 29.4 lbs free water (1) Gallon of Water: oz.
Coarse: 10.86 = 26.5 lbs free water
Corrected Aggregate Weights %
(1+MC)*Sand: 829.4 lbs. 0
(1+MC)*Rock: 1,026.5 lbs. 10
Total Free H2O: 55.9 lbs. 26.2
(Target)-(Free): 242.1 lbs. = 29.0 gal.
Estimated Fresh Concrete Temperature (F) 66.38
62.4 0.1337
0.00 0.05
27.00 0.26 0.98 0.00 26.74
3.10
0.00 4/14/15 MIX DESIGN WORKSHEET
ADM
0.00 ($0)
Vol. (ft3) $ 38.34
7.26 0.00
6.53 7.98 0.00
0.00 0.00 1.08
Volume
0 Air 0.26
6.28 0.00
8.34 0.00
7.04 10.68
0.00
128 4.78 0.00
28.1
Weight
4.78 4.19 Sand
298 745 800
Water
7.04 Cementitious
H:\Engr\Big Beam 2015\Mix Design\[Cylinder Break Summary.xlsx]Rev 4
CONCRETE TECHNOLOGY CORPORATION REV:4 DATE:
BIG BEAM 2015 - CYLINDER TEST DATA BY:ADM SHEET: 1 of 1 CYLINDER TEST SCHEDULE
FLEXURE BEAM TEST SCHEDULE
PLOT OF STRENGTH VS AGE
5/5/2015 993 997 995
6/1/2015 1,009 972 978 986
Beam 1 Beam 2 Beam 3 Average
Date MOR (psi) MOR (psi) MOR (psi) MOR (psi)
5/26/2015 9,420 8,920 9,170
6/1/2015 8,860 9,580 9,220 3,694
5/12/2015 9,220 8,850 9,035
5/19/2015 8,850 8,800 8,825 3,481
4/28/2015 8,020 8,190 8,105
5/5/2015 7,280 8,340 7,810 3,296
4/20/2015 6,710 6,290 6,500
4/22/2015 7,690 7,030 7,360 2,919
4/15/2015 1,940 2,480 2,210
4/17/2015 5,480 5,300 5,390
6/1/15
Cylinder 1 Cylinder 2 Average
Date f'c (psi) f'c (psi) f'c (psi) MOE (ksi)
0 1,000 2,000 3,000 4,000 5,000 6,000 7,000 8,000 9,000 10,000
0 4 8 12 16 20 24 28 32 36 40 44 48
Compressive Strength (psi)
Age (days)
2014 Trial Batch 2014 Production Batch 2015 Production Batch