Planejador e analisador de implantação de dispositivos orientados por cluster para redes sem fio não móveis aplicadas a cenários de redes inteligentes / Ladislav Vrbský. PALAVRAS-CHAVE: Algoritmo de agrupamento; Qualidade de Serviço;Rede Inteligente; Redes de comunicação; Planejamento de redes de comunicação.
Motivation and Problem Definition
The vision of smart grid is a general development of the entire electrical grid towards a more stable, efficient and environmentally friendly system. However, a gap is observed in the development of methods for optimal planning of data networks for smart grid, considering the limitations of the different kinds of smart grid applications.
![Table 1.1: Analogy between the internet and evolving smart grid. [Emmanuel and Rayudu, 2016]](https://thumb-eu.123doks.com/thumbv2/123dok_br/19745453.0/24.892.143.792.174.521/table-analogy-internet-evolving-smart-grid-emmanuel-rayudu.webp)
Objectives
However, in this work, the goal is to reduce the total accumulated delay, and the QoS requirement for each of the subscribers is not met. Based on the resulting QoS from the case study, an analysis will be performed to validate the suitability of the used communication network configuration for the given scenario.
Work Organization
The structure, together with the main parts of the methodology, is also described in this chapter. Finally, chapter 7 concludes the work with a summary of the work, followed by the contributions of this work in different directions.
Smart Grid Communication
It is a two-way communication network consisting of a number of integrated technologies and applications: smart meters, sensors, wide area communication infrastructure, home area networks (LAN), meter data management systems, and operational gateways [NETL, 2008; Mahmood et al., 2015]. The main applications of this communication are [Bakken et al., 2011]: (i) state estimation; (ii) system protection for large areas; (iii) area-wide situational awareness; and (iv) post-event analysis.
Smart Grid Standards
Seamless interoperability, robust information security, increased security of new products and systems, a compact set of protocols and communications exchange are some of the objectives that can be achieved through smart grid standardization efforts [Gungor et al., 2011a]. Finally [Fang et al., 2012; Fan et al., 2013; Chatzimisios et al., 2013] also examine several major roadmaps and studies on standardization of smart grids in different countries.
![Table 2.1: A Brief Comparison between the Existing Grid and the Smart Grid [Farhangi, 2010], [Fang et al., 2012]](https://thumb-eu.123doks.com/thumbv2/123dok_br/19745453.0/32.892.267.670.194.430/table-brief-comparison-existing-grid-smart-grid-farhangi.webp)
Device Standardization
IEC 61850
IEEE P1901 High-speed powerline communications, multimedia applications, services and smart home networks ITU-T G.9955. Specification developed as a cost-optimized, low-power power line network specification standard for smart grid applications.
![Table 2.2: Overview of Smart Grid Standards [Gungor et al., 2011b]](https://thumb-eu.123doks.com/thumbv2/123dok_br/19745453.0/35.892.128.807.211.1105/table-overview-smart-grid-standards-gungor-et-2011b.webp)
Intelligent Electronic Device
Distribution Feeder
Final Considerations
The Role of Data
The goal of ML is for the model to automatically find rules based on the provided data. 18 It is important that data must be 'good' in various aspects, because the final model can only be as good as the underlying training data. For this reason, raw data usually needs to be 'cleaned' and pre-processed before being used for learning.
Supervised Learning
- Classification
- Overfitting
In both types of classification above, a softmax function is often applied to the data classification results. Softmax transforms a set m of arbitrary real value measurements C into probabilities σ(m)i for each of the classes C si. The purpose of regression is to find a regression model that describes the relationship of variables, i.e.

Unsupervised Learning
When training error is much lower than test error, the model is likely to be overfitted. If a model learns to give correct results even for existing outliers, the model is likely to be overfitted. The concept suggests that the model should not aim to be too precise if this would mean a significant increase in complexity.
Clustering
- K-means
- K-medoids
- Agglomerative Hierarchical Clustering
- Affinity Propagation
The disadvantage is the inability to process categorical data and the fact that the algorithm is not suitable for non-convex cluster shapes. It demonstrates the division or merging performed at each level of the algorithm and shows the resulting clusters for a dendrogram crop at each level. Although the value of k can be affected by the diagonal of the given similarity matrix, the number of clusters is determined by the algorithm [Cheng and Day, 2014].
Final Considerations
First, [Silva, 2014] investigates the effect of network topology on communication QoS in a smart grid scenario using an analytical model. In [J´ulio, 2015], the state space of possible topologies was searched using a genetic algorithm and Dinitz's max flow algorithm was used to calculate the maximum flow in the network graph. This thesis also shares the objective of minimizing the overall QoS of the network in a given scenario.
Related Work
One of the main points that the work investigates is the influence of interference on the coverage. One of the engineering and research challenges in the communication technology area of smart grid in [Sooriyabandara and Ekanayake, 2010] is QoS provisioning. Bakken et al., 2011; Alcatel-Lucent, 2010]; propose conceptual architectures for implementing data transmission networks capable of meeting the constraints of smart grid applications, e.g.
Final Considerations
According to the article, modern QoS concepts considered by most communication networks and application developers will not be sufficient in the smart grid networks. It is therefore considered that the proposal of this thesis is original and contributes with a network deployment strategy model that studies QoS in the network. In the remainder of this thesis, the terms user, subscriber and IED are used interchangeably.
Motivation and Objective
It is necessary to ensure that the QoS requirements are achieved by smart grid applications defined by standards, such as IEC 61850. Considering the results of step 5, an analysis should be performed to determine the suitability of the used communication network configuration for the given scenario . In this work, QoS is the key performance indicator of network suitability in a given scenario.
Scenario Definition
Subscriber Configuration
Along with the coordinates, each node is specified by the size of its messages and maximum tolerated delay for both uplink and downlink. Therefore, for both uplink and downlink, each user type has a defined amount of bits to transmit, which is a sum of its message sizes in the direction, while the maximum tolerated delay per user is the minimum of its defined message delays in that direction. Communication types that specify the amount of data to be transferred and maximum tolerated delay, separately for uplink and downlink;.
Network Configuration
Methodology Components
- Clustering
- Graph Topology and Delay Calculation
- Results and Visualization
- Restricted Mode
With it, the data rates of the links are calculated, in the case of wireless communication links. A well-informative result formulation is important, so that the usefulness of the methodology is not reduced. A restricted mode is also possible, but it is not part of the methodology itself.

Final Considerations
After describing the concepts and techniques in the previous chapters, this chapter defines the configuration of the model from chapter 5, specific test cases used, as well as the performance analysis itself. Before the presentation of the two-level cluster model introduced in the previous chapter, the following sections present the results of a single-level version of the model. For that reason, the model has been redesigned, making the two-level version more accurate.
Common Configuration
Coordinates
Communication Patterns
Following the above definitions, each message type was represented by one of the PICOM types. Furthermore, as stated in Chapter 5, each network subscriber (IED) is represented by the sum of message sizes, while the total maximum tolerated delay is the minimum tolerated delay of messages of a given user. Note that the Defense application uses type 1 messages for uplink and type 2 for downlink.
Restricted Mode
To maintain network configuration in larger scenarios with more IEDs, application mappings are scaled to maintain the above ratios. Furthermore, type 1, type 2, and type 3 messages are rated as high, medium, and low importance, respectively. To investigate this fact, this thesis uses a restricted mode that limits the communication in the network to only type 1 and type 2 messages, excluding the low importance messages of type 3.
Scenarios
Scenario A
The data transfer rate on the path between such an IED and the server must be high enough to send both messages within 1 ms. In [Silva, 2014], the top node is used as an access point and is excluded from the scenario in this thesis. When reconstructing the coordinates, it was taken into account that the angle between the edges is 180° or 90°, as shown in the diagram.
Scenario B
As discussed in Chapter 4, the work of [Silva, 2014] and [J´ulio, 2015] also uses this scenario for communication optimization. Concrete coordinates were reconstructed using these lengths and the published scheme of the network, shown in Fig. This is a challenging scenario, as the high density will also apply in the case of the installed cells.

Scenario C
Single-Level Model Configuration
Model Preparation
- Clustering Configuration
This matrix, with zeros on the main diagonal, is used throughout the algorithm to quickly obtain distances between samples. The algorithm also obtains a preference coefficient for each data sample, which serves as an initial indicator of the sample that is selected as CH. The coefficient for an ith sample is taken as the average value of the ith column of s.
Results
- Scenario A
- Scenario C
- Summary of Results
In comparison, affinity propagation selected a high number of clusters, k= 94, resulting in high QoS, close to 100. The results of AHC and affinity propagation of both the full communication mode and the limited mode are presented in Table 6.5, which summarizes all the 10 runs per table row at the mean and standard deviation values of the results. Affinity propagation is not recommended due to the high number of clusters it selected and the low QoS performance.
Two-Level Model Configuration
- Communication Network
- Antennas
- Time Division Duplex
- Delay Calculation
- Clustering
Calculation of channel capacity and message delays is described in Chapter 5 and parameter values are given in this chapter. It is also considered that each group communicates in one of the frequency bands given in table 6.6. Calculation of channel capacity and transfer rates is performed only for wireless connections.
Two-Level Model Case Study
- Scenario A
- Scenario B
- Scenario C
- Summary of Results
The configuration of the k-means algorithm is the same as in the case of the one-level model, given in section 6.4.1.1. Cluster sizes k1 = 40, k2 = 1 perform well enough to follow the QoS needs of all subscribers in the limited mode with 10 : 5 TDD ratio. In the case of Wi-Fi, QoS never reached 100% in the scenarios tested for regular mode.

Final Considerations
After literature analysis, the development of the second version of the model started, which means an almost complete redesign of the software project. Imperfections in the project were removed, leading to a better approximation of the real world. The 76 model helped guide the development of the final model, resulting in a more accurate, more customizable and better performing tool.

Contributions
Modifications of these features model interference and data traffic and enable the study of best- and worst-case scenarios with respect to scheduling, or anything in between. The source code of the two-level methodology implementation is publicly available under an open source license online1. Coordinates of new and completely different scenarios can be plugged into the tool to create a model to represent the scenario and study the network needed to deploy;.
Future Work
Energy Efficient Information and Communication Infrastructure in the Smart Grid: A Survey on Interactions and Open Issues. Optimizations of power consumption and provisioning in the smart grid: Analysis of the impact of data communication reliability. Impact of packet loss on power demand estimation and power supply costs in smart grid.
Sample distribution feeder. [Kersting, 2012]
An example of classifying a data set into two classes using Support Vector
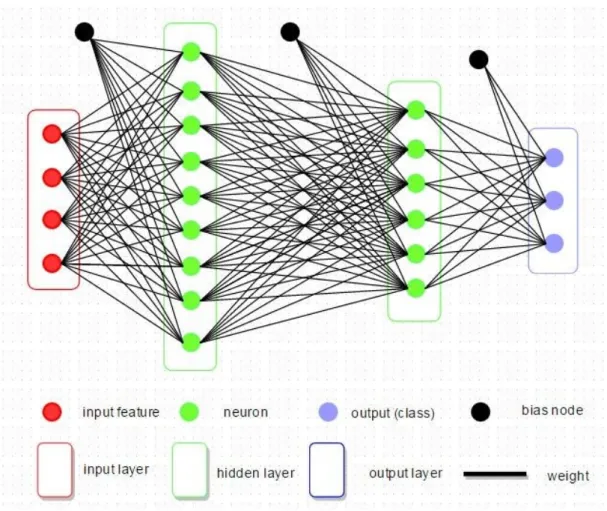
Example of an Artificial Neural Network structure for a three-class classifi-
Example of regression analysis performed over a set of datapoints
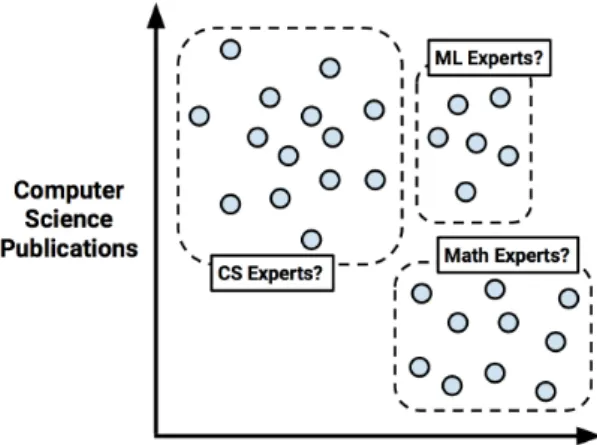
Clustering example
Communication structure of the proposed methodology
Example of a result visualization, showing access point and gateway posi-
Scenario of around 8500 feeders, 2469 of which were used in Scenario C [Ar-
Example result of network cell positions relative to subscribers as chosen
Resulting positions of network equipment relative to the 906 subscribers
![Figure 2.1: Sample distribution feeder. [Kersting, 2012]](https://thumb-eu.123doks.com/thumbv2/123dok_br/19745453.0/37.892.205.723.139.619/figure-2-1-sample-distribution-feeder-kersting-2012.webp)