Wall deflection had well-defined correlations with wall strength, vertical reinforcement, axial stress, and aspect ratio. A new nonlinear frame model approach was also evaluated to simulate the actual response of walls to load displacement. The idealized lateral response of the walls could be reproduced using the initial lateral stiffness of the linear models associated with the corresponding SPFs and final tip displacements.
The idealized curves agreed better with the actual response when the lateral stiffness of the linear models was closer to that of the reference walls.
LIST OF ABBREVIATIONS
PGA Aceleração de pico no solo PGD Deslocamento de pico no solo PGMW Paredes de alvenaria fundida PGV Velocidade de pico no solo. UFRJ Universidade Federal do Rio de Janeiro UFSCar Universidade Federal de São Carlos UoA Universidade de Auckland.
LIST OF SYMBOLS
INTRODUCTION
- OBJECTIVES
- SIGNIFICANCE OF RESEARCH
- THESIS SCOPE AND ORGANIZATION
Through the different potentials of experimental and numerical analyses, it is possible to distinguish how the characteristics of shear walls influence their behavior. Studies on masonry shear walls have contributed to a better understanding of the behavior of the system when subjected to lateral influences. Therefore, the purpose is to contribute to a better understanding of the topic and to support the planning, verification and detailing of shear walls in structural masonry buildings.
The parametric analysis investigates the influence of the constituent material properties, geometric aspects and loading conditions on the behavior of multi-storey perforated partially grooved masonry shear walls.
PARAMETRIC STUDY
- LITERATURE REVIEW
- PREVIOUS EXPERIMENTAL PROGRAM
- DESCRIPTION OF THE NUMERICAL MODEL
- Conceptualization
- Model validation
- PARAMETRIC EVALUATION
- Evaluated parameters
- Sensitivity analysis
- CONCLUDING REMARKS
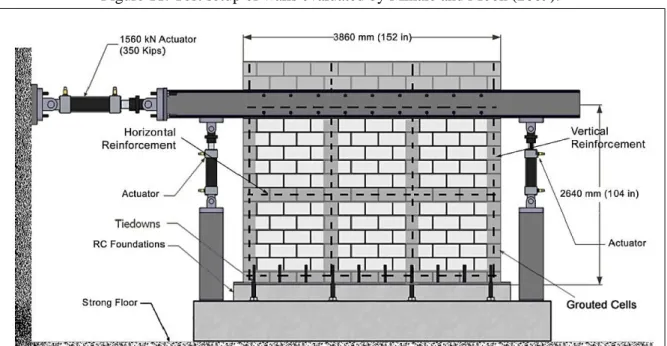
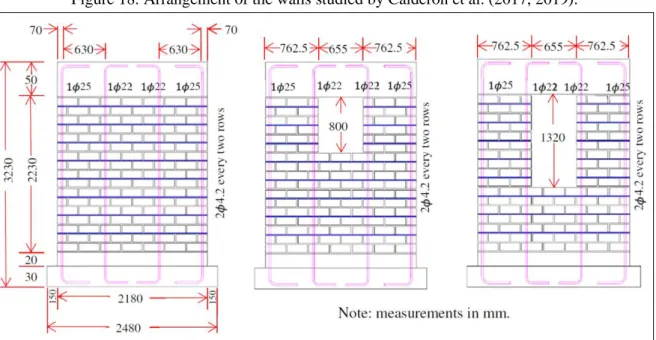
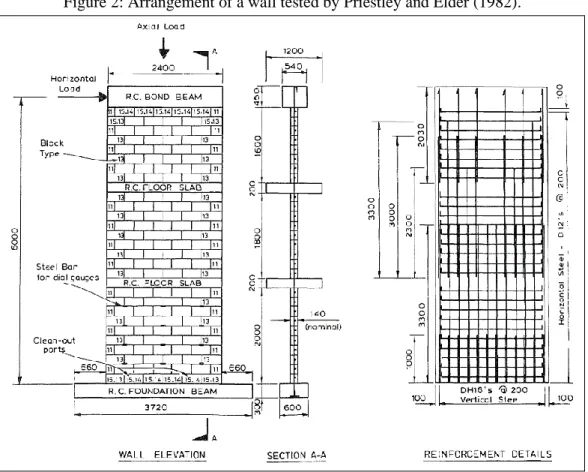
The general layout of the walls and the instrumentation used in the testing can be seen in Figure 8. The numerical model was compared with the experimental results of the walls that contained the window opening (walls W1, W2 and W3). The data showed that the performance of the wall was more sensitive to the vertical reinforcement than to the horizontal reinforcement ratio.
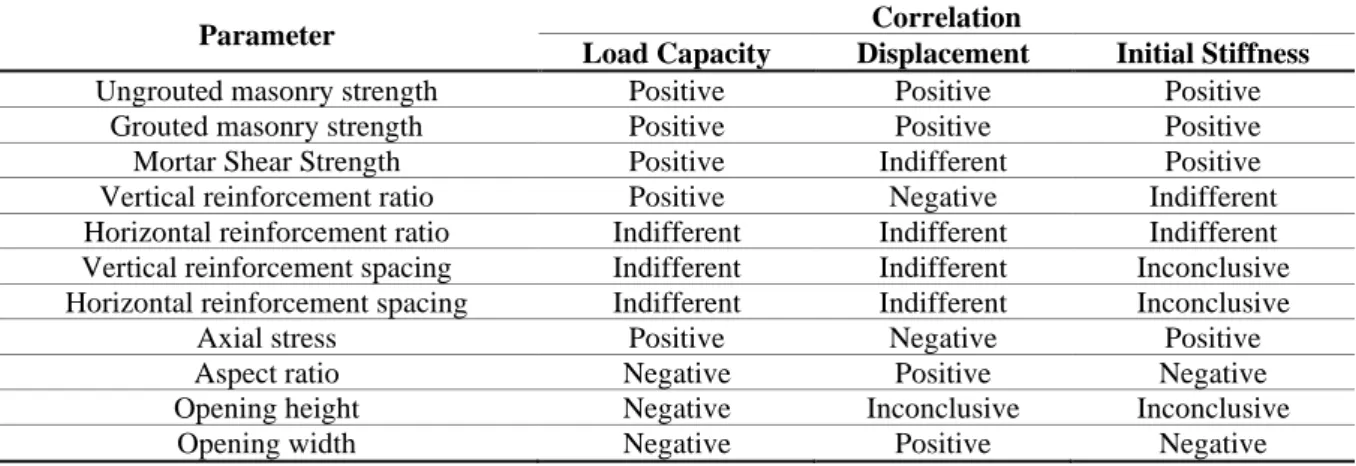
The correlations between the evaluated parameters and the behavior of the walls are summarized in Table 20. A clear relationship between the deflection of the walls could not be observed with the opening height. As with load-bearing capacity, the initial stiffness of the walls was only negatively correlated with aspect ratio and opening width.
SHEAR LOAD CAPACITY PREDICTION
- LITERATURE REVIEW
- Determination of flexural load capacity
- Equations for shear load capacity
- Load capacity of perforated walls
- DATABASE
- Numerical walls
- Experimental walls from the literature
- SHEAR LOAD CAPACITY PREDICTION OF UNPERFORATED PARTIALLY GROUTED MASONRY WALLS
- Equations from the literature
- New proposed equation
- Accuracy of the equations
- SHEAR LOAD CAPACITY OF PERFORATED PARTIALLY GROUTED MASONRY WALLS
- Examined approaches for predicting the shear capacity
- Accuracy of the approaches for predicting the shear capacity
- CONCLUDING REMARKS
According to the standard, for general cases, the basic contribution of the masonry to the shear (𝑉𝑏𝑚) equal to 0.2√𝑓𝑚′ is allowed. Voon and Ingham (2007) proposed minor changes in the expression of the nominal shear capacity adopted by NZS. The lateral load capacity of the wall is now more conservatively limited to 0.33𝑏𝑤𝑑√𝑓𝑚′. f) Canadian Standards Association (CSA S304, 2014).
The contribution of the axial load (𝑃) to the wall capacity is considered to be equal to 0.25𝑃, while the horizontal reinforcement contributes to 0.5𝐴ℎ𝑏𝑓𝑦ℎ𝑑𝑣. 𝐴𝑣𝑓 is the total area of the outer vertical reinforcement; 𝑓𝑦𝑣𝑖 is the yield strength of vertical inner reinforcement;. The authors concluded that the analysis method, taking into account the lateral load-bearing capacity in relation to the net cross-section of the walls, is conservative.
It was found that the standard equation adequately predicts the bearing capacity of the wall and represents the ratio 𝑉𝑒𝑥𝑝⁄𝑉𝑛 = 1.003. The equations are summarized in Table 25, which separately shows the contribution of wall (Vm), axial load (Vp) and reinforcement (Vr) to the nominal SLC of the wall. In order to avoid unconservative predictions, the influence of horizontal reinforcement was carefully included in the newly proposed equation.
The SLC of the walls was estimated with an average ratio Vn,pred/Vmax,average of. The equation of Oan and Shrive (2014) estimated the shear capacity of the walls with similar statistical indicators to the codes. The horizontal effective cross-sectional area is subtracted from the cross-sectional area of the openings.
SA4 also accurately predicted the SLC of the walls with two openings in the same story, even when the openings were different (walls 67, 81, and 92).
SEISMIC BEHAVIOR AND PERFORMANCE
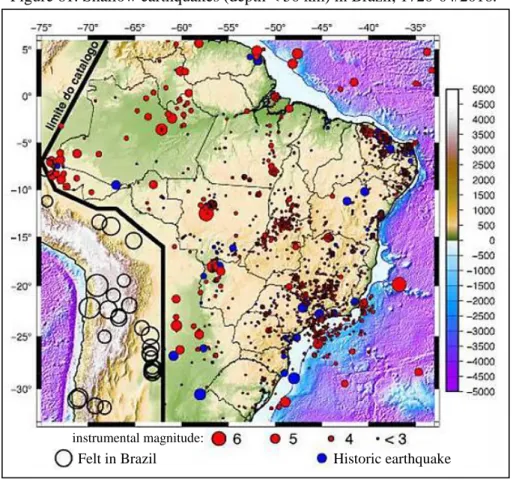
- LITERATURE REVIEW .1 Brazilian seismic context
- Seismic analysis methods
- Seismic parameters
- NUMERICAL MODELING
- DESCRIPTION OF THE BEHAVIOR OF THE WALLS
- NUMERICAL INVESTIGATION OF DIFFERENT DETAILING TYPES
- Seismic performance assessment .1 Strength and ductility
- CONCLUDING REMARKS
The balance is done by equating it to the product of mass and acceleration at the base of the building (vector 𝑠̈(𝑡)). For simplicity, the natural period of vibration can be calculated using equation 60, where W is the seismic weight, i.e., the vertical load applied to the wall, including self-weight, g is the gravitational acceleration, and K is the idealized stiffness of the wall. The configuration of the walls was similar to the end walls bounded by masonry columns analyzed by Shedid et al.
The lateral displacement profiles shown in Figure 76 show a linear approximation from the bottom to the top of the wall up to close to the maximum lateral load. As in Figure 76, the graphs include results for different proportions of the maximum lateral load in the pressure direction (from left to right) before and after the peak. The yield shift is found using equation 69 by equalizing the total energy (Ut), i.e. the area, under the actual and idealized curves.
The L (low) and H (high) prefixes have been reused in the wall names to differentiate the load cases. As shown in Figure 85, a similar effect of reinforcement details is observed in the crack pattern when the walls are subjected to higher precompression, but with less damage. In general, the lateral displacement profile along the wall height was linear up to the vicinity of the maximum lateral load, i.e. the wall behaved as a solid composite with shear deformations and a linear distribution of lateral load along the height.
Reducing the number of grouted/reinforced cells at the ends of the wall pier caused, as expected, a deterioration of the in-plane response of the walls. The reduction in the lateral load capacity was greater for the lower level of axial load, whereas the ductility decreased more in the situation of higher axial load;.
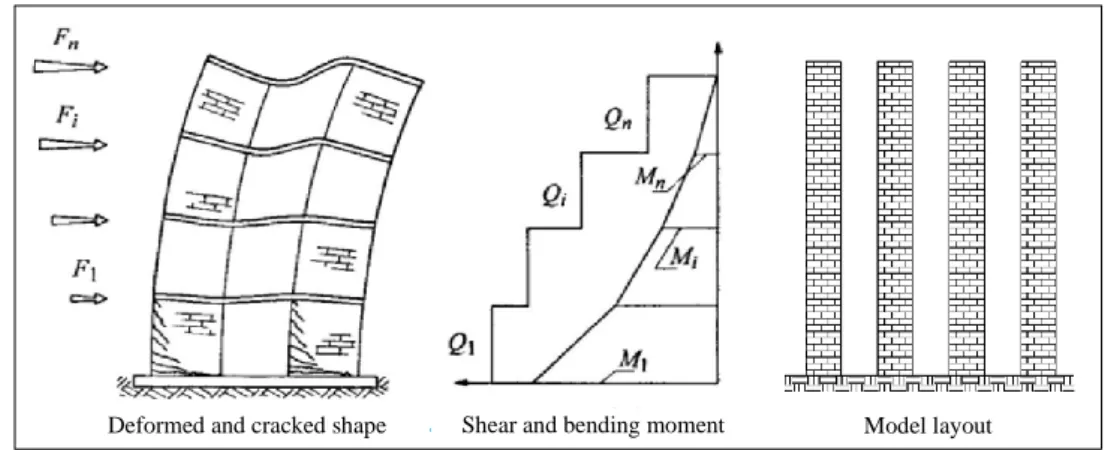
SIMPLIFIED FRAME MODELS
- LITERATURE REVIEW
- Behavior and structural idealization
- Case studies
- LINEAR FRAME MODELS .1 Modeling development
- Assessment of initial lateral stiffness, deflection, and load distribution
- Defining the envelope lateral response using SPFs and ultimate drifts
- NON-LINEAR BRACED FRAME MODEL .1 Modeling development
- Assessment of model performance
- CONCLUDING REMARKS
According to Paulay and Priestley (1992), the ductility (𝜇∆) of these walls is controlled by the torsional capacity (𝜃𝑝) of the plastic hinges formed at their bases, according to equation 82; where ∆𝑦 is the lateral elastic displacement at the top of the wall of height ℎ𝑤 and the plastic hinge assumed to be formed at half the height (𝑙𝑝⁄) of the first floor. Therefore, the resulting lateral force (F) at each floor must be distributed as a function of the relative stiffness (𝐾𝑖⁄∑𝐾𝑖) of the isolated walls in the considered direction, as shown in equation 86. As illustrated in figure 96, the plastic hinges bend , directed by the moment-rotation curve (M-θ), are usually placed at the ends of the effective length of the elements, while plastic shear hinges, directed by the force-displacement curve (V-δ), are placed. between the elements.
Lateral stiffness is one of the most important aspects in linear and non-linear design methods. The authors tested several variations of equivalent frame (EF) and plane finite element (FE) models for the typical wall. Furthermore, the inelastic analyzes showed that the response of these two models to the initial stiffness and the lateral load capacity of the wall were similar.
Otherwise, the cross-sectional area of the gussets (Equation 93) was determined by comparing their stiffness (Equation 94) with the shear stiffness of the undrained region in the related wall pier (Equation 95). Then the elastic load (Vel) is found by multiplying del by the lateral stiffness (K0) of the specific linear model. Regarding the linear frame models, the distribution of loads through the wall elements in the first floor of the nonlinear model BF is compared with results of the FE model.
As can be seen in Figure 121, there was good agreement between the envelope curves for model BF and the test walls up to the peak load. The deflected shapes of the lower precompression walls obtained with model BF are compatible with the experimental walls up to the peak load, as observed in Figure 123. As for the linear models, portal and braced frame models were tested to simulate the initial lateral stiffness of the walls.
The method of defining the lateral response of the wall is also sensitive to the imposed ultimate peak drift.
CONCLUSIONS
The initial stiffness of the walls was sensitive to variations in the raw and plastered masonry strengths, the shear strength of the joint mortar, and especially the axial and aspect ratio. Modifications to the opening size and spacing and size of the reinforcement had a smaller effect on the initial stiffness;. The absence of a term for the contribution of vertical reinforcement and/or the underestimation of the contribution of masonry caused by limitations in aspect ratio often served to balance the overestimation of the contribution of horizontal reinforcement and vice versa.
Of all the equations examined, those of TMS and CSA S304 (2014) yielded the most inaccurate estimates of the shear load capacity of the unperforated PGMW for both the computational and experimental datasets. Of the existing shear equations evaluated, that of Dillon and Fonseca (2015) made the best predictions for the walls of the numerical dataset, while the equations of Izquierdo et al. 2019a) were the most accurate for the walls of the experimental dataset;. The new proposed equation included the effects of aspect ratio, vertical and horizontal joints and reinforcement and axial load to ensure an appropriate level of accuracy in estimating the SLC of the walls.
The reduction of the effective horizontal cross-sectional area may be associated with the significant decrease in the SLC of the single-storey walls caused by the presence of gaps. Even in a smaller portion, the SLC of the walls also decreased as the window openings were replaced by door openings. Because the lateral load was applied at the top of the highest story, the diagonal struts found more masonry between stories to pass through, reducing the impact of the openings on multi-story walls.
The approach that considered the strength of the wall as the sum of the strengths of the wall piers with dimensions constrained by the diagonal shear cracking from the upper corner of the opening to the lower diagonally opposite corner of the opening of the same storey yielded the most accurate predictions . Finally, in addition to proposing a new accurate and complete shear equation for PGMW, this study indicates the need to update the shear expression of the TMS and CSA.