Professor Camacho has always been supportive throughout this project, with his expertise in data mining instrumental in the development of the Tamingo platform, including his leadership skills. Through DM techniques, it became possible to predict the results based on these cases and the structure of the molecules that identify the active ingredient of each drug.
Related Work
Data mining techniques can also find applications in other fields beyond pharmacovigilance, showing their wide applicability in different fields. This dissertation aims to further explore the potential of data mining techniques in pharmacovigilance and identify how they can be used alongside other methods for ADE detection and prevention.
Context
Another research paper, "Application of data mining data in pharmacovigilance highlights the importance of detecting potential ADEs using data mining techniques. The paper points out that traditional ADE detection systems are not efficient enough, and data mining techniques such as cluster analysis, link analysis, anomaly detection and disproportionality assessment can improve the accuracy and efficiency of ADE detection.
Goals
This article proposes a data mining approach to predict the length of hospital stay of dengue patients at the time of admission, which can be used to improve clinical decision-making and resource management in hospitals. The literature review shows that computational approaches, including network-based predictive models and data mining techniques, have shown significant potential in predicting and identifying potential ADEs.
Structure
Health informatics is an interdisciplinary field of study related to the wide range of resources that can be applied in the management and use of biomedical information, including computing and the study of the nature of medical information itself. At its core, HI represents the study of information in the delivery of health care.
Drug Interactions
The risk of drug interactions increases with the number of drugs used, meaning that 39% of seniors who take 5 or more drugs per day, as mentioned in the previous chapter, are at increased risk of side effects. There are three types of drug interactions: additive (the expected result when the effects of each drug add up), synergistic (a greater than expected effect from a combination of drugs that can sometimes be beneficial, although it can also increase the risk of overdose), and antagonistic (less effect than expected when combining drugs).
Relevant Web Repositories
Constitutional descriptors, such as the molecular weight and number of rotatable bonds, describe the composition of a molecule. Electronic descriptors, for example the molecular orbital energies and electron density, describe the electronic properties of a molecule [43].
Data Mining
A common use case of DM is pattern recognition, and it can be enhanced using various methods, namely anomaly detection, which is able to identify outliers in datasets. Clustering- Data elements that share specific characteristics are grouped into clusters as part of DM applications. It is worth noting that classification techniques such as decision trees can also be used to do regressions.
In general, DM tools are available as part of software platforms that also have additional data science and advanced analytics tools. Open source technologies are also available, examples being Orange, Weka, DataMelt, Rattle, Elki, and scikit-learn. Open-source options are also distributed by a number of software companies, where for example Knime merges an open source analytics platform with commercial software to manage data science applications, at the same time as companies like H2O.ai and Dataiku offer free versions of their tools.
Machine Learning
In ML, classification algorithms analyze input training data to predict the probability of the following data fitting into one of the predetermined categories. Random Forest - An extension of the decision tree, where the first step is to build a plethora of decision trees with training data, then fit the new data into one of the trees as a 'random forest'. When working with SVMs, the higher the data complexity, the higher the accuracy of the predictor.
SVMs are multidimensional, and this is one of the reasons why it allows for more accurate machine learning. It can be displayed as Yes/No, Green/Red, etc., where independent variables (categorical or numeric) are put under analysis to determine the binary outcome with results fitting into one of the two categories. The network is trained on a data set, adjusting the strengths of the connections between neurons, known as weights, to make accurate predictions or classifications on new data.
Graph Mining
The input is a set of labeled connected graphs (consisting of vertices and edges, with a pair of labels providing information about both vertices and edges) and a threshold called minsup (a value between 0 and 100 percent). The goal of frequent subgraph mining is to discover relevant subgraphs that appear in a series of graphs. In other words, the goal is to discover subgraphs common to multiple graphs.
This can be useful for finding bonds between chemical elements common to many chemical molecules. A frequent subgraph is a subgraph that appears in at least minus percent of the graphs from the graph database.
Evaluation Metrics
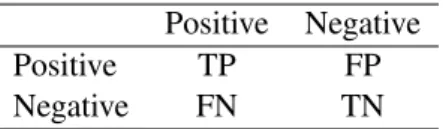
The interpretation of errors can be done fluidly and is less likely to struggle in the presence of deviants. It is necessary to set a null hypothesis as an assumption to understand a confusion matrix. F1 score- It is a fusion of precision and recall, and more specifically the harmonic mean of both.
Designed to make it easy to build web applications, it follows the Model-View-Controller (MVC) architectural pattern. One of the main advantages of using Django is that it is designed to be highly secure, and requires it. Because it's file-based, it's easy to set up and manage, and it doesn't require a separate server.
Layout and Design
This makes it an ideal choice for smaller projects, or projects that are not expected to handle a large amount of traffic. Furthermore, SQLite is known for its robustness and reliability, it can handle large datasets and concurrent requests well [4].
Capabilities
User Controlled Data Manipulation
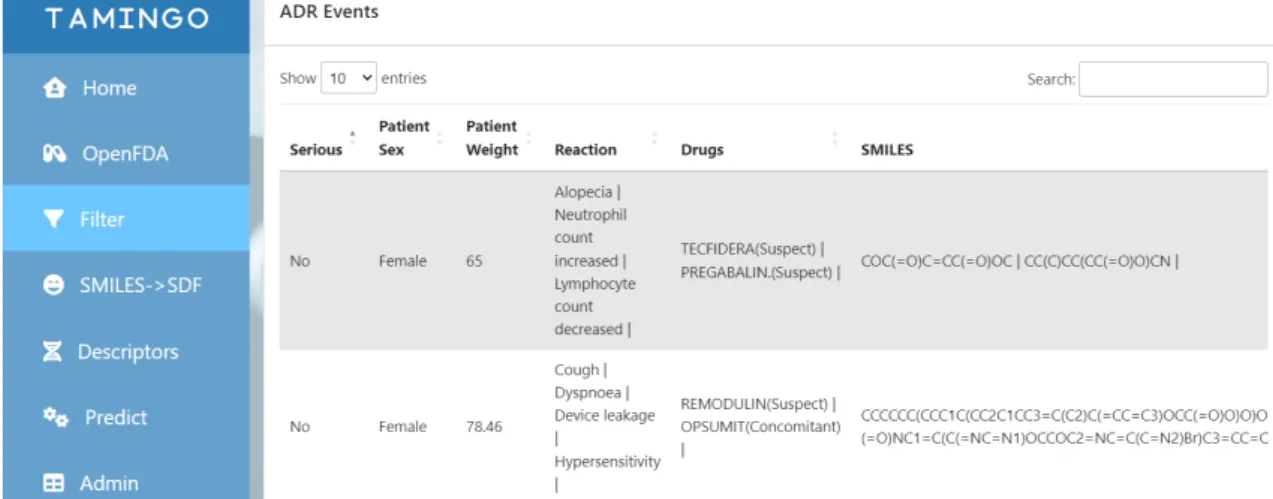
To ease the filtering process, the platform uses the Django filter library, which allows creating dynamic filters based on the data model. In the Tamingo platform, the data filtering functionality is flexible and easy to use, allowing them to easily access specific subsets of the data based on their preferences [17]. The user can filter the data in 8 different ways: by severity, gender, weight, reaction type, drugs, functional groups, categories or result.
By using machine learning in Tamingo, the platform can analyze large amounts of data and make predictions based on patterns and trends in the data. The user can access this feature from Tamingo's sidebar and make changes to the data if necessary. This feature is particularly useful for maintaining the accuracy and completeness of the data stored in the platform's databases, and can be used to keep the data up-to-date and relevant to user needs.
Automated Data Operations
Once the CID is obtained, the next step is to obtain the category of drug by use. The GetSubstructMatches() function is used to identify all instances of functional groups represented by SMARTS codes in a molecule. This process can be repeated for each functional group in the database, providing a comprehensive analysis of the functional groups present in a given drug.
Mordred is a powerful tool that can be used to calculate a wide range of molecular descriptors such as molecular weight, logP, TPSA, HBA and HBD, and it is recommended to perform these calculations after filtering the data to increase the fit of the cal. - calculated descriptors. It can be used to convert SMILES to SDF format using the functionality of the open source toolkit RDKit. The objective of this chapter is to provide an overview of data mining techniques that can be applied to ADE data and the potential benefits of these techniques to improve drug safety and efficacy.
Phase 2 - Personalized Dataset Creation
Phase 3 - Data Analysis
It works by training multiple decision trees on different subsets of the data and then averaging the predictions. This step aimed to improve the accuracy of the model by providing additional information about the drugs involved in the reaction. This step was important to reduce the dimensionality of the data and improve the performance of the model.
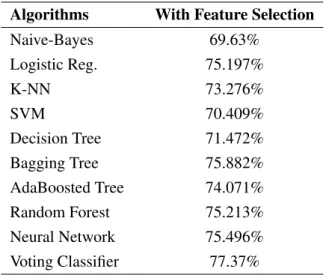
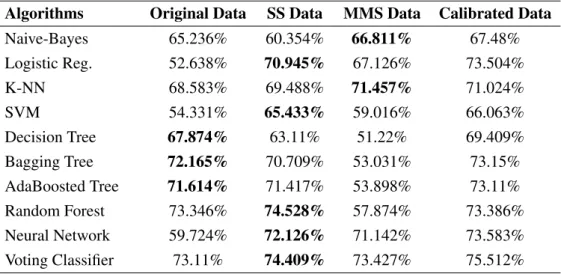
The results of this step showed that the performance of the algorithms improved slightly. The results of this step showed that the performance of the algorithms improved even more, with a notable increase in accuracy. The results of this step showed that the performance of the algorithms improved significantly, with a substantial increase in accuracy.
Reflection and Future Directions
For example, deep learning techniques such as convolutional neural networks and recurrent neural networks could be used for data analysis and prediction. The platform currently uses basic feature selection techniques such as variance thresholding and correlation-based feature selection. However, more advanced feature selection techniques, such as genetic algorithms or particle swarm optimization, could be used to identify the most relevant attributes and molecular descriptors for making predictions.
Risk factors for possible drug interactions in general practice. The European Journal of Family Medicine. Adrecs: An ontology database for standardization and hierarchical classification of drug adverse drug reaction terms. Mining and evaluation of statin-associated adverse event signals: data mining of the public version of the openfda adverse event reporting system.
Tamingo Use Case Diagram
Access Pre-Loaded OpenFDA Data
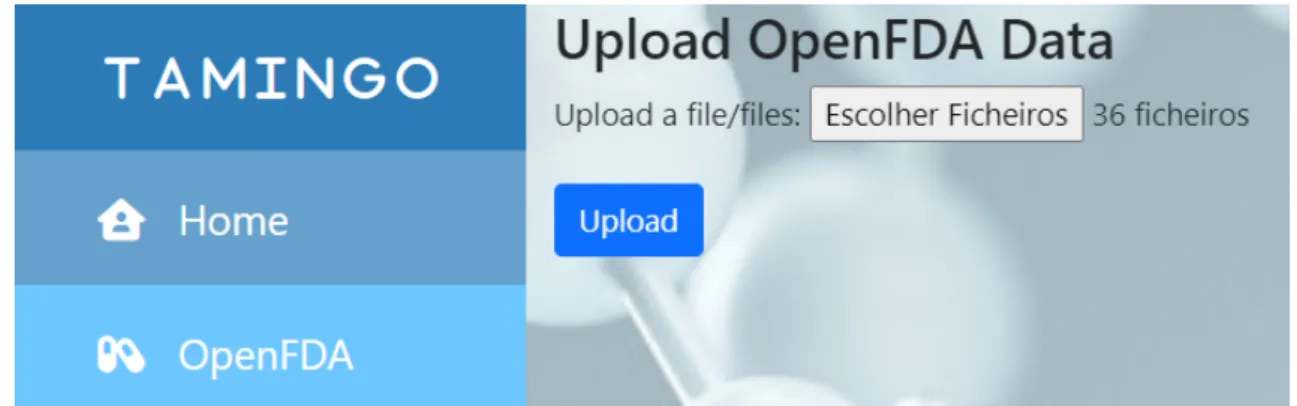
Upload OpenFDA Data
Filtering System
Confusion matrix example (rows: predicted values; columns: actual values)
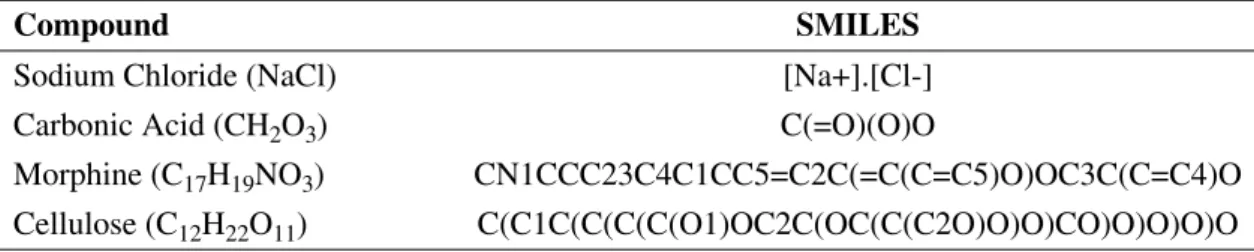
SMILES Syntax Representation
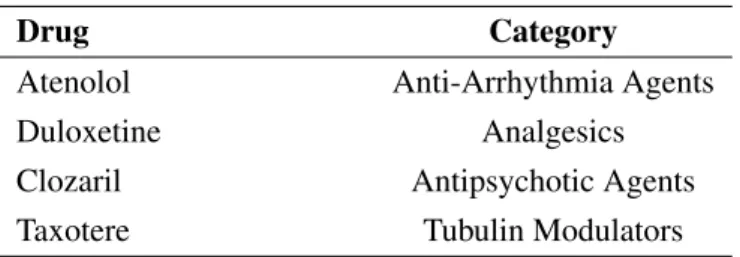
Drug Categories Examples
Step 1 Results
Step 2 Results
Step 3 Results
Step 4 Results