The accelerated decline of the labor share in the United States Labor share of non-agricultural business sector,1. We estimate that the fall in the labor share of income explains 18 percent of the gap between average wages and historical productivity growth rates.
Literature on the decline in labor’s share of income
They also note that the concentration increased mainly in the 1990s and the beginning of the 2000s, before the accelerated decrease in the share of work. 11. Contrary to some previous studies, investment in capital-intensive technology helped stabilize the labor share.12.
What we know about superstar firms and superstar sectors
Our approach
A micro-to-macro
For each sector and each of the five explanations, we perform a simple assessment to label them as “limited”, “relevant” or “highly relevant” and use this to allocate the sector's contribution to the total reduction in the share of work for these explanations.24. 24 The contribution of the sector to the total net increase in the capital stock is divided into factors defined as "important", with a weight of 1, and those defined as "very important", with a weight of 2.
Our definition of labor share and the scope of this analysis
For example, if we mark supercycles and boom-busts as "very important" and capital replacement as "relevant" in the mining sector, the former will account for two-thirds of the sector's contribution to net capital growth, and the latter one-third. We use an adaptation of the DuPont decomposition to identify the industries and economic variables driving the decline in the labor share.
We use an adaptation of the DuPont decomposition to identify industries and economic variables driving the decline in labor share
GVA – NOS 1
GVA – DEP
DEP GVA
NCS GVA
GO NCS
It is worth noting that some sectors experienced a decline in capital share over the period.27. For each of these sectors, we outline the impact played by depreciation versus an increase in net capital stock.
Ranking the main reasons for the decline in labor share
Our findings
We quantify the total increase in depreciation across all sectors in the economy and then focus on the 12 sectors that account for most of the increase in the net capital stock (Exhibit 5).26 These industries are representative of sectors of the entire United States economy with cyclical businesses, selected manufacturing sectors, technology services, and other services such as retail and transportation. This allows us to outline the potential drivers of equity growth, as highlighted in the next section.
The sectors and
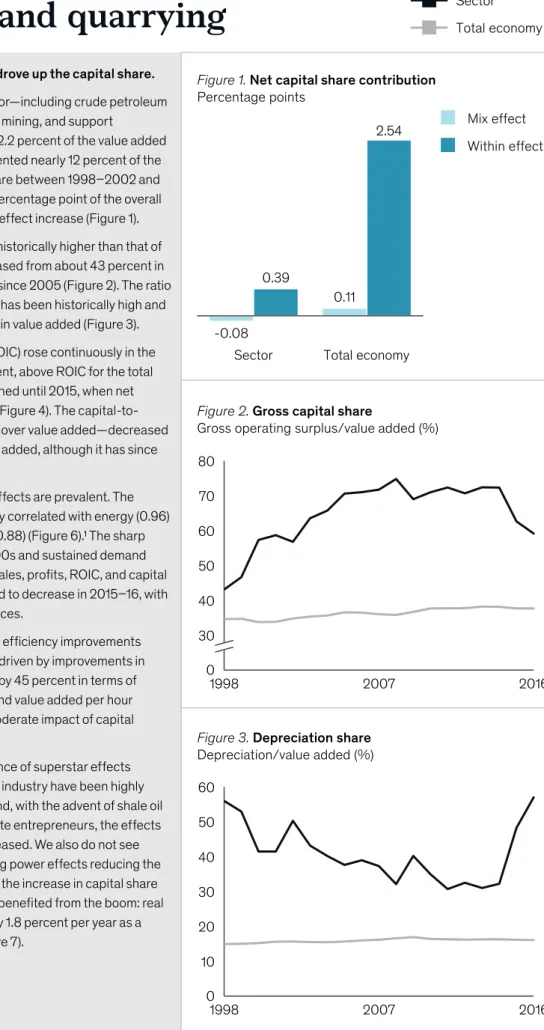
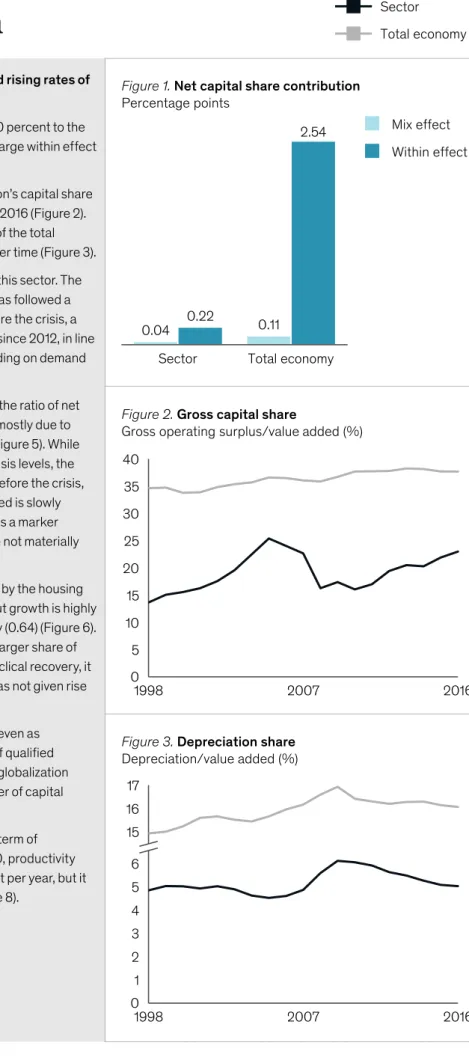
In that span, the US labor income share for the private business sector alone fell by an unusually large 5.4 percentage points according to the Bureau of Labor Statistics, or 3.5 percentage points for the overall economy according to the Organization for Economic Co-operation and Development (OECD).25. While there is a high heterogeneity in the sectors' relative size and contribution to the change in labor share, we find that the main driver behind the increase in the capital share was an increase in the capital share within each sector rather than the effect of a mix shift of the economy towards sectors with higher capital shares (Exhibit 6).
We compare the period between 1998 and 2002, the start of our data sample, with the period between 2012 and 2016, a stable period that marks the transition from crisis recovery to expansion.
Twelve sectors account for most of the increase in capital share
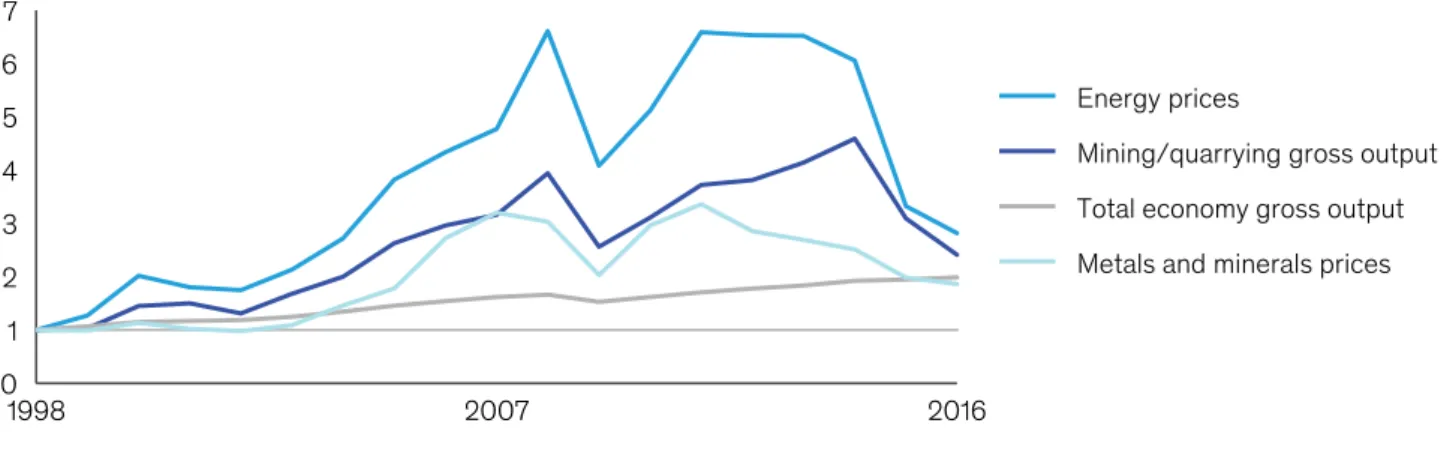
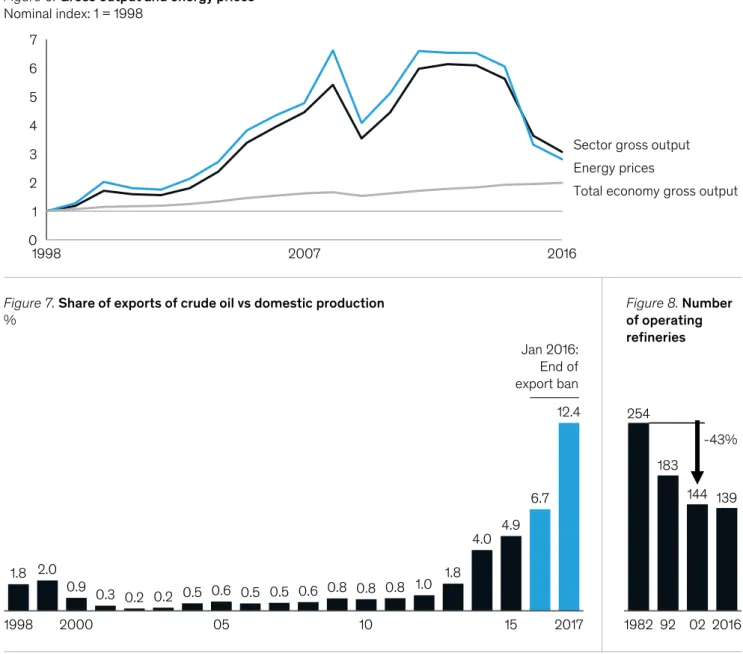
Supercycles and boom-bust effects: Even after adjusting for depreciation, we estimate that the effects of supercycles and boom-busts - especially in extractive industries and real estate -. In two sectors, mining and quarrying and coke and refined petroleum, the increase in the capital share was driven by higher returns on invested capital and higher profit margins during a sharp and prolonged rise in the prices of metals, fuels and other commodities fueling China's economy.
Net capital share increase within sector was the main driver of the fast drop in labor share
Five leading forces drove the recent capital share increase
Superstar bonds and consolidation: We estimate that superstar bonds contribute about one-fifth of the capital stock increase. We estimate that this effect is responsible for 12 percent of the increase in capital share in the industries we analyzed.33 For this estimate, we mark this driver as "relevant" or "highly relevant". Our paper similarly suggests that capital substitution is not a primary driver of the aggregate decline in labor share.
36 Basic manufacturing activity (such as food, textiles and metal products) and equipment production (machinery, electrical equipment) together account for around 11 percent of the increase in capital.
Long-run patterns in capital share
A closer look at sectors
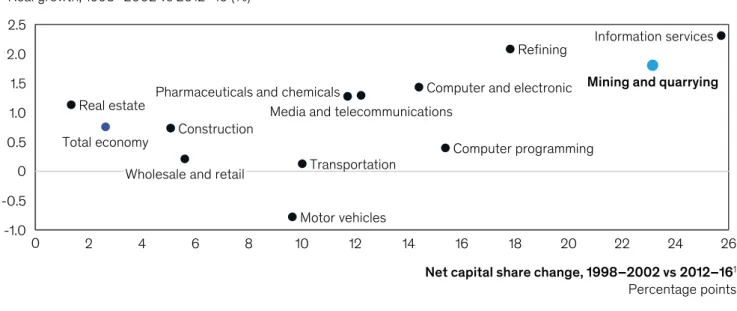
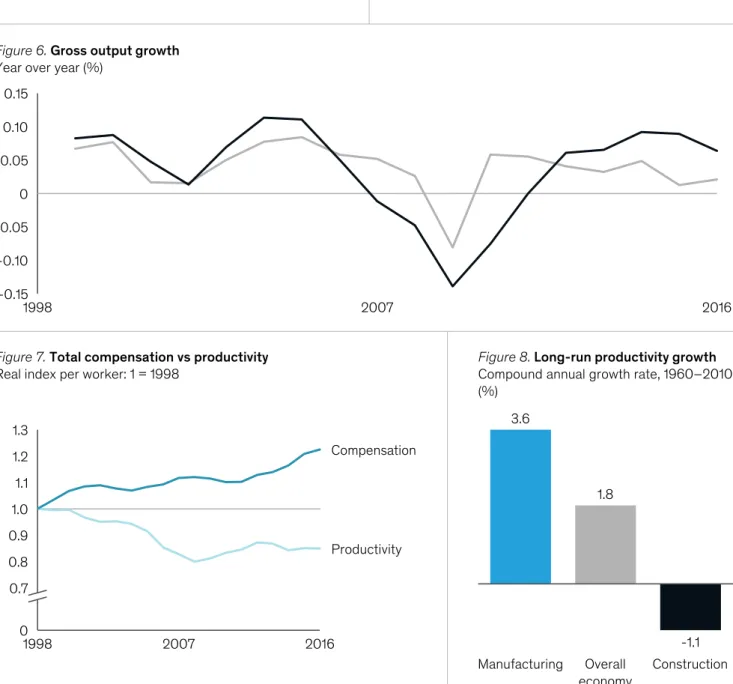
Sectors with particularly strong capital stock increases, such as mining, refining, computer and electronics, and information services, also saw above-average wage growth (see also Figure 7 on page 29). In turn, the three main sectors that contributed most to the stabilization of the labor share showed slower productivity growth than the total economy on average between 1998 and 2016. Thus, the sectors that contributed to easing the pressure on the labor share did so not because wages grew rapidly, but mainly because productivity growth was low.
The twelve sectors in focus tend to be smaller in terms of employment and more globalized, with faster productivity growth.
The twelve sectors in focus tend to be smaller in terms of employment and more globalized, with faster productivity growth
A micro sector lens offers insights into capital-share dynamics
Mining and quarrying
Construction
Real estate
Coke and refined petroleum
Motor vehicles
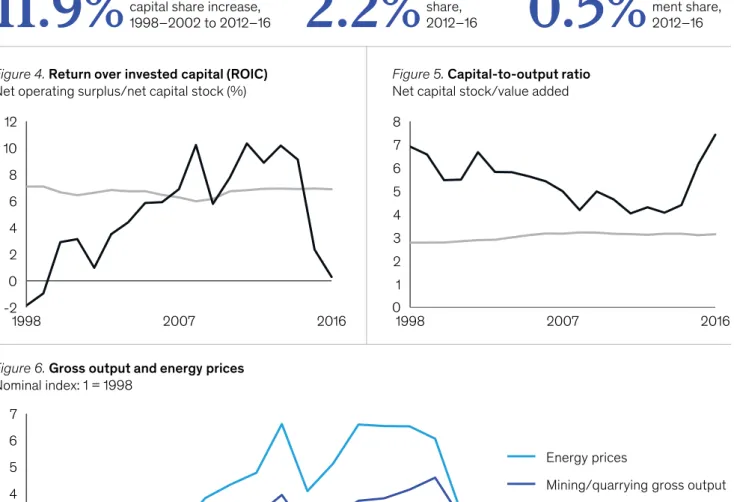
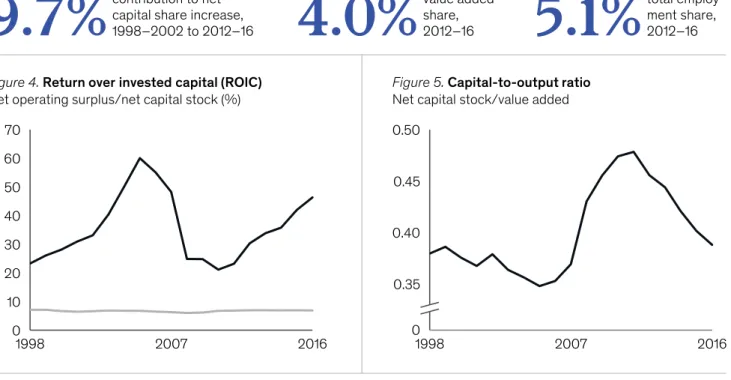
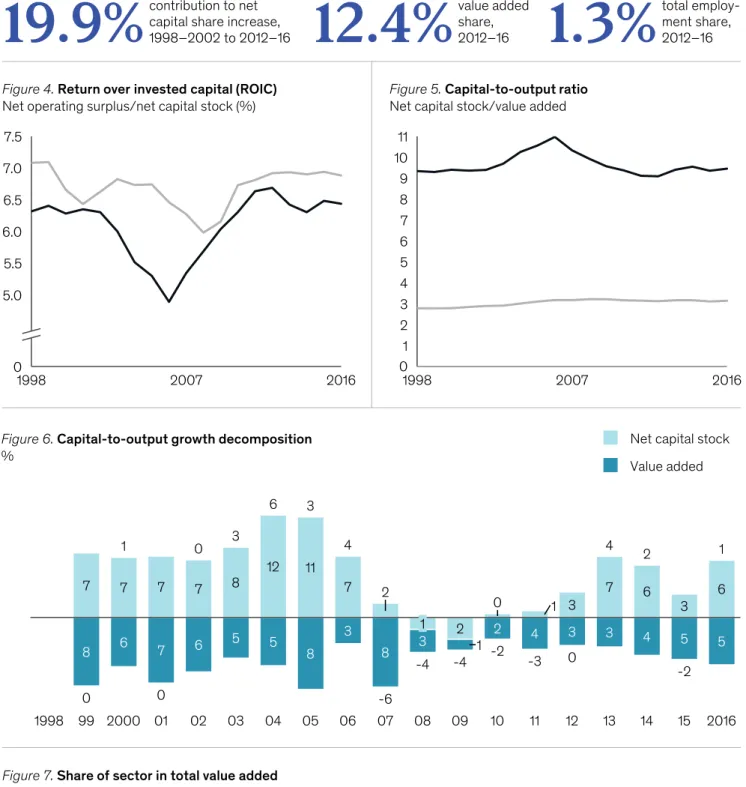
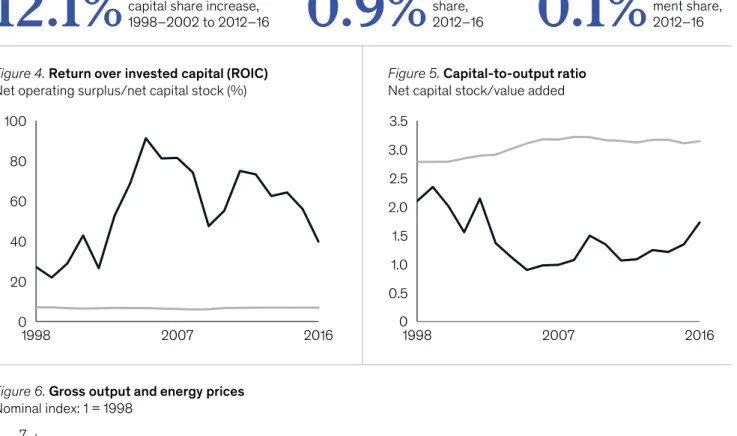
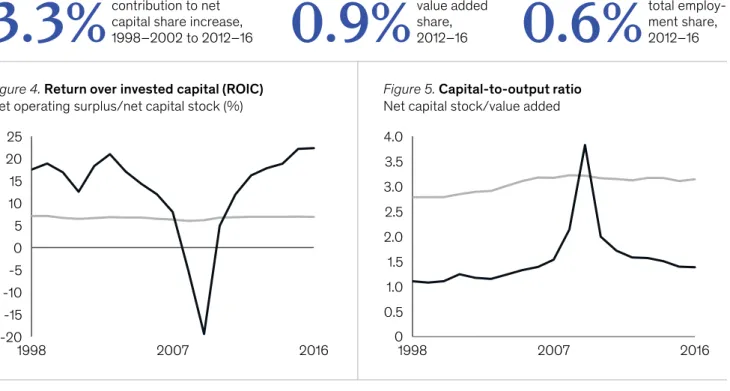
Net operating profit/net capital stock (%) Figure 5. Capital/output ratio Net Capital stock/value added.
Pharmaceuticals and chemicals
Computers and electronics
Media and telecommunications
Computer services
Information services
Wholesale and retail
Transportation and storage
Conclusion and outlook: Setting
This would include reskilling workers as companies automate more work activities, as well as dealing with the effects of superstars.43. Much of the decline is technical rather than distributional (depreciation) and related to a structural shift in investment towards intangibles. 42 Solving the productivity puzzle: The role of demand and the promise of digitization, McKinsey Global Institute, February 2018.
While our findings in this paper suggest that consolidation and superstar effects are only moderate drivers of labor share declines, which in turn explain only a small part of the weakness in median wage growth, these effects are arguably more important in explaining wage inequality as a powerful driver of median wage stagnation.
Looking ahead, further labor share declines appear likely but at a slower pace
Another large part relates to supercycling and surge effects, which are difficult to address in isolation. Actionable policies may need to focus on measuring superstar effects and ensuring a competitive environment across sectors. 43 For automation's effect on the workforce see Skill shift: Automation and the future of the workforce, McKinsey Global Institute, May 2018, and Jobs lost, jobs gained: Workforce transitions in a time of automation, McKinsey Global Institute, December 2017.
ALTERNATES
Appendix A
Literature overview
Literature review
The use of machines instead of work reduces labor's share of national income, reduces work. The growth of the global value chain leads to a decrease in the share of labor by about 0.6 percentage points in OECD countries. Focusing on the non-financial corporate sector; the share of capital divided into the share of the cost of capital (the capital stock above the required rate of return on capital) and a share of net profit (which remains part of VSHB); general equilibrium model; cross-industry regressions (750 NAICS) on the relationship between labor share and concentration.
The decline in the share of the labor force is associated with higher concentration at the 3-digit industry level, which is taken as evidence of a decline in competition.
Appendix B
This means that our work includes 68 industries in the analysis of the mix and within impact across sectors, and 43 industries in the DuPont breakdown. Of the 68 sectors used in the mix analysis, only four have a share of taxes minus subsidies over value added above 10 percent, with no clear trend over time. The relative contribution of the sectors to the increase in the net capital share with and without taking taxes into account is the same for the 12 sectors that are in focus.
The internal effect can be interpreted as the impact of a change in the share of capital within an individual sector on the change in the share of capital of the whole economy, while the mixture effect covers the fact that growing or shrinking sectors - in value added - affect the share of capital due to the fact that their own share of capital differs from that of the whole economy.
Sources and methodology
Because of pejoratives, sectors with a very high net capital share level to the overall economy, such as mining and real estate, have a lower mix effect, while sectors with a low net capital share, such as computer manufacturing, have a higher mix effect. It includes total workers' compensation, gross operating profit and self-employment income, as well as taxes minus production subsidies.44 Taking taxes and subsidies into account is not central to our results, and one can assume that the capital share is the mirror image of the labor share.45 We calculate the total contribution of each sector to the increase in the capital share by weighting the change by its share of its share of nominal value added (Exhibit B1). First, we adjust for each sector the capital shares for the average value of the total economy over the entire sample. This allows us to avoid inflating the mix effect: we want to strike a balance between capturing the evolution of the relative sectoral value added size in the economy and the structural, long-term differences in the capital shares compared to the economy as a whole. take the average of the capital share in the first and second periods.48.
Our methodology decomposes the change in capital share into mix and within components, adjusting for total economic value and averaging between the initial and final periods.
We used an analytical formulation to decompose the change in capital share
Bergholt, Drago, Francesco Furlanetto and Niccolo Maffai Faccioli, The decline of the labor share: New empirical evidence, working paper preliminary draft, December 2018. Grossmann, Gene M., Elhanan Helpman, Ezra Oberfield and Thomas Sampson, The productivity slowdown and the declining 2018-2018. 2017. Gutiérrez, Germán and Thomas Philippon, Declining Competition and Investment in the U.S., NBER Working Paper Number 23583, July 2017.
Karabarbounis, Loukas and Brent Neiman, "The Global Decline of the Labor Share," Quarterly Journal of Economics, February 2014, Volume 129, Issue 1.
Bibliography
Abowd, John M., and David Card, "Intertemporal Labor Supply and Long-Term Labor Contracts," The American Economic Review, March 1987, Volume 77, Number 1. Milberg, William, and Ellen Houston, "The High Road and the Low Road to International Competitiveness: Extending the Neo-Schumpeterian Business Model Beyond Technology," International Review of Applied Economics, Volume 19, Number 2, April 2005. Piketty, Thomas, Emmanuel Saez, and Gabriel Zu c man, "Distributional national accounts: Methods and estimates for the United States", The Quarterly Journal of Economics, Volume 133, Issue 2, May 2018.
The project was led by James Manyika, chairman and director of the McKinsey Global Institute, based in San Francisco;.
Acknowledgments