Using Brazilian censuses from 1980 to 2010 to estimate a social mobility variable, this study finds that increasing economic liberalization in the period 1991–2000 reduced social mobility, but the negative effect doubled 20 years later. Robustness tests showed that the negative correlation between social mobility and economic openness was not affected, nor was the statistical significance of the estimates.
Introduction
On the other hand, 20 years after liberalization, estimates show that the negative effects of increased economic liberalization on social mobility have doubled. Next, a literature review focused on works that analyzed social mobility and the consequences of economic liberalization in Brazil.
Background: Brazil pre and post liberalization
These drastic reductions in tariffs were reflected in higher import penetration in most sectors (Pavcnik et al., 2004). Those that were already relatively stronger in the pre-liberalization period showed a greater capacity to adapt and even increased the distance between themselves and other previously less competitive firms (Ferraz et al., 2004).
Theorical aspects on social mobility, international trade, and regional economy
Social Mobility
To overcome this drawback, the concept of relative social mobility appears, which describes the chances of people from different backgrounds to achieve certain goals. Moreover, as Ramírez Zuluaga (2015) explains, following Angulo et al. 2012), there is a debate on social mobility that pits economists against sociologists, with the former favoring means-tested measures and the latter opting for measures based on of social status.
International Trade
In the mutual dumping model, there are two monopolies, one in each country, they produce a homogeneous product and the costs are the same. The monopolistic firm in each country would limit its domestic sales, which would reduce its profits.
Regional Economics
This theory studies the determination of the geographical location of the production activities of goods and services of companies. Later, with the work of Goodwin (1949) and Metzler (1950), the theory of the economic base was developed.
Empirical framework: Social mobility and economic openness in Brazil
For example, mobility is higher in the Southeast (a rich region of Brazil) than in the Northeast (a poor region of Brazil). Finally, they also found evidence of non-linearity in the pattern of mobility in Brazil and that the intergenerational transfer of education is related to wage mobility in several ways. Salata and Cheung (2022) examine the role of education in the process of intergenerational transfer of status in Brazil.
Their results show that trade liberalization has a short-term negative effect on employment in developing countries, although this is relatively small in the case of Brazil. In contrast, Gaddis and Pieters (2017) investigate gender differences in the impact of trade liberalization in Brazil on labor market outcomes. Similarly, the work of Dix-Carneiro and Kovak (2017) examines the evolution of the impact of trade liberalization on local labor markets in Brazil.
25 Finally, Dix-carneiro et al. 2018) use trade liberalization in Brazil in the 1990s to examine the impact on crime.
Methodology
Data
Empirical approach
Results
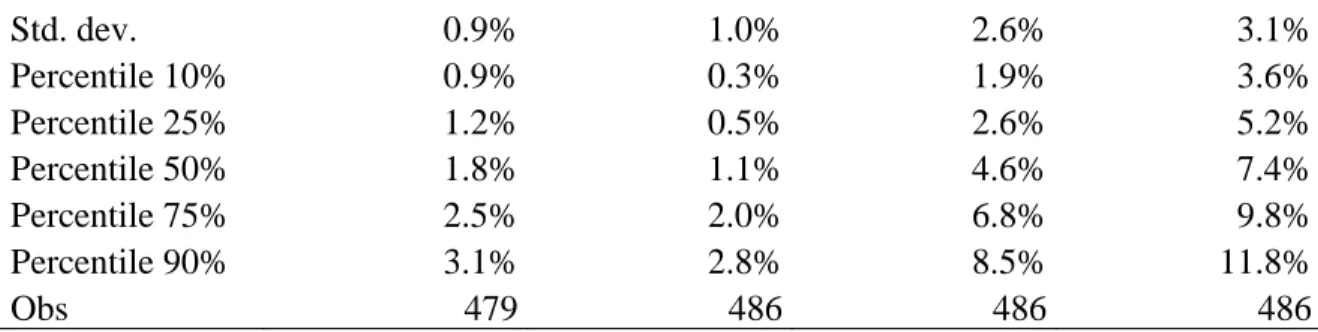
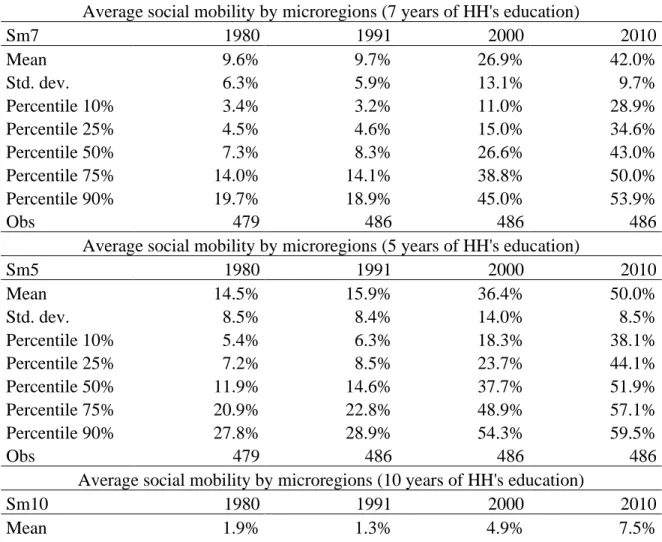
Basic statistics on social mobility and RELT
On the other hand, the overall period average for social mobility for 5 years of education (29.2%) is 7.2 percentage points higher than the period average for social mobility for 7 years of education (22.1%). However, if we look at the evolution of the social mobility of young people between 14 and 18 years old, who exceeded 10 years of education of their parents, the growth was not so pronounced, as the average social mobility remained around 8%. in 2010. In this sense, Table 1 In this sense, Table 1 shows an interesting pattern in which the higher the education of the head of the household, the lower the social mobility.
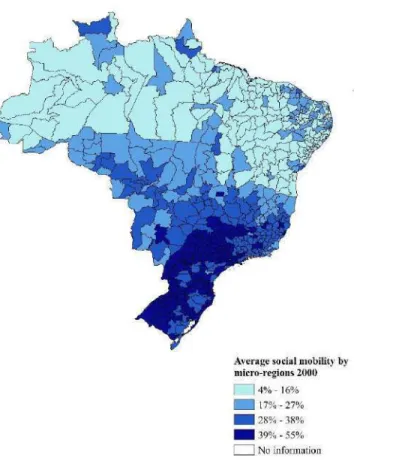
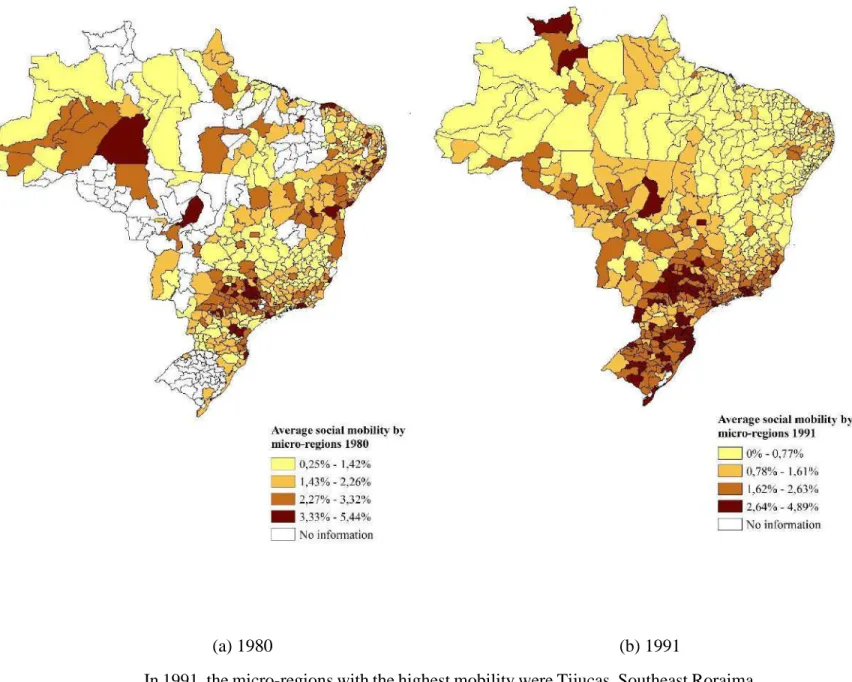
To observe the geographic distribution of social mobility in Brazil, using 7 years of education, Figure 1 and Figure 2 are shown. On the other hand, the microregions with the lowest social mobility were Traipu, Japurá and Portel, belonging to the states of Alagoas, Amazonas and Pará. In contrast, the micro-regions of Portel, Furos de Breves and Japurá located in the states of Pará and Amazonas had the lowest indicator of social mobility.
However, the regions in the northeast of Brazil have also gradually increased their level of social mobility.
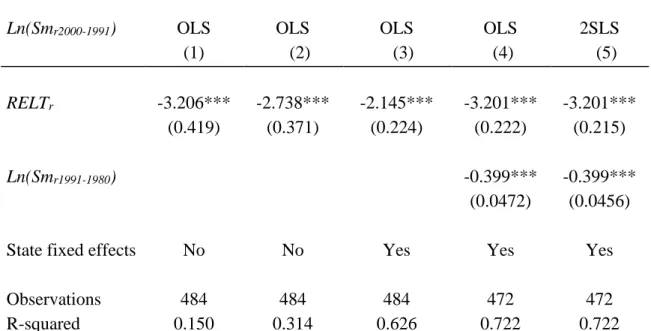
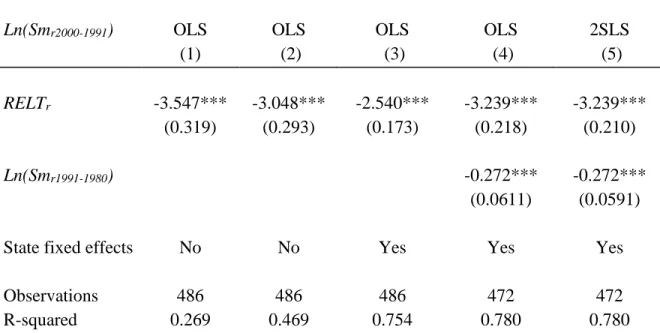
Short-term analysis
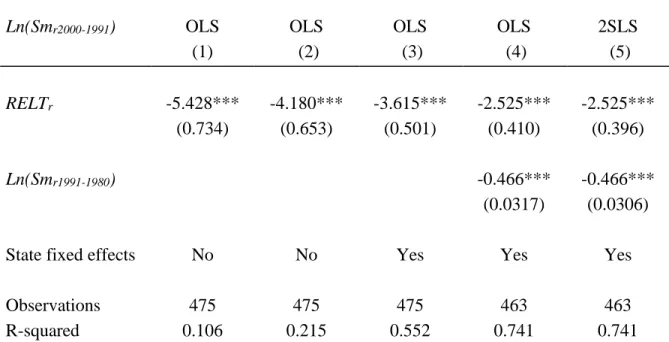
On the other hand, in column 4, the tariff reduction causes a decrease in social mobility by 32.01 percentage points, which is the same value found in column 5, where the previous trend was applied. The results are broadly similar to those in Table 3, as the sign shows that tariff reductions harm social mobility. 38 Table 5 shows the estimates of social mobility for heads of households with 10 years of education surpassed by their children and changes in regional economic liberalization rates (RELTr).
On the other hand, the results in columns 4 and 5 continue to show that with an increase in economic liberalization, 25.2 p.p. the reduction of social mobility in Brazilian regions. Empirically, there is an inverse relationship between tariff reductions and social mobility in Brazilian microregions. This means that regions that were more prone to liberalization also experienced a decline in social mobility.
In the face of declining incomes and unemployment, families were affected, as was the social mobility of.
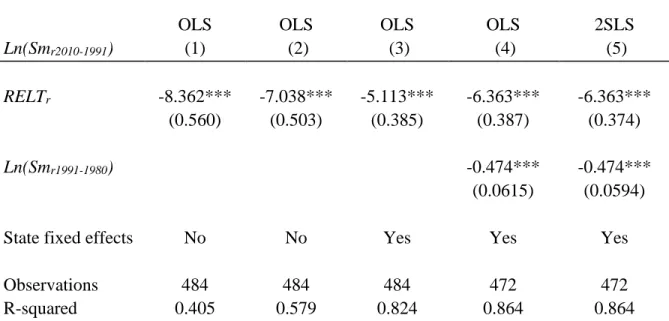
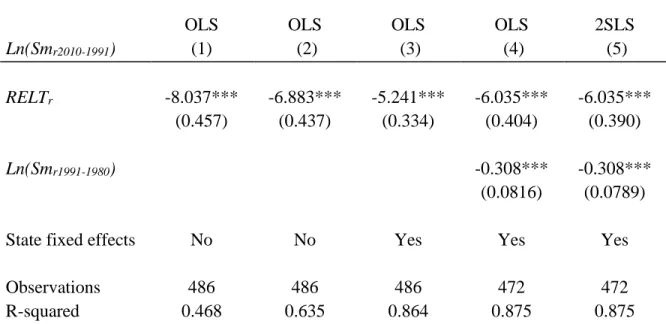
Long-term analysis
These estimates follow the trend of an almost doubling of the magnitude of the negative impact of economic liberalization on youth social mobility. The above results show that the causality observed in the short term is maintained in the long run. 43 On the other hand, in terms of short-term results, it was observed that for all types of mobility examined, there was a greater deterioration of young people's social mobility in the long term.
This slow adjustment of the dynamics of capital and labor demand explains the decline in workers' wages over time in the regions that have experienced the largest tariff cuts. As a result, capital investment also moves out of these regions, leading to a decline in business and job creation. 44 This growing impact on formal employment and workers' income can be seen as an important factor in the decline in social mobility.
From an income perspective, social mobility in regions experiencing greater economic openness also experienced a greater decline in social mobility.
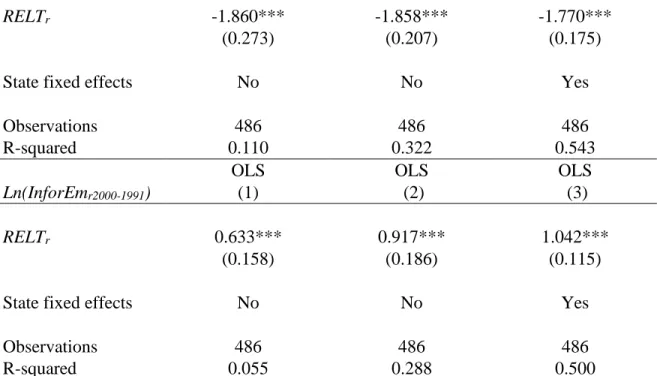
Mechanisms explaining social mobility
As a result, many workers had to move to the informal sector, the rate of which increased as a result of liberalization and offset the decline in the overall employment rate. With economic liberalization, the number and size of formal enterprises began to decrease in the most affected regions. Thus, the demand for formal labor force and the establishment of companies are decreasing, which is also reflected in a.
Therefore, entrepreneurs expect the depreciation of their installed capital and the fall in formal employment to continue over time. Considering the estimate in column 3, we find that a 10 percentage point reduction in rates (increase in liberalization) leads to a 15.5 percentage point fall in average worker income. This result is consistent with the contraction of formal employment, the increase in informal employment, and the cost-cutting processes of firms that took place in the early years of economic liberalization.
In other words, both employment and wages have been affected by liberalization in the short run.
Robustness tests
Both Table 13 and Table 14 show the results of the estimated social mobility calculated for 7 years of education of the head of household in 10 and 20 years after liberalization. Log changes in social mobility (7 years), regional economic liberalization rates and other controls for 1991–2000 and 1991–2010. In general, the estimates of the RELTr variable show that the causal relationships hold, that is, as liberalization increases, social mobility decreases in both the short and long term.
The biggest difference is for the results in column 3, where the results suggest that the effects in regions with a higher proportion of female heads of households are larger on children's social mobility, however the opposite is true. 53 the relationship between liberalization and social mobility is maintained, as is the statistical significance of the results. Similarly, average female-headed households also harm children's social mobility in the short and long term.
The previous estimates are also made for the social mobility calculated for 5 and 10 years of education of the head of the household.
Conclusions
On the contrary, it was found that 20 years after the opening, for the lowest levels of education, there was about twice as much decline in social mobility compared to the 1991-2000 period. The long-term effects of liberalization for mobility, calculated with 7 and 5 years of education, were 63.63 and 60.3 p.p., respectively. In the less affected regions, capital was slowly redeployed, reducing investment and the demand for formal work, and thus workers' incomes.
The results showed that in the short term there was a decrease in both general and formal employment and an increase in informal employment, as well as a decrease in wage income. Similarly, the negative effects of liberalization on formal employment and wage income increased in the short term. Finally, it should be noted that other factors that could influence these results regarding social mobility in Brazil were not considered, as important factors such as public policy, health systems, education, urbanization levels, macroeconomic conditions and inequality are some examples of determinants which explains social mobility in a country.
Similarly, there are ways of measuring social mobility in a more approximate way that can be explored to observe how they vary with respect to these estimates.
Supplementary Appendix
Social mobility maps calculated for 5 and 10 years of education
On the other hand, Portel, Japurá and Traipu belonging to the states of Pará, Amazonas and Alogas were the ones with the lowest mobility. In 2010, the micro-regions with the best mobility results were Fernandópolis, Auriflama and Floraí belonging to the states of Sao Paulo and Parana respectively. In 1991, the microregions with the highest mobility were Tijucas, Southeast Roraima and São Bento do Sul and 4.51%, respectively, belonging to the states of Santa Catarina and Roraima.
In contrast, Sena Madureira, Rio Negro and Japurá are the microregions with the lowest mobility, belonging to the states of Acre and Amazonas. For the year 2000, the microregions with the highest mobility are those of Lapa and Floraí which belong to the states of Paraná and Pernambuco. Compared to 2010, the microregions with the highest mobility were respectively Concórdia, Auriflama and Jales and 15.5%), belonging to the states of Santa Catarina and São Paulo.
The mikrostreak with the lowest average mobility figures was Fernando de Noronha, Furos de Breves and Portel.
Robustness tests for social mobility calculated with 5 and 10 years of education