Esta tese centra-se na otimização de um motor turbofan numa fase preliminar de projeto para obter baixos níveis de emissão de NOx sob diferentes condições de operação. Palavras-chave: Emissões de NOx, modelo aerodinâmico 0-D, turbofan, análise fora das condições de projeto, otimização em fase preliminar de projeto.
List of Acronyms
List of Symbols
Introduction
Nitrogen Oxides: formation, concerns, regulations and reduc- tion in aero-engines
- Formation
- Concerns
- Regulations
- Reduction in aero-engines
However, it is also important to note that the aircraft industry is solely responsible for NOx emissions in the stratosphere, where this pollutant can also contribute to the depletion of the ozone layer. As seen earlier, if the air-fuel ratio was "stoichiometric", complete combustion must occur in the combustion chamber.
![Figure 1.1: Schematic representation of aircraft emissions and their causal linkages with potential cli- cli-mate and social welfare impacts [1]](https://thumb-eu.123doks.com/thumbv2/123dok_br/19817616.0/25.892.111.784.106.554/figure-schematic-representation-aircraft-emissions-linkages-potential-welfare.webp)
1.2.1 0-D models
- Design point and off-design analysis
- Nitrogen oxides emissions prediction models
- Optimization: the genetic algorithm
- Thesis Structure
- Objectives
- Contribution
- Outline
The next chapter explains all the details of the implemented model (both design analysis and off-design analysis), as well as all the mathematical and physical principles used. The main objective of this work is to achieve early-stage turbofan design optimization for low NOx emissions at off-design operating conditions.

Turbofan model: design point and off-design
Notation and Assumptions
The fuel/air ratio is defined in terms of the core air flow as. 2.9) The bypass ratioBwhich relates the air mass flows of the core and the fan is. 2.10). Despite the use of such assumptions, the calculated results are still thermodynamically realistic. However, the constant properties of the gas are different upstream, where the gas is air (k, R, cp), and downstream of the combustor, where we find the gas products of combustion (kg, Rg, cpg).
The efficiencies of the compressor, the fan and the turbine are described using constant polytropic efficiencies respectively.
![Figure 2.1: Station numbering of a commercial turbofan engine ([41], adapted)](https://thumb-eu.123doks.com/thumbv2/123dok_br/19817616.0/40.892.122.779.105.470/figure-station-numbering-commercial-turbofan-engine-41-adapted.webp)
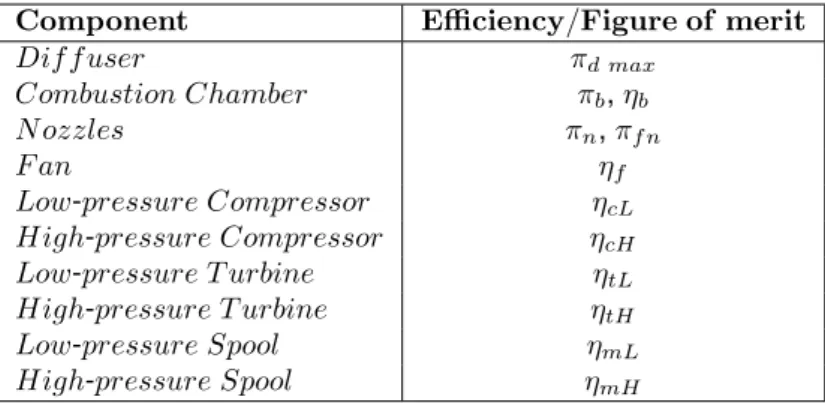
Turbofan components efficiency and performance
- Inlet and diffuser pressure recovery
- Compressor efficiency
- Fan efficiency
- Combustion chamber efficiency
- Turbine efficiency
- Nozzles efficiency
So in this case the expressions relatingτfandπf, and, for the isentropic efficiency of the fan, ηf, can be written directly:. Most of the losses that occur in the combustion chamber are due to two phenomena: incomplete combustion of the fuel and total pressure loss. The total pressure loss can be explained by the combustion occurring at a finite Mach number and also by the viscous losses in the interior of the chamber.
As in the case of the compressor, the figure of merit chosen to characterize the turbine is polytropic efficiency, et.
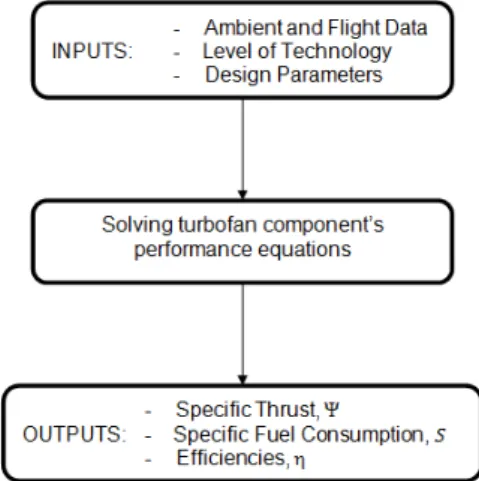
Design point model
- Design point inputs
- Design point equations
- Design point outputs
First, the flight Mach number allows us to calculate the total/static temperature and pressure ratios for the free stream at the engine inlet. In the case of the diffuser, the figure of merit is determined by the level of technology and it is also determined by the flight Mach number. Similar to the case of the compressor, in the case of the fan, the pressure ratio is also an input design choice and the polytropic efficiency ef is chosen by the technology level.
Specific fuel consumption describes the fuel efficiency of the turbofan engine relative to its total thrust.

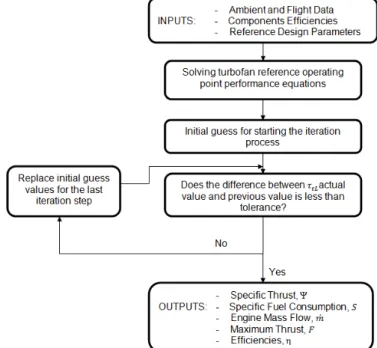
Off-design model
- Off-design inputs
- Off-design equations
- Off-design outputs
The last class of inputs to the off-design model are the reference operating point design parameters. By performing the same analysis as in subsection 2.3.2, it is also possible to determine the temperature ratios of the low and high pressure turbines. Using the definition of the mass flow parameter (equation (2.54)), one can easily say that πtH.
To define the engine mass flow in terms of reference conditions, the procedure is the same applied earlier for the other definitions.
Three-spool turbofan
Similar to the previous model, the low-pressure turbine drives the low-pressure compressor and fan through the low-pressure scroll; the high-pressure turbine drives the high-pressure compressor through the high-pressure spool; but now the super high pressure turbine drives the super high pressure compressor through the super high pressure spindle. The SH index will be used for the superhigh pressure coil, and the same assumptions and simplifications described in Section 2.4 will be used. Within the design parameters of the reference operating point, the high-pressure compressor pressure ratio, πcSHR, must be determined.
With the values calculated for the reference operating point, the procedure for the specified operating point is the same as described in subsection 2.4.2, with the addition of the equations for TcSH and pcSH in the iteration process.
![Figure 2.4: Three-spool turbofan engine schematics [4]](https://thumb-eu.123doks.com/thumbv2/123dok_br/19817616.0/64.892.296.589.409.562/figure-2-4-three-spool-turbofan-engine-schematics.webp)
Turbofan model results and validation
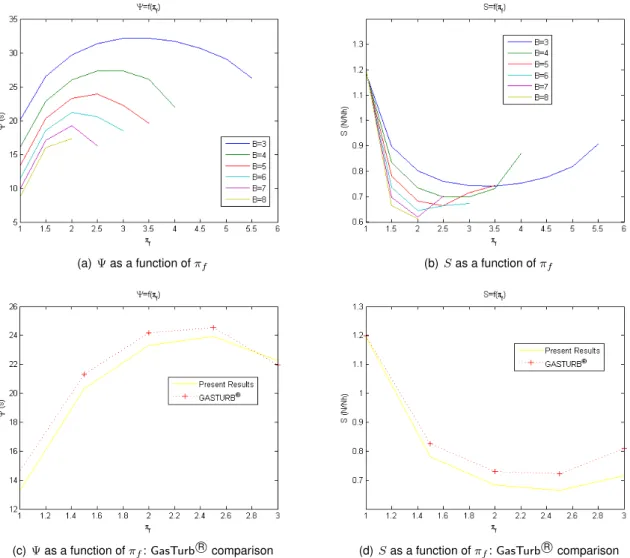
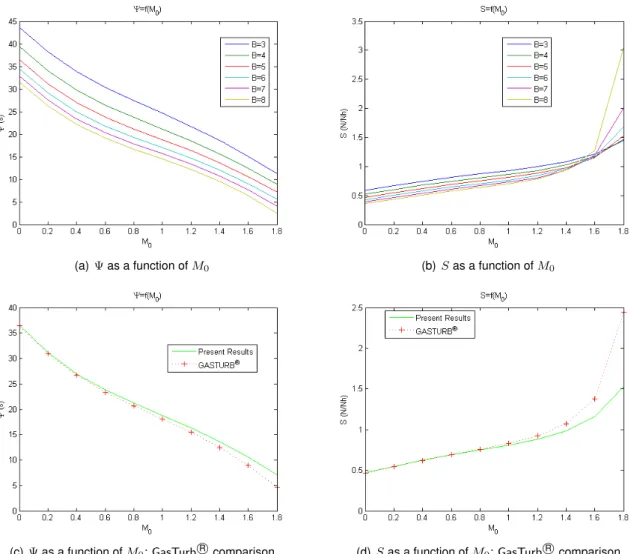
Design point performance results
For the specific case of a bypass ratio B = 5, the same results for specific thrust and specific fuel consumption, respectively, are compared to those produced by the GasTurbR package. Good agreement is obtained between the two sets of matching results, especially for low values of the compressor pressure ratio. This design point analysis was performed for a height of h= 10000 m and compressor pressure ratio πc = 30. For the specific case of fan pressure ratio πf = 1.5, the same results are compared for specific thrust and consumption specific fuel, respectively. with those produced by the GasTurbR package. Again, good agreement is obtained between the two sets of matching results for the entire estimated spectrum of skip ratios.
In terms of technology level, this analysis is related to level 4; the simulated design parameters were fan pressure ratio πf = 1.6 and turbine inlet temperature Tt4 = 1600K.
Off-design performance results
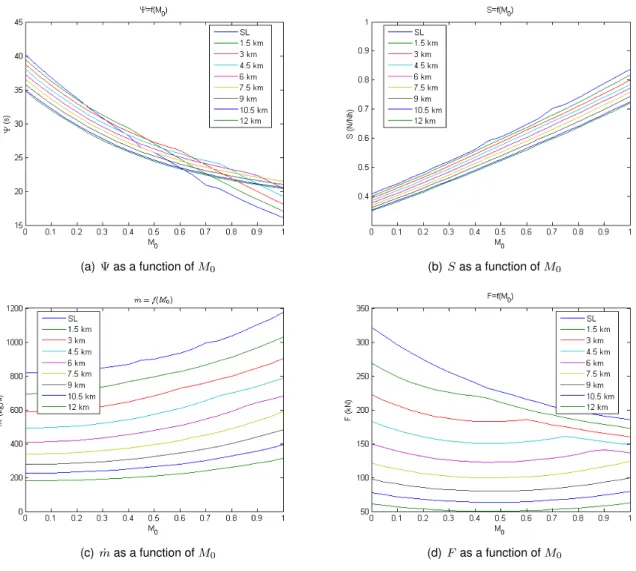
In such characteristics, the effect of flight Mach number can be observed: specific thrust decreases with increased flight speed and consequently with higher flight Mach number, while specific fuel consumption increases. By combining the specific thrust with the total engine mass flow, the thrust variations can be visualized: it is observed that increasing the flight Mach number and flight altitude resulted in a significant reduction in thrust. In this last chart, for each flight altitude, the value of the flight Mach number is determined where the tipping point can be detected (eg for h= 3 km the value of M0 = 0.6).
The bypass ratio shows a constant increase in value with increasing flight Mach number and a constant decrease with increasing altitude.
NO x emissions prediction model results
- The Committee on Aeronautical Technologies model
- Model description
- Results
- Lefebvre’s model
- Model description
- Results
- Rizk and Mongia’s model
- Model description
- Results
- Discussion
Figures 4.1a and 4.1b show the results obtained for the emission index of NOx, as a function of flight Mach number and combustion chamber inlet temperature, respectively, for various values of flight altitude. Figures 4.2a and 4.2b show the results obtained for the emission index of NOx, as a function of flight Mach number and combustion chamber inlet temperature, respectively, for various values of flight altitude. And the residence time in combustion chamber is an input for the model studied in section 4.3.
Furthermore, the results of the emission index are in the same order of magnitude for the three models.
![Figure 4.1: NO x emissions results at off-design operating conditions with the Committee on Aeronautical Technologies model [46]](https://thumb-eu.123doks.com/thumbv2/123dok_br/19817616.0/83.892.139.762.531.803/figure-emissions-results-operating-conditions-committee-aeronautical-technologies.webp)
Optimization
Single-objective function optimization
- Results
- Discussion
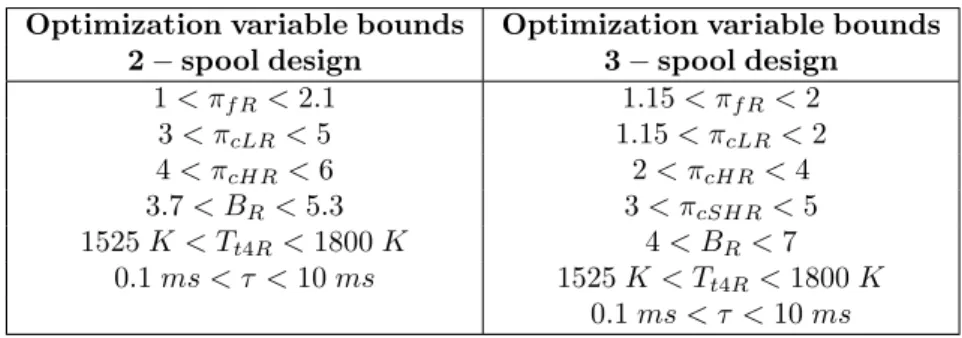
The objective function for the optimization of the NOxemissions prediction model of Rizk and Mongia is represented by the sum of equations (4.8) and depends on Tt3, pt3 and τ. To obtain these values for the NOx emission index, the design parameters will have to be set to the values given in Table 5.2. By checking the optimal values for the design parameters (Table 5.2), it is possible to see that, to achieve the optimization objective, the two-spool design exhibits higher values of bypass, fan and compressor pressure ratios than the three-spool design reel.
Given the optimization design parameters shown in Table 5.2, one would essentially get S = 1.3 N/N·h for the two-spool turbofan design and S = 1.7 N/N·h for the three-spool turbofan design.
Multi-objectives functions optimization
- Results
- Discussion
By comparing the results obtained for designs with two and three coils, it is possible to conclude that the latter provides an improvement in the reduction of the EIN Ox value. Given static sea level conditions and the inputs defined in Table 3.1 for ambient and flight data and component efficiencies, it is possible to obtain the optimization results shown in Figure 5.2. By comparing the results obtained for designs with two and three coils, it is possible to conclude that an improvement in the reduction of the specific fuel consumption as well as in the reduction of the value of EIN Oxis provided by the latter.
By observing the optimal values of the design parameters (Table 5.4), it can be seen that in order to achieve the optimization goal, the two-coil design shows higher values of bypass and fan pressure ratios, turbine inlet temperatures, and residence time in the combustion chamber than the three-coil design.
Conclusions
Achievements
In order to achieve the lowest possible values of NOx emissions, fuel consumption would increase significantly. It therefore undertook multi-objective optimization with the aim of simultaneously reducing NOx emissions and specific fuel consumption. The results obtained from such an optimization process indicate possible design parameters (πf,πc,B) to be used in the development of competitive low NOx turbofan engines.
They also show that the three-coil design enables us to obtain lower values of both NO emissions and specific fuel consumption.
Future Work
Despite the real dangers to the environment and health from such discharges, they are not regulated and official measurements are not available. Finally, this optimization process suggests possible design parameters that can be used together with other optimized engine components (e.g. state-of-the-art "greener" combustor designs) to further develop the design of low-NOx turbofan engines. The final conclusion is as follows: the coupling between the developed model and the optimization process has proven to be a powerful tool for the early stage design of low NOx turbofan engines.
Bibliography
D.;Elements of Propulsion: Gasturbines and Rockets, AIAA uddannelsesserie, American Institute of Aeronautics & Astronautics, 2. udgave, 2006. C.;Aerothermodynamics of Gasturbine and Rocket Propulsion, AIAA uddannelsesserie, American Institute of Aeronautics & Astronautics, 3. udgave, 1997. 33] Marta, A.: Parametric Study of a Genetic Algorithm Using a Aircraft Design Optimization Problem, Stanford University, Department of Aeronautics and Astronautics, 2008.
J.;Aircraft and Rocket Propulsion, AA283 Course Notes, Department of Aeronautics and Astronautics, Stanford University, Stanford, California, 2007.
Appendix A
Optimization Results
Single-objective function optimization
- The Committee on Aeronautical Technologies model
- Lefebvre’s model
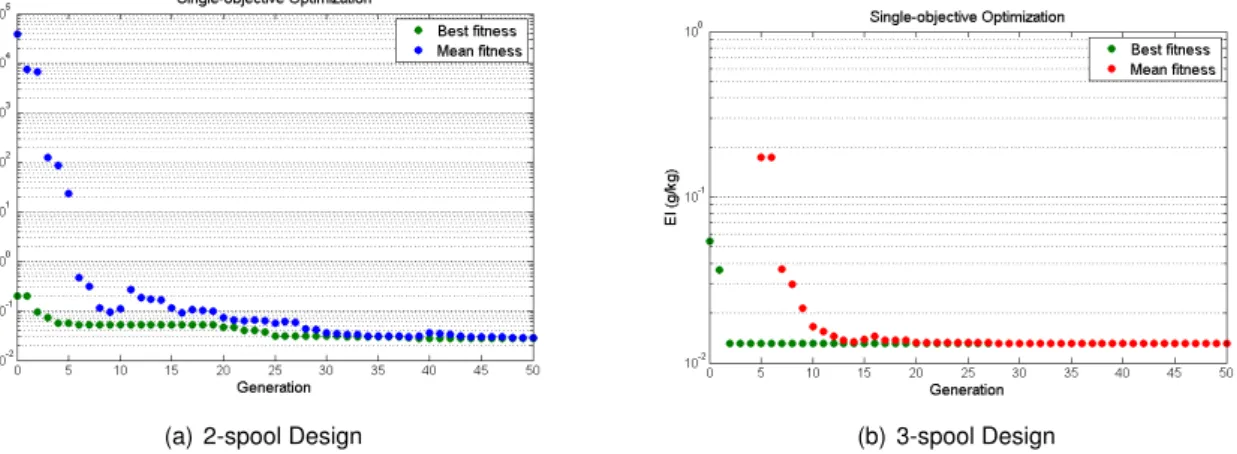
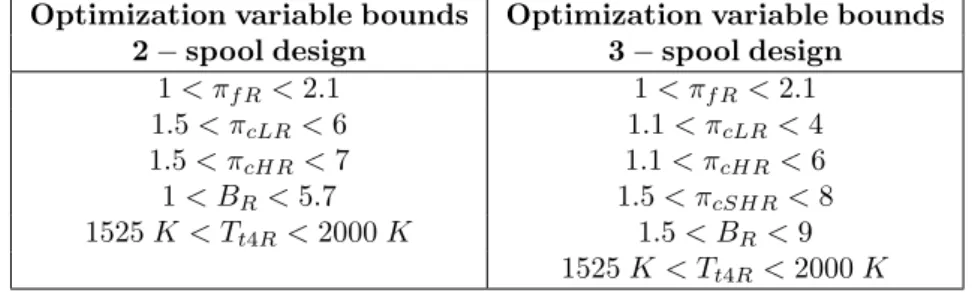
Given the optimization design parameters presented in Table A.2, one would get S = 1.7N/N h for the two-spool turbofan design and S= 1.4N/N h for the three-spool turbofan design. Thus, in this case, the objective function encompasses seven or eight optimization variables as indicated in equations (A.2), with the lower and upper bounds given in Table A.3 for two- and three-spool turbofan models, respectively. From the results over the period of fifty generations, it is possible to find the optimal solution for EIN Ox: according to genetic algorithm optimization, the optimal solution will be EIN Ox = 0.042g/kgf uel for a two-spool turbofan engine design.
For the construction of a three-cylinder turbofan engine, the optimal solution will be EIN Ox = 0.073 g/kgf uel.
Multi-objectives functions optimization
- The Committee on Aeronautical Technologies model
- Lefebvre’s model
Considering static conditions at sea level and the inputs defined in Table 3.1 for environmental and flight data, and component efficiency, it is possible to achieve the optimization results presented in Figure A.3. For the simultaneous optimization of Lefebvre's NOx emission prediction model and specific fuel consumption, the objective functions are represented by equation (4.6) and by equation (2.47) for S. Thus, in this case, the objective consists of seven or eight optimization variables as indicated. in equations (A.5) and equations (A.6), with the lower and upper bounds given in Table A.7 for two- and three-spool turbofan models.
Considering static conditions at sea level and the inputs defined in Table 3.1 for environmental and flight data, and component efficiency, it is possible to achieve the optimization results presented in Figure A.4.
![Figure 1.3: IPCC assessment of radiative forcing from aircraft [9]](https://thumb-eu.123doks.com/thumbv2/123dok_br/19817616.0/27.892.114.781.531.826/figure-1-3-ipcc-assessment-radiative-forcing-aircraft.webp)