The second was whether the faster recovery of the Greek economy by 2030 is possible by improving the country's total exergy efficiency. Then two extreme scenarios were formulated, assuming each to be the pessimistic and optimistic developments of the labor, capital stock and exergy efficiency factors.
Overview
Previous research (e.g. [3]) has shown a link between the useful work injected into the US economy and its growth. For national-scale exergy analysis, the methodology of Useful Exergy Accounting (UEAM) was developed by Ayres and Warr et al.
Motivation and contents
Initially, the concept of exergy will be introduced and the methodology for calculating the useful labor produced in an economy will be analyzed. Then, related exergy trends will be shown and the total exergy efficiency for Greece will be estimated.
Exergy analysis
- Final energy to final exergy data conversion
- Allocation of the final exergy consumption to useful work categories
- Second-law efficiencies estimation
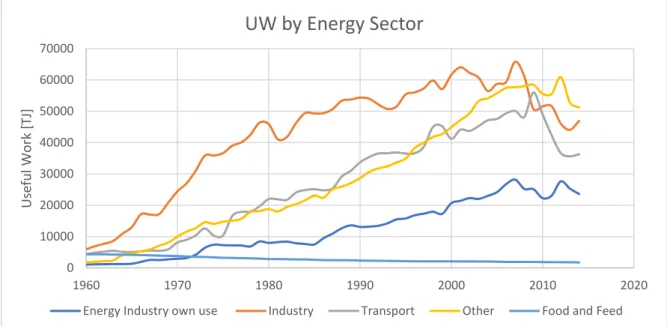
- Useful work
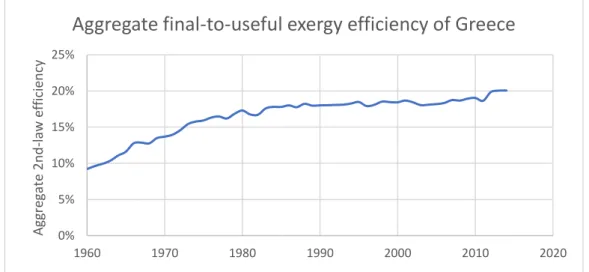
- Aggregate Final-to-useful second-law efficiency
These two factors lead to lower efficiency of the second law than in other categories. The results of the total final exergy to useful efficiency for the entire series are shown in Figure 8 .

Economic Analysis
- Trajectory of Greek economy up to date
- Financial Figures
- Correlation of Exergy with Economy
- Link between TFP and exergy efficiency
However, these positive indices reveal only part of the story of the rapid growth observed in the Greek economy. Tourism was recognized as a driving force of the economy and the sector was disproportionately financed. In 2007, the country's economy peaked and reached a gross domestic product of €251 billion (Figure 9).
Furthermore, the TFPs are indexed by dividing the value of each year by the value of the first year. The final exergy intensity in the country fluctuates around 4-5 MJ/€ in the studied time series, showing a concave part from 1960 to 1985 and a convex part from that year to 2010. Further increase in final exergy in transport and other sectors, but not in industry and GDP led to an increase in the index up to around 4.8 MJ/€ in 1990.
Finally, and similar to the final intensity of exergy, the ratio increased again, as the drop in GDP in the last year of the time series was more intense than the drop in total useful work in society. In the process that follows MEET 2030, an attempt is made to estimate the new indexed TFP based on the total efficiency of the country under the second law.

Labor scenarios
Population scenario
Ultimately, it is expected that all the above factors will lead to a relatively constant downward trend of the total population, as shown in Figure 21. Nevertheless, despite this relatively optimistic scenario, a very decisive factor is the population distribution in different age groups, which was created until the beginning of the prognosis. The low fertility rates of the past and the increasing life expectancy of the population have led to the overall aging of the nation during recent decades.
Specifically, the base of Greece's population pyramid is shrinking over time, exacerbating the problem of "aging base of the pyramid" caused by low birth rates. At the same time as individuals of the middle age groups move into older age, the problem of 'aging the top of the pyramid' is also intensifying. A decrease in the number of the young population is therefore inevitable, but the opposite is true for the elderly.
Unemployment and labor scenarios
So of the approximately 3.6 million working people in 2015, about four will be reached by the middle of the next decade. This would lead to almost 4.2 million working people in 2025, but will then decline depending on the population. Note that the study figures presented above were given in five-year intervals, from 2015 to 2030, so the intervening years were generated using linear interpolation.
For both cases, there appears to be an upward trend after 2014 until the middle of the next decade due to the fall in unemployment. Later, due to the further decrease in the number of inhabitants and the relatively stable unemployment rate, it curves downwards. Nevertheless, population decline and the simultaneous aging of the population necessarily lead to a decrease in the number of people who will work.
This would lead to total annual work hour levels in the mid-1990s for the pessimistic scenario, and the early 2000s for the optimistic scenario.
Capital scenarios
Business as usual scenario in Capital
Essentially, in the right part of the equation, the +𝑖𝑡−1𝐺𝐷𝑃𝑡−2 is the investment of GDP in capital and −𝛿𝑡−1𝐾𝑡−1 is the capital that will no longer be available due to depreciation [4]. It is clear that this scenario will lead to a rather stagnant development of the country's capital stock, which thus does not seem to reach the peak of 2010 anytime soon.
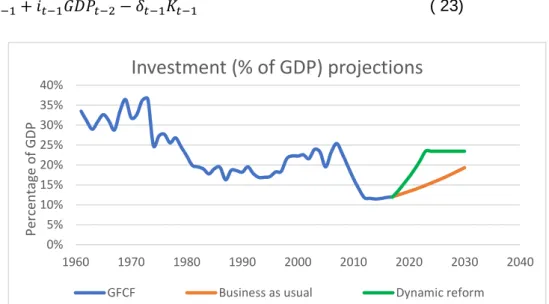
Dynamic Reform scenario in Capital
Exergy efficiency scenarios
- Climate Goals for 2030
- Analysis of important sub-sectors
- Policies
- Scenarios
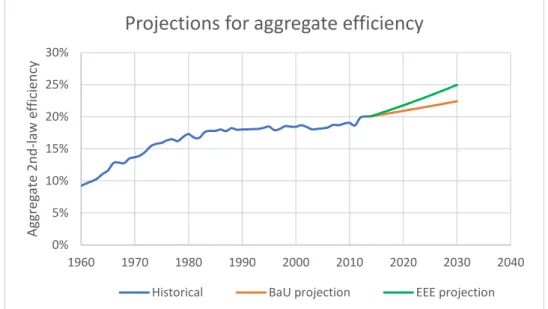
- Projections of aggregate efficiency
Curiously, diesel for vehicles, which until 2010 had the highest share above 40%, at the end of the series has almost disappeared to less than 1%. Overall, they support the energy transition and growth in the country through the current harsh environment. The development of the exergy efficiencies is based on the manipulation of estimates given in the EU reference scenario on the way to 2050 [50].
Solar thermal system development is more focused and reaches slightly higher shares to <4% of the UW produced, especially in the service sector. Finally, due to the mild economic improvement, the industrial and transport sectors are expected to increase by 1% of the total UW produced in the economy, while the Other sectors are expected to decrease by 2% until 2030. In domestic navigation there is the introduction of CHP technologies, which account for 5% of the total UW produced, while biodiesel increases to 2%.
The corresponding aggregate efficiency of each of the four main sectors can be seen in annex Figure 26. Note that, for the first year of projections, namely 2015, the same value as in 2014 is used, to avoid a potential.
Economic growth
Looking closer, annual growth rates over the past twelve years in the pessimistic scenario range roughly between 1% and 1.4%, with an average of 1.2%. This growth average can be compared with that of the period when Greece began to recover from the stagnation it had previously experienced. In the optimistic scenario, annual growth rates range between 2.5% and 3.2%, with an average of 2.9%, comparable to the period between 1993 and 2002, when the country started to significantly expand its economy for the first time after regime change to grow. .
On this path, Greece could achieve the comeback it needs, show that it has the potential to excel in different sectors and try to be part of the vanguard in Europe. Nevertheless, if this growth is very high, it could lead to the emergence of 'bubbles', shocks in the economy, problems with the real estate sector, etc. The current scenarios do not lead to excessive growth rates, so a steady and safe development of the economy could be possible. expected.
Furthermore, in the context of this current thesis, these two extreme GDP projections are the limits of a range within which economic growth can potentially maneuver in the future. In this way, the advancement of economic growth can be closer to the upper limit of these GDP projections and therefore the benefits for society can be greater.
Exergy
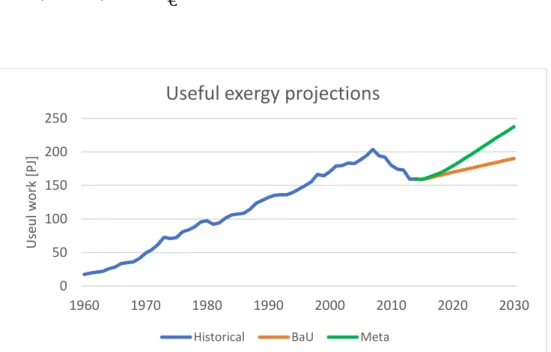
As expected, the total useful work generated in the Meta scenario, associated with greater energy efficiency and leading to faster economic growth, reaches much higher levels than in the past. As for the shares of UW that will be occupied by different energy carriers in the future, they can be seen from Figure 29 for BaU and Figure 30 for Meta. In BaU, there is mainly a small decline in oil derivatives and a small increase in other non-conventional carriers (due to solar heat and CHP technologies).
Then, it would be of interest to estimate the total exergy injected for final consumption in the country. However, due to the assumptions made and the continuous improvement of aggregate exergy efficiency, the growth rate in FEx is smaller than in UW and GDP. However, this change in the relationship between FEx and growth can also be interpreted as a reduction in the amount of final exergy required to produce a unit of GDP, i.e.
Another important point is the future development of shares of Fex energy carriers. In Meta (Figure 37), the restriction of oil derivatives is stronger, around 8.5%, and instead, the use of natural gas and mainly other non-conventional carriers is increasing.
Further discussion
This can be done by estimating the value of the intermediate steps of a longer process. The second was to investigate whether the faster recovery of the Greek economy is possible, when measures are taken to improve its total exergy efficiency. To do this, the exergy data and economic figures of the country were analyzed and past trends were revealed.
The country's exergy analysis of the four main economic sectors was realized using the Useful Exergy Accounting Methodology. Estimates of GDP based on these three factors were generated using the economic model of the MEET2030 project. It was identified that a relatively stable relationship exists between useful work and economic growth in Greece considering the last three decades of the period under study.
The two economic growth projection results differed significantly, essentially creating a range of possible outcomes towards the end of the forecast period. Projections were also made for the useful work and final exergy of the country, based on the previously found useful work intensity and total exergy efficiency. Still, final exergy grew more slowly than useful work and GDP, due to the improvement in exergy efficiency.
Time series inflation rates and GDP of Greece in euros with reference years 2000 and 2010 are shown in Figure 16 in the appendix.


![Table 3: Temperatures and first-law efficiencies for each heating category [20], [17], [5]](https://thumb-eu.123doks.com/thumbv2/123dok_br/19676159.0/32.892.110.791.922.1137/table-temperatures-law-efficiencies-heating-category-20-17.webp)