A summary of the deviations referring to the chapter "Deviations in the MEASNET Guideline 'Assessment of Area Specific Wind Conditions'" and a brief comment on the significance of each deviation is included in the summary of the site assessment report. Any deviations from the guidance will be taken considered for estimating the uncertainty of the location estimate.
Site Inspection
The evaluation of site-specific wind conditions is based on specific input data and information that must be available.
Topographic Data
Relevant Meteorological Parameters
From this list, the parameters marked with an asterisk (*) constitute a significant input to the site assessment procedure, so these must be measured directly on site, traceable according to ISO/IEC 17025 and according to the requirements as described in the following. The additional parameters are also recommended to be measured site-specifically, but they can also be derived from available non-site-specific data or from estimations.
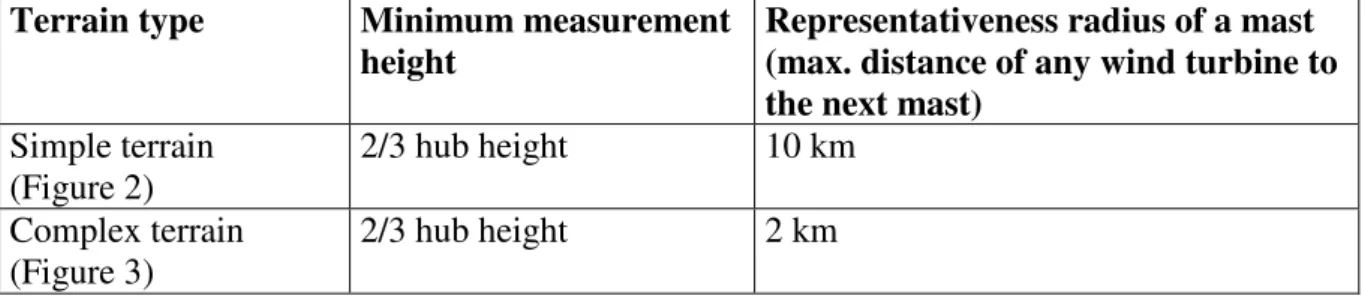
Representativeness of Wind Measurements
The basis of the site assessment as described in this guideline is site-specific measurements of wind and possibly further parameters. The general requirements for documentation and the technical requirements for the measurements are described in the following sections with reference to different standards or recommendations.
Measurement Documentation
The implementation of the measurement can be part of the site assessment procedure, but can also be carried out independently, which imposes specific requirements on the documentation of the measurement.
Wind Speed
If the calibration differences appear to be too high, the analysis of the calibration differences and data rejection due to calibration differences should be reported. If a recalibration is not carried out, as an alternative, it must be tested and documented that the cup anemometer maintains its calibration over the duration of the measurement period.
Wind Direction
Remote sensing can be used in addition to anemometer measurements to extrapolate wind measurements to other heights, taking into account the uncertainty associated with these techniques. If a measurement is considered incomplete, this should be clearly stated as a deviation from the guideline in the presentation of the results and taken into account in the assessment of uncertainty.
Flow Inclination
Temperature
Pressure
Humidity
Within the site assessment procedure, the measured data must be assessed, evaluated and extrapolated to significant long-term periods and to the positions of the wind turbines.
Assessment of Data Integrity
This can also be achieved by encrypting the logger data, checksum verification or password protection so that the data cannot be manipulated, combined with on-site verification by the Measnet authority. Large deviations were found in the implementation and/or documentation of the measurement campaign.

Data Evaluation
Data Quality Assessment and Filtering
The requirements of this procedure were used exclusively in relation to data analysis methods and procedures. The main consequence of the data quality assessment process will be the rejection of certain sets of data (filtering), resulting in gaps in the data.
Filling of Data
The result of the data filling process will consist of the filled time series of measurement data. Evaluation of the influence of the data filling on mean values and distributions of the relevant quantities.
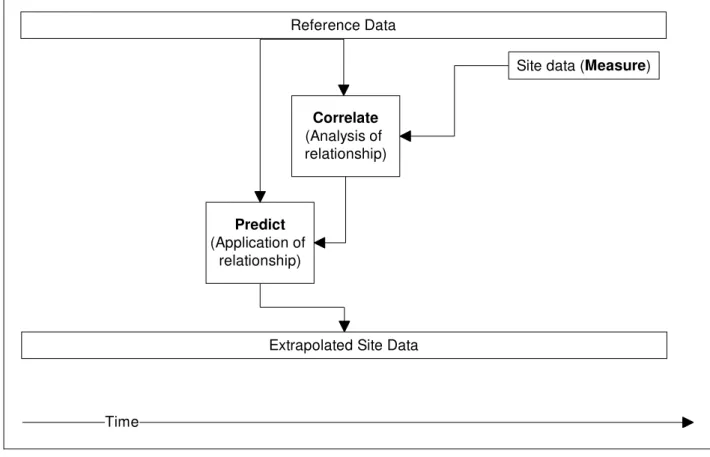
Long-term Assessment
- Overview
- Methods for Long-term Assessment and Specific Requirements
- Correlation Period
- Requirements on Reference Data
Depending on the properties of the data and the location, different methodologies can be applied and specific requirements must be considered. The correlation coefficient of the data and the degree of coverage of the respective wind speed ranges will be taken into account for the assessment of the uncertainty of the results. The calculation of the index value can be based on empirically determined relationships (correlation of wind speed or energy yield values) or on the basis of calculation models (to determine wind speed or energy yield on the basis of reference data).
In these cases, an adjustment of the distribution parameters will be performed only on the wind speed distributions. These considerations must be taken into account for estimating the uncertainty of the correlation. The quality of the reference data must be taken into account in the uncertainty assessment of the long-term wind conditions.
Wind Field Modelling
This can be done by cross-forecasting and comparing wind conditions based on different measurement points. The significance of possible deviations of the verification results for the produced results will be assessed and taken into account for the uncertainty assessment. Additionally, previous validations of the model against measurement data for the example case, which are comparable to the application case, and related to relevant modeling properties, will be available, cited in the evaluation report of country and be taken into account for the assessment of uncertainty.
The sensitivity of the model to small changes in input data or model configuration should be investigated exemplarily for comparable cases and for the specific application case. The implications of the sensitivity analysis should be considered for assessing the applicability of the relevant model and assessing uncertainty. In general, the flow modeling approach should consider all site-specific measurement data that are available and that help to reduce the uncertainty of the results.
Extreme Winds
By analyzing the time series for storm events and appropriate application of statistical methods to those events, the measured storm events can be extrapolated from the limited measurement period to a certain long term period (eg 50 years). Furthermore, the outcome of the method is a distribution of extreme values, where an exceedance level must be defined to derive a scalar value for the extreme value. Special attention should be paid to the mounting routine at high wind speeds, and the dependency of the results for different mounting routines should be shown at least as an example.
The method used for recalculation of the wind conditions from the measurement position to the wind turbine positions, in particular the influence of this procedure on the Weibull shape parameter, must be described and justified. The method used for long-term assessment of the measured wind distribution, in particular the influence of the long-term assessment procedure on the Weibull shape parameter, and/or the consideration of high wind speed events in each applied MCP procedure, shall be described and justified. Comments on uncertainty and significance of the derived extreme value estimate, taking into account the variation of the results and the sensitivity of the methodologies.
Uncertainty
In addition, the proportion of correlated data relative to measured data strongly affects the final extrapolation uncertainty. If the on-site measurement period is shorter than one year, the extrapolation uncertainty increases significantly. These considerations must be taken into account when estimating extrapolation uncertainty.
The uncertainties also reflect the limitations of the applied model with regard to the location characteristics. If a wind turbine power curve is relevant to the results of the assessment, the following requirements apply when dealing with the uncertainties. In addition, if a measured power curve is available for the relevant wind turbine type ("verification power curve"), the power curve values and the measurement uncertainty of the verification power curve shall be taken into account for the uncertainty assessment of the calculated power curve.

Wind Conditions at the Turbine Positions
From the results of the data evaluation and calculations as described above, the following results are derived which are believed to be relevant for the assessment of site-specific wind conditions.
Air Density
Turbulence Intensity
Depending on the averaging period of the measurement and the sample rate, a correction of the turbulence measured under ideal conditions (disappearance and correction for the sampling rate) can be recommended. If characteristic or representative turbulence is calculated, the method applied shall be documented ensuring that the specifications and criteria of the method are respected.
Wind Shear Exponent
Extreme Winds
According to the requirements described in section 8.5, the consideration of uncertainties is seen as part of the results, from which hints for the meaning of the estimated extreme values must be derived.
Flow Inclination
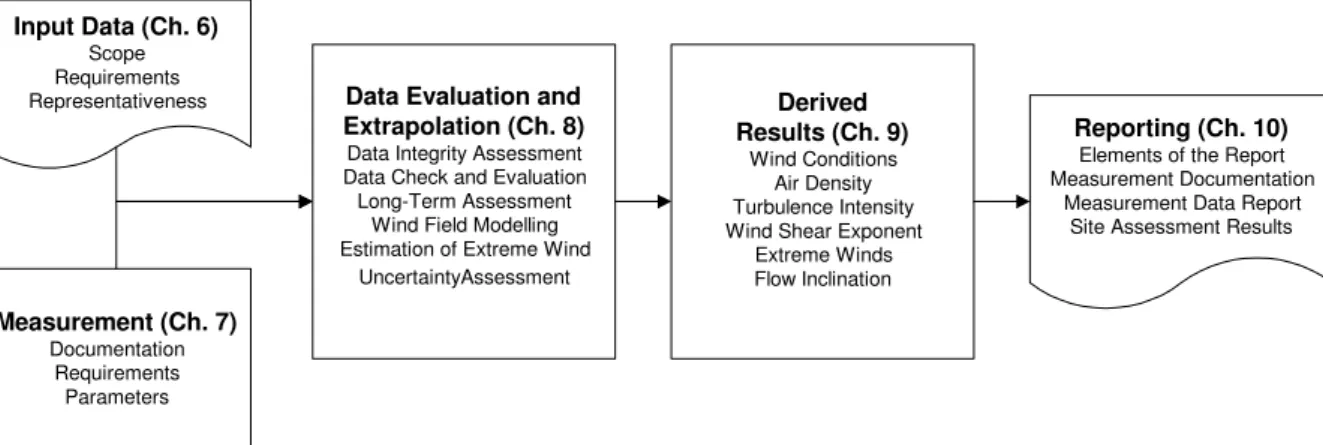
The following section lists the requirements for reporting the work done and the results derived for the site assessment. After reviewing the included parts, the important parts of the document are described in detail. Since the scope of work can in principle include the performance of a measurement, but it does not necessarily have to, a distinction must be made regarding the scope of work and the tasks performed.
Elements of the Report
Measurement Documentation
Topographic maps of the area showing the position of the mast 2) A description of the measurement system including: . a. identification of sensors and data acquisition system, including documentation of sensor calibrations; . b. description of the placement of cup anemometers and other sensors on the meteorological mast, following the requirements and descriptions in IEC and IEA [6]; .. c. weather mast arrangement diagram showing the main dimensions of the tower and instrument mountings; . d. describing the method of how to maintain the calibration of the anemometer for the duration of the measurement period and documenting the results showing that the calibration has been maintained.
Summary of Measurement Documentation
Measurement Data Report
Site Assessment Results
Further measured quantities (eg pressure, humidity) Average values of the quantities used must be stated. Furthermore, the site must be documented in terms of the structure of the site. The measuring heights of the SODAR must be programmed to the exact mounting heights of the cup anemometers.
The comparison of the SODAR measurements and the mast data shall be based on statistics over 10-minute periods. Ensure clock synchronization and common reference for file timestamp (beginning or end of 10 minute averaging period). The measuring heights of the LIDAR should be programmed to the exact mounting heights of the cup anemometers.
The comparison of the LIDAR measurements and the mast data shall be based on statistics over 10-minute periods. The data transfer parameters (BAUD rate, protocols) must be adjusted according to the requirements of the data logger.