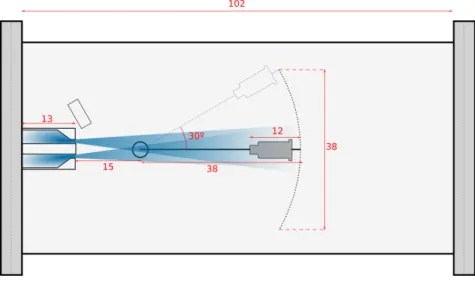
23 4.5 Image of the RPA mounted in the rotary arm (left) directly facing the thruster (right). 35 5.4 Estimation of the compressive stresses exerted by the plume front in the spherical cap covered.
Motivation
Several analytical and experimental studies of SPT later led to a decision by the State Committee of Atomic Energy in 1968 to run the first test of the E-accelerator in space, aboard the Meteor-type satellites. The use of SPT has increased steadily over the years, and in order to remain competitive with gridded ion thrusters, the double-stage hall thruster (DSHT) has been investigated, and a non-exhaustive review will be in Chapter 3.
Objectives
Specific Impulse Ispon on the other hand, in the case of a thruster, is a measure of how efficiently it uses its propellant. A propulsion system capable of accelerating its propellant to higher speeds therefore has a higher Isp, since for the same propellant mass flow the propulsion system delivers a higher force.
Document Outline
Thrust
Thrust is the force applied to the ship defined by the rate of change in its momentum [9].
Specific impulse
ID-HALL
Ionization Stage
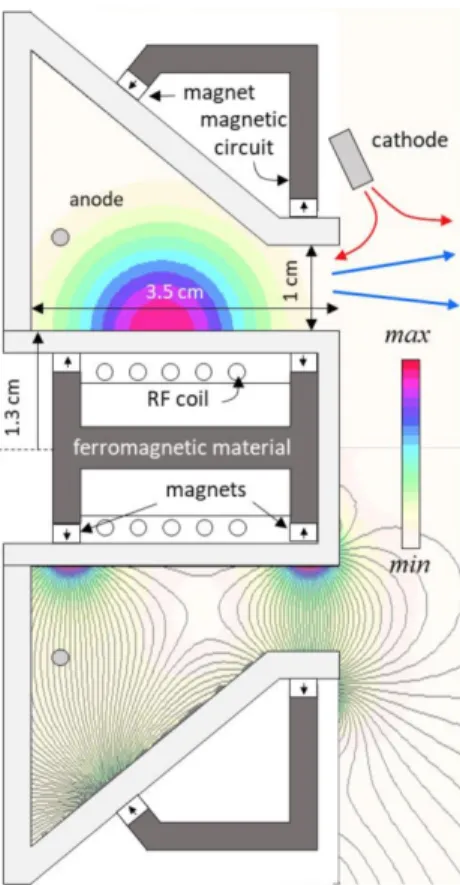
The inner cylinder is made of quartz, and the other walls in the ionization chamber and in the channel are made of ceramic material. These are values similar to those achieved in the ECR concept, but could not be increased in this case because there was a critical density. The values given here were for the IC source only and are expected to increase in the magnetic configuration provided by the ID-HALL DSHT.
Moreover, the axisymmetric geometry of the source is particularly suitable for integration inside a HT. Finally, due to their shape, it allows testing different configurations with adjustments in axial position. This magnetic field configuration also has not one but two magnetic barriers as can be seen in the bottom half of Figure 2.2.
The first one is the one needed for an HT in the exhaust area and the second one is located close to the back plate crossing the anode directly.
Computational Model
To maintain current continuity, the electric field must be higher in that region, giving rise to a change in potential. When the power source is switched on at 100W, we can see that the step disappears for the same position of the anode. This is because the high plasma densities imposed by the ionization stage increase the electron conductivity, thus making the necessary electric field lower or even 0.
Diagnostics
- Retarding Potential Analyzer
- Current Measurements
- Ionization Inside the Channel
- Ionization Outside the Channel
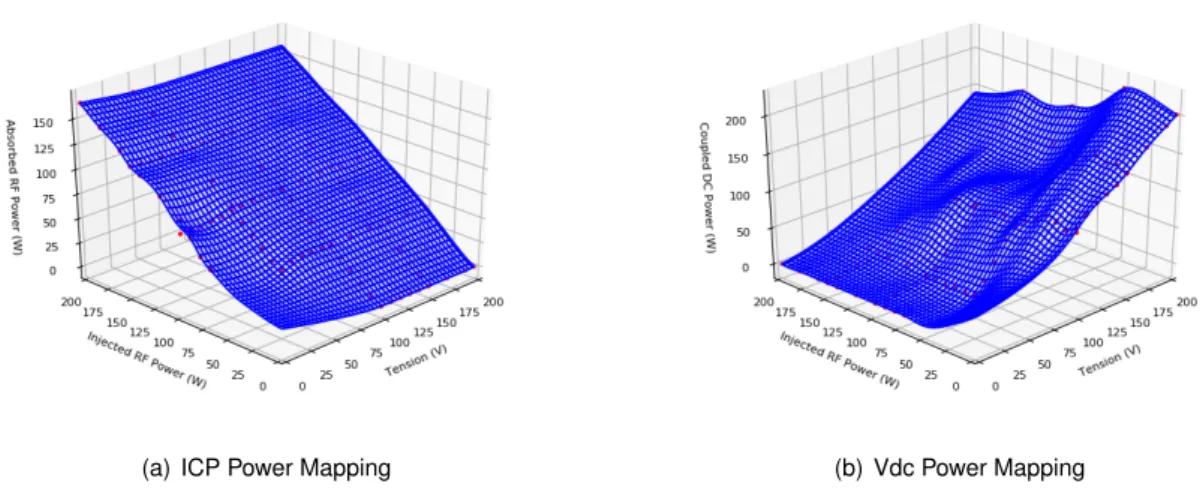
Both J and vavgare actually depend on the angle about the center of the thruster, J ≡J(θ, φ) andvavg≡vavg(θ, φ). When looking at the effect that both ICP and VDC effects have on thruster behavior, we first need to know what the actual power injected into the plasma is via both of these channels. In this design, a cylindrical resonant cavity is placed upstream of the thruster channel, as can be seen in Figure 3.1.
So far, it has been shown by simulations [18] that a non-negligible part of the ionization is taking place in the acceleration phase which would not correspond to a double operation. Plume characterization was performed and performance measured [19] for single- and two-stage propellant operations. Higher frequencies would require stronger magnetic fields to maintain resonance, which in turn would interact with the magnetic field of the magnetic barrier in the thruster channel.
Again, questions arose about the interaction of the magnetic fields involved in the ionization stage and the radial magnetic field of the thrust channel magnetic barrier.

Main Issues With the Previous DS Concepts
For this reason, the ionization rate must be as close as possible to or even within the magnetic barrier. The vacuum system in Figure 4.1 consists of a cylindrical vacuum chamber whose vacuum is driven by six pumps.
![Figure 3.7: Example of simulated ionization zone and potential surface along the centerline of a HT [7]](https://thumb-eu.123doks.com/thumbv2/123dok_br/19783061.0/38.892.221.670.228.480/figure-example-simulated-ionization-zone-potential-surface-centerline.webp)
Thruster
Retarding Potential Analyzer
Grid Voltages choice
It would be expected, since the electrons are filtered by the rejection grids, that the current would go to 0 at the higher sweep voltages in Ga. Two regimes are evident in the evolution of the plateau current leading to the analysis of the effect. As its negative voltage increases in modulus, rejected ions in the sweep network are increasingly attracted to its potential well.
Those trapped because they were accelerated in the well are energetic enough to emit secondary electrons upon collision. Complete sweeps were made on both gratings to map a surface for the current collected in the plateau as a function of the potentials of both repulsive gratings. The most relevant information we need to extract from this is the correct combination of rejection of grid potentials to get the smallest bias in the plateau.
The grid voltage configuration that gives the smallest offset occurs in the region where |VGr| < |VGad|so we set their voltages accordingly.

Grid Transmittance
Sweep Voltage Scaling
Data Analysis and Visualization
Utility Panels
This panel originally appeared because a Savitsky-Golay filter was originally applied by Dubois in his software to smooth the data. It allows the user to adjust parameter assumptions before fitting the model to obtain better results.
RPA Routine
A Savitzky–Golay filter [31] is then applied to obtain a differentiable curve as plotted next to Figure 4.15(b) of the preprocessed data. For the purpose of this thesis, we implemented a fitting tool using the Python package lmfit [32] to distinguish ion populations in distributions. From the parameters fitted here because we assume a 1D Maxwellian velocity distribution for each of the populations [8].

Visualization of Distributions
Although this study was the last to be conducted, we have chosen to present it first because its results will provide some intuitions that will be useful when considering the rest of the results. From now on, the angles referred to will be those relating to the thruster outlet. The angular profile was taken at 6o intervals for two different cases: one in single phase and another in double phase with 100 W of applied power at the ICP source.
For this estimate, we used the RPA current data (plotted in Figure 5.3) to obtain a boundary angle for which we defined the current as zero, for integration purposes. To make this possible, we had to construct a surface of the thrust pressure(θ, φ)(eq. 2.21) in the spherical shell covered by the RPA. If we now take φ= 360o,0o for values withθ >0 and φ= 180oforθ <0 we get a grid of currents that we can interpolate again, which gives rise to the surface seen in figure 5.4 for the spherical hood.
In both images we can see a slight asymmetry, which we traced back to a deviation in the vertical position of the anode.
Single Stage
Double Stage
Effect of Applied DC Discharge Voltage
After about VDC = 80V the increase is linear but before that value we see the curves tend to a constant value. We that the discharge current tends to a plateau above VDC= 75V in all cases. Before this plateau and for. a) Discharge current - black line indicates the ideal full ionization current for 6sccm Xenon, 0.43A. Ion temperatures Ti were also taken using the tools described in section 4.4.2 and are displayed in Figure 5.9.
As can also be seen in Figure 5.6, Ti is higher in the lower powers and appears to remain constant and below 0.5 eV for all VDCs for the two higher PRFs applied.

Effect of Injected RF Power
All the distributions are plotted in Figure 5.10 together with the line E =qVDC again as it was in Figure 5.6. We can now see that where we saw an increase in peak energy as VDC was swept, we now see a fairly constant value in the power sweeps, again consistent with the reference E=VDCline, as is also evident in Figure 5.11. These distributions were also fitted to single and double Gaussian peak models, allowing extraction of the ion temperature shown in Figure 5.12.
As expected after analyzing Figure 5.10, we see that even considering two separate distributions, in most cases the value of Ti is lower when more PRF is absorbed and is constant after PRF = 100 W. In the cases of VDC = 0 V and 50 V we see that the current increases steadily towards the full ionization currentIf ull. When using higher DC voltages, however, we see that there are two regimes: with PRF < 100 W, the current decreases with power and fluctuates (Figure 5.14) in the kHz range.
We can see that the oscillations disappear for specific RF powers and, looking at their respective distributions in Figure 5.16, we see that these correspond to narrower distributions.

Influence of Anode Position
Discussion
Anode Current Oscillations
The existence of two peaks in the one-step distribution (Figure 5.5) indicates the existence of two different populations of ions. It is therefore convenient to analyze the behavior observed in the low RF power study and refer to the diagrams in Figure 5.17. Having said that, we can conclude that the two-peaked distributions are actually due to fluctuations in the applied DC power, i.e. in the electric field.
First, due to high ionization, neutral density in the channel is depleted, significantly reducing the electron conductivity near the anode. This suggests that if we allow the ID-HALL's ionization stage to control ionization in the ionization stage, electron conductance will remain high near the anode, preventing the oscillations from occurring, yielding a single peak distribution. We also observed that when an oscillation was present, higher currents were measured in the RPA.
The entire step therefore takes place in the acceleration phase, downstream of the plasma bulk.
Future Work
During this work, a lot of time was spent on the development of the customized diagnostic software. Single velocity neutral source: diagnostics and physical investigation of Hall source in argon or xenon-argon mixture plasma. Model analysis of a double-stage hall effect thruster with double peak magnetic field and intermediate electrode.
Performance and plume characterization of a laboratory gridless ion thruster with closed electron drift acceleration. Performance of a hall propeller running on xenon, argon and nitrogen.Journal of Propulsion and Power. Experimental characterization of a new dual hall thruster design, the id-hall: importance of the concept.
The calibration of the RF probe used to measure the source current is provided by the calibration certificate below.
First ever SPT design, the E-1 accelerator model developed by Morozov [1] in 1965
Scheme of Stationary Plasma Thruster (SPT) (a) example of simulated electric field and
The ID-HALL Double-Stage Hall Thruster. The inner cylinder is made of quartz and the
Schematic of an RPA with the electrical potential landscape plotted on top [14]
Progression of the RPA data through the calculation process
Power mapping for both power sources: Inductively Coupled Plasma (ICP) source (a) and
DSHT with microwave ionization stage [4]
DSHT with intermediate electrode and four-coil configuration [18]
Diagram of the NASA-173GT [19]
Schematic of the SPT-MAG showing the ionization and acceleration stages[22]
Sectional view of the Electron Cyclotron Resonance (ECR) Hall thruster[24]
Helicon thruster schematic side view[26]
FMICP source developed in LAPLACE [28]
Longitudinal cut of the ID-HALL prototype being tested. Note that the backplate mentioned
![Figure 1.1: First ever SPT design, the E-1 accelerator model developed by Morozov [1] in 1965](https://thumb-eu.123doks.com/thumbv2/123dok_br/19783061.0/20.892.250.642.330.586/figure-spt-design-accelerator-model-developed-morozov-1965.webp)
![Figure 2.1: Scheme of SPT (a) example of simulated electric field and magnetic field magnitudes along the centerline of a HT [7] (b)](https://thumb-eu.123doks.com/thumbv2/123dok_br/19783061.0/23.892.137.787.682.947/figure-scheme-example-simulated-electric-magnetic-magnitudes-centerline.webp)
![Figure 2.4: Schematic of an RPA with the electrical potential landscape plotted on top [14].](https://thumb-eu.123doks.com/thumbv2/123dok_br/19783061.0/28.892.248.649.663.883/figure-schematic-rpa-electrical-potential-landscape-plotted-14.webp)
![Figure 3.1: DSHT with microwave ionization stage [4]](https://thumb-eu.123doks.com/thumbv2/123dok_br/19783061.0/34.892.260.621.105.471/figure-3-1-dsht-with-microwave-ionization-stage.webp)
![Figure 3.2: DSHT with intermediate electrode and four-coil configuration [18]](https://thumb-eu.123doks.com/thumbv2/123dok_br/19783061.0/34.892.264.634.831.1076/figure-3-dsht-intermediate-electrode-coil-configuration-18.webp)
![Figure 3.4: Schematic of the SPT-MAG showing the ionization and acceleration stages[22].](https://thumb-eu.123doks.com/thumbv2/123dok_br/19783061.0/36.892.266.625.281.625/figure-schematic-spt-mag-showing-ionization-acceleration-stages.webp)
