They encapsulate components that have hydroxyl groups (such as diethylene glycol and glycerol) that will react with the isocyanate groups of the foam. The presence of microcapsules did not significantly affect the quality of the cured foams.
Introduction
Motivation/Purpose
Until then, if the foam/foam is touched or handled, it will not serve its purpose because the foam cells will collapse and not expand properly. Microcapsules containing OH groups in the core (which are stable in an aerosol can, but will burst and release their contents after the foam is sprayed) are a potential solution to accelerate the drying process of PU foam, even in environments with low humidity (a weak source of OH groups).
Outline
Background
Polyurethane Foams
Microcapsules
- Polyurethane-Polyurea (PU)
- Polyamide (PA)
- Sol-Gel (SG)
They result from the reaction of an amine and acyl chloride, as in Figure 2.4, which shows the formation of the amide monomer. The microemulsion/sol-gel process is divided into two steps: first, a water-in-oil microemulsion is formed with decalin, (Figure 2.5) as a solvent in the continuous phase and a solution of water and glycerol (Figure 2.6), or a another alcohol, such as DEG, as a disperse phase.
![Figure 2.4: Reaction of amide. [16]](https://thumb-eu.123doks.com/thumbv2/123dok_br/19768884.0/25.892.145.751.478.604/figure-2-4-reaction-of-amide-16.webp)
Characterization Techniques
- Thermogravimetric Analysis and Differential Scanning Calorimetry (TGA and DSC)
- Fourier Transformed Infrared (FTIR) Spectroscopy
Infrared spectroscopy is a very useful technique that detects the presence of functional groups that make up a sample. Each functional group can be identified by its position in the IR part of the spectrum. The Fourier transform enables much faster spectroscopy (no need to scan over a large range of wavelengths) and a higher flow of infrared energy.
These two facts allow spectra without random noise and a better quality of real signals. Transmittance is the ratio of the radiant power transmitted by a sample to the radiant power incident on a sample [21].
![Figure 2.8: Stretching symmetric vibrations. [20]](https://thumb-eu.123doks.com/thumbv2/123dok_br/19768884.0/28.892.351.565.106.201/figure-2-8-stretching-symmetric-vibrations-20.webp)
Experimental Work
Microcapsules Production
- PU
- PA
- SG
As for PU MCs, a “water-in-oil” emulsion followed by interfacial polymerization was also prepared. The microemulsion consisted of a continuous (organic) phase of toluene and trimesoyl chloride (TMC, Figure 3.4), and the disperse (aqueous) phase contains DEG, water, a surfactant and an amine. TMC is an acyl chloride which reacts with amines and forms amides, as Figure 2.4 shows in section 2.2.2.
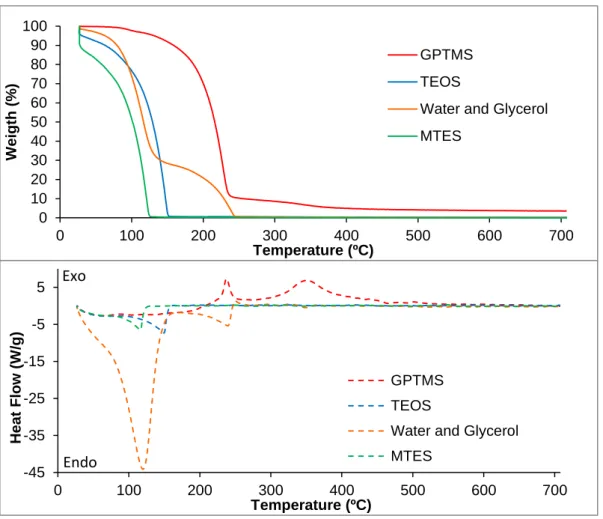
To prepare the sol-gel (SG)-derived MCs, the silane source (a mixture of TEOS, MTES and/or GPTMS) is hydrolyzed beforehand (solution 1). In parallel, a "water-in-oil" microemulsion is produced with a continuous (organic) phase of decalin solvent (Figure 2.5) with a low HLB surfactant and a dispersed (aqueous) phase containing glycerol (Cmd Chemicals) (Figure 2 ,6) and/or YOU and water.

Characterization Procedures
- Experimental Conditions
- Viscosity Test Procedure
- Can Preparation
- Spray Out and Output
The prepared cans are subjected to a series of tests which include spray and evaluation of the foam properties at 23ºC when dispensed from the can in a low humidity environment. The output is a test at 5ºC, which consists of measuring the amount of material that comes out of the can during a certain spraying time (typically 10 seconds). To ensure that all the mixture inside the can is at the test temperature, the can must be at this temperature for at least 4 hours before spraying.
In the present work, the output of the can was measured one week after preparation. To assess the quality of the foam with and without MCs (reference sample), the following tests were performed: A) 23ºC / low humidity environmental test: a small bid was injected inside a previously cleaned (with N2 gas) and sealed plastic bag , until the bag is full.

Results and Discussion
TGA and DSC
- PU Microcapsules
- SG Microcapsules
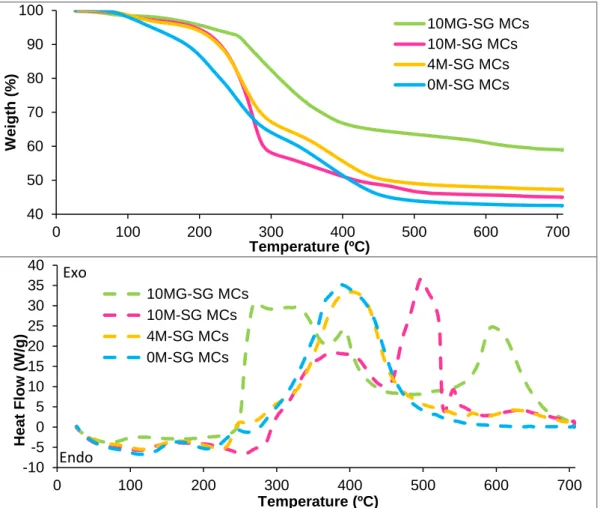
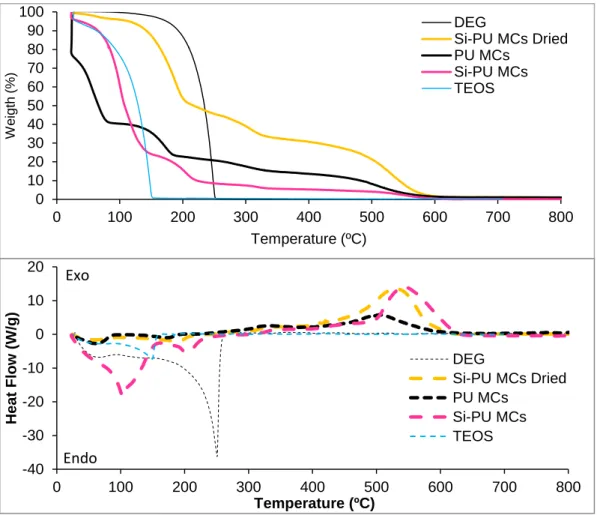
By analyzing the TGA profile, it can be concluded that the core plus the solvent around them is about 85% by weight of the whole microcapsule. This fact can be explained by the additional thermal stability that the silica network adds to the shell structure, due to the limited mobility of the PU chains in the presence of the silica network. The following Figure 4.4 shows the TGA/DSC profiles of the various SG-derived MCs encapsulating aqueous glycerol.
This is due to the inorganic SiO2 network that was formed by the polycondensation of Si-OH groups [24]. It should be noted that the presence of epoxy groups (derived from the GPTMS alkoxide) delays the thermal degradation, as shown in the DSC profile (green line), and may be the reason for such a higher carbon yield observed for MCs ( 10MG-SG MCs), in the TGA profile.
FTIR Spectroscopy
- PU Microcapsules
- PA Microcapsules
- SG Microcapsules
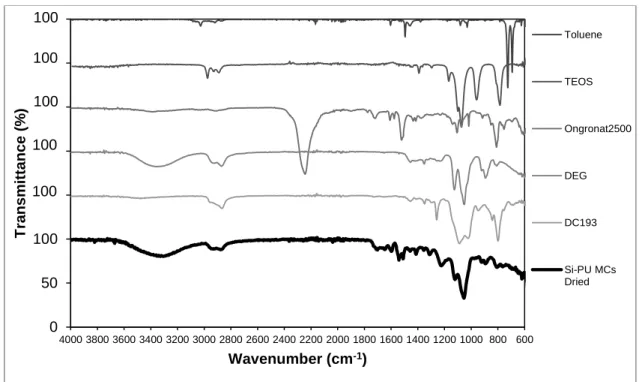
1055 cm-1 (C-O stretch), so we can ensure that it is well encapsulated, because it is the main component of the MCs and confirms the results of TGA/DSC analyzes indicating the presence of 50% aqueous DEG. There is no trace of the intense peak of Ongronat2500 at 2237 cm-1 in the MCs spectrum, because the bond N=C=O has reacted to form the polyurethane shell, as in Figure 2.1, so there is evidence of full isocyanate conversion, in polyurethane and polyurea, at the shell of the MCs. However, these peaks are of relatively low intensity, showing that the core content (aqueous DEG) is present in larger amounts than any of the materials composing the MCs shell.
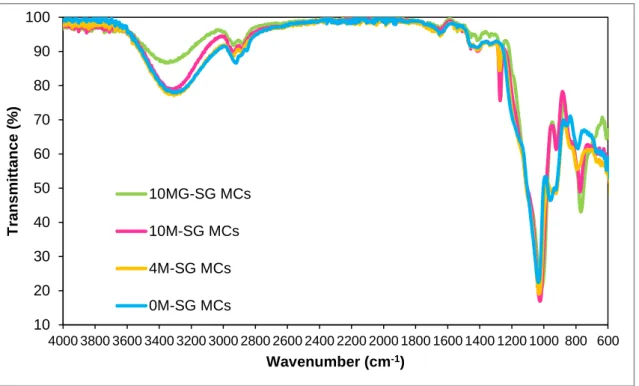
In Figure 4.12, it can be observed that there is no significant difference when PA MCs are washed through these two different methods. It is an appropriate tool to follow the structure evolution (by observing the spectra) with the increase in the amount of MTES (Figure 4.13), which was the strategy followed to increase the hydrophobic character of the MCs shell, useful to limit the occurrence of leaching.
Viscosity Test
- PU Microcapsules
- PA Microcapsules
- SG Microcapsules
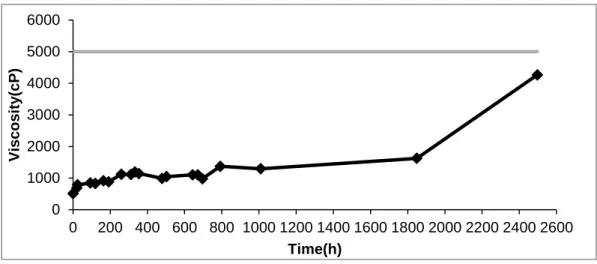
Two surfactants with a low and a high HLB value, respectively Span80 (Figure 4.15) and DC193 (Figure 4.16), were used in the production protocols. The graph in Figure 4.18 shows that MCs made with TEOS resulted in almost unchanged viscosity values over time, followed by MCs prepared with GPTMS. To understand the best OH source to be used in this synthesis, which will compose the MC core, DEG and glycerol were used, and the results of the viscosity test are displayed in Figure 4.38.
The glycidoxy group in GPTMS (Figure 3.3) favors the presence of hydrophilic moieties in the silane and later in solution before hydrolysis. As for PU and PA, if the samples are washed twice, the viscosity values are much lower (Figure 4.40).
Output and Curing Time
For all the types of MCs tested, the time required for the foam to cure was one day less than the reference. For the MCs tested, their output was much lower than that of the reference, so we can conclude that MCs increase the foam viscosity, making the spraying process more difficult. Despite the acceptable values on the viscosity tests for the Si-PU MCs and PU-MCs, there is an increase in the viscosity inside the can and a decrease in the output, indicating that leaching is occurring.
These experiments with MCs stored in a pressurized environment, such as that in the can, show that the gas and pressure appear to force the core out of the shell, which may explain why microcapsules with good results in the viscosity test affect performance so much the foam spray process. In addition, it should be noted here that the MCs with a higher leaching tendency react easily and faster with the NCO groups, forming a hard polymer shell around them, becoming heavier and tending to go to the bottom of the can.
Foam Quality
The reference represents the ideal parameters that a foam with microcapsules should have, except for the curing time. Some degradation may have occurred in the MCs when exposed to liquid gas and the pressurized environment inside the can. After incorporating the MCs inside the aerosol can, the hydroxyl groups will slowly diffuse throughout the can, reacting and increasing the viscosity of the foam and reducing the output value.
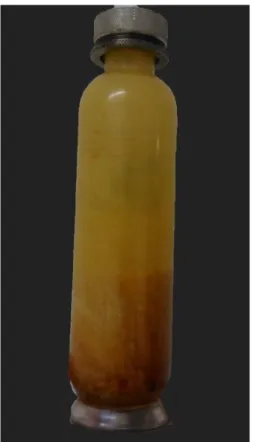
After removing the MCs from the can, we observed that the capsules were expanded and very spherical. In this case, they will agglomerate at the bottom (Figure 4.41), but they will not affect so much the remaining prepolymer inside the can, which may explain the better output result observed for the prehydrolyzed TEOS PU MCs (Table 4.2) ).
Conclusions
Future Work
Polyamide MCs and sol-gel-based MC samples still need to be embedded in polyurethane foam to evaluate yield values and drying times, as well as their in-box leaching behavior of the aerosol. The next step in the development of microcapsules for polyurethane foam systems should be to select the best shell material based on those results. Production parameters should be adjusted to completely prevent leaching, and other characterization techniques can be explored, such as N2 adsorption/desorption measurement, Hg porosimetry, surface tension, and microhardness evaluation.
Once this is achieved and the curing time is shorter than ordinary foam, the product must be presented to the customers.
Bibliography
Scherer, Sol-Gel Science, The physics and Chemistry of Sol-Gel Processing, UK: Academic Press, Inc, 1990. Sujatha, "Synthesis and Thermal Properties of Polyurethanes from Cardanol-Furfural Resin," Journal of Chemical and Pharmaceutical Research, full. . Badri, “Chemical analyzes of palm kernel oil-based polyurethane prepolymer,” Materials Sciences and Applications, vol.
Marques, "Characterization of sol-gel materials by infrared spectroscopy", in Handbook of Sol-Gel Science and Technology: Processing Characterization and Applications, Vol II, Characterization and Properties of Sol-Gel Materials and Products, Sumio Sakka, Kluwer Academic Publishers, 2005, pp. Yamaguchi, "Characterization and thermal degradation of polyimide and polyamide liquid crystalline polymers," Polymer Degradation and Stability, vol.
Appendix A
MCs Components FTIR analyses