The segment between the RRHs and BBUs is called fronthaul, and the main goal of this thesis is to study which technologies among Microwave Radio Links (MRL), Free Space Optics (FSO) and Fiber Optics (FO) are best for this segment of the network . This study includes how the number of BBUs at a given site can affect the overall CAPEX (Capital Expenditure) and OPEX (Operating Expenditure) of the network, by favoring some technologies over others.
Resumo
Nomenclature
Glossary
Introduction
Motivation and Overview
This new transport segment is one of the main interests of network operators when it comes to capacity, latency and other parameters. The study and optimization of the fronthaul segment can lead to a large decrease in CAPEX and OPEX expenses.
![Figure 1.1: Global total traffic in mobile networks [2].](https://thumb-eu.123doks.com/thumbv2/123dok_br/19768801.0/24.892.160.737.113.493/figure-1-global-total-traffic-in-mobile-networks.webp)
Thesis Outline
The main objective of this thesis is to study the use of Fiber Optics (FO), Microwave Radio Links (MRL) and Free Space Optics (FSO) technologies for fronthaul links. Finally, Chapter 6 contains a summary of this thesis, which presents the main conclusions of this work, and also addresses some suggestions for future work on this topic.
Background
- Cloud Radio Access Network and Fronthaul
- Communication Technologies
- Related Literature
- RAN Architecture and Fronthaul Design
One of the main technical challenges regarding C-RAN architecture is the large amount of baseband sampling data to be transferred in real time between RRHs and the BBU pool. This thesis aims to study the applicability of FSO, MRL and FO technologies in the fronthaul segment of the network. On the other hand, the low diffraction of the optical beam makes it a sensitive system, since the optical transceivers must also be perfectly aligned.
The slightest change in direction of either transceiver means a break in the connection. One must also take into account the position of the transceivers relative to the angle of the sun, as interferences may occur [8, 11]. According to [4], one of the main technical challenges when implementing a C-RAN architecture is the large amount of baseband sampling data that must be transferred in real time between the BBU pool and the RRHs.
![Figure 2.1: C-RAN architecture [5].](https://thumb-eu.123doks.com/thumbv2/123dok_br/19768801.0/29.892.182.712.180.461/figure-2-1-c-ran-architecture-5.webp)
Models for Communication Technologies
Microwave Radio Links
When it hits a raindrop, the plane wave energy can be absorbed (water is a lossy dielectric) or dissipated. Radio waves can encounter obstacles (such as trees, buildings or hills) that can deflect the signal and reach the receiving end, which may be "outside". As for Equation 3.10, h represents the height difference between the obstacle and the direct line between the transmitter and the receiver.
It is then possible to obtain the SN RIP C using Equation 3.18 and check whether the BER condition is satisfied for the considered modulation. These margins are the uniform margin, mu, selective margin,ms, and real margin,mr, which relate (in linear units) through Equation 3.19. When it comes to computing mbberr, it is necessary to determine what will be termed assesrbber, using equation 3.23:.
![Figure 3.1: Atmospheric absorption attenuation by Oxygen molecules (dashed line) and Water molecules (solid line) [16].](https://thumb-eu.123doks.com/thumbv2/123dok_br/19768801.0/39.892.214.676.134.658/figure-atmospheric-absorption-attenuation-oxygen-molecules-dashed-molecules.webp)
- Free Space Optics
- Fiber Optics
- Model Validation
Agl represents the geometric loss of the medium, which depends on the wavelength of the laser used and on the considered distance, in dB. Scattering is also a result of the interaction between the wave and the particles in the air. From here, select the unavailability index of the FSO link, p[%], to be considered.
FEIXER software [35] was used to validate the implementation of the equations used to calculate all attenuation, signal-to-noise ratio and error performance related to MRL links. This software was based on the equations presented in [15], which was also the main bibliographic reference for most of the equations surrounding the MRLs in Section 3.1. In [8], the author describes a scenario where an FSO link is established, specifying the link length, weather conditions and equipment considered.
![Table 3.3: Constants used in Equation 3.31. [25]](https://thumb-eu.123doks.com/thumbv2/123dok_br/19768801.0/49.892.218.680.671.912/table-3-constants-used-in-equation-31-25.webp)
Algorithm Implementation
Link Design Algorithm
- Algorithm Workflow
- Cost Analysis
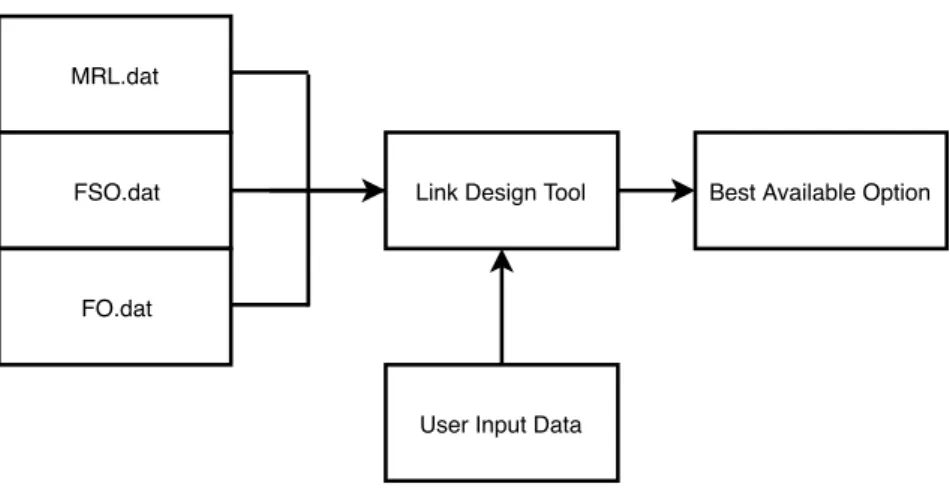
The workflow of the algorithm will be discussed thoroughly in section 4.1.1 of this chapter and the economic analysis will be presented in section 4.1.2. To avoid performing unnecessary calculations, the algorithm first compares the desired throughput with the throughput that the device is able to provide. For MRL devices, the algorithm will calculate free space attenuation (A0 in Equation 3.2), absorption attenuation (Aabsin Equation 3.3), rain attenuation (Arin Equation 3.5) and, if there is an obstruction, the attenuation caused by it ( Aobsin Equation 3.9).
From here, the algorithm evaluates the cost associated with the equipment and, if it has analyzed the lowest cost up to that iteration, the cost and equipment reference is stored as the best choice. After inspecting all the equipment provided in the ".dat", the algorithm returns the cheapest option for the considered scenario. Although the algorithm is prepared to test and analyze as much equipment as the user wants, some equipment is pre-selected to be able to perform tests for the case studies.
Network Planning Algorithm
- Algorithm Workflow
- Cost Analysis
An adaptation of the K-means clustering algorithm was used to calculate the number of BBU clusters along with their position. We can clearly see two of the centers moving towards the smaller clusters of dots at the bottom of the subfigures. It starts with a random choice of center positions and therefore may give different clustering results in different runs of the algorithm.
Second, to ensure that the random initialization of the BBUs' positions, for a given number of BBUs, does not affect the final results, a Monte Carlo simulation is used. The total cost of the RRH-BBU links is just the sum of all the output costs given by the link design algorithm and takes each RRH-BBU link's distance and required throughput as an input. In this way, it is assumed that the unit equipment price remains unchanged for large quantities, which means that the global cost of the RRH-BBU links considered in this project can be considered as an upper limit for the actual cost for the whole network.

Results
Link Design Algorithm
- Faro I
- Funchal
- Portalegre
- Faro II
All these cities have different characteristics in terms of visibility, rainfall, average temperature and other relevant factors for each of the communication technologies considered in this paper. Analyzing Figure 5.1, which presents the results of the Link Design Algorithm for this scenario, we can see that it is possible to successfully implement a link for all tested combinations of distances and throughputs. The costs corresponding to the establishment of links, using the equipment selected by the Link Design Algorithm, are shown in Figure 5.2.
The outputs produced by the link scheduling algorithm for this scenario are presented in Figure 5.5. Considering the fact that the intensity of the rain is similar to the first scenario, and even though optical fiber is considered cheaper for short distances (up to 3 km), MRL equipment is still considered the cheapest working solution for distances between 3 km and 15 km for smaller requirements on permeability. Eventually, it would be possible to use repeaters to extend the range of wireless technologies, but this is beyond the scope of this dissertation.
![Table 5.1: Characteristics of the Faro I scenario [17, 27].](https://thumb-eu.123doks.com/thumbv2/123dok_br/19768801.0/72.892.272.617.527.612/table-5-characteristics-faro-i-scenario-17-27.webp)
Network Planning Algorithm
- Rural Scenario
- Urban Scenario
The previous figure also shows how the cost of equipment decreases as the number of BBUs increases. But after a certain point, it does not globally compensate for increasing the number of BBUs to achieve lower equipment costs. Increasing the number of BBUs was still not enough to reduce the RRH-BBU distances to make the Artolink M1-GE the preferred device, accounting for only 11.1% of connections for this scenario.
Similar to the previous described case, the number of BBUs corresponding to the lowest overall network cost is 5. In this case, the number of BBUs was iterated from 1 to 245, but for better visualization only the first iterations are shown. Again, the mean and standard deviation will tend to zero as the number of BBUs reaches the number of RRHs.

Discussion
The simulations assume that all points are at the same height because no height map was used as input. The designed tool does not take into account the angle of the sun, which can cause interferences in the propagation of FSO technologies. The BBU cost is variable depending on the location being considered and has a major impact on the results of the Network Planning Algorithm.
Some can be inserted into an existing building, while some may require the construction of dedicated facilities, which again depends on the price per square meter and other factors for each specific area. Regardless of all the above factors, all the results can be used as a reference for the project manager. So, while the 100% achieved by FSO technologies in the urban scenario may not be entirely true in practice, it still means that FSO technologies are a very interesting option to consider and can play an important role in reducing costs while improving throughput delivery.
Conclusions
Achievements
The cost for this type of equipment is fixed regardless of the distance taken into account. To study the implementation of the links mentioned above, two programs were developed using Matlab: the Link Design Algorithm, for point-to-point connections, and the Network Planning Algorithm, for studying networks with more than one link. The second algorithm uses the first to determine the number and position of BBUs that allow the user to achieve the cheapest overall network.
Here it was possible to confirm that fog is a major limitation for FSO technology, as none of the equipment could perform for the given weather conditions. The results for this scenario were the same regardless of the required throughput being tested. This thesis compared the viability of each of the three technologies for fronthaul links, and offered recommendations of which are better suited under different circumstances.
Future Work
For throughputs greater than 1000 Mbps, FSO emerged as the only option, being able to achieve distances of around 5 km. The Network Planning Algorithm was run for two different environments, using the same weather conditions as in the Faro I simulation. For smaller throughputs, MRL technologies play an important role in the network, also reducing costs as less is needed BBU.
As throughput needs increase, so do the number of BBUs, to enable the use of equipment that is cheaper than fiber and requires short operating distances. FSO equipment thus emerged as a very attractive solution, as long as visibility conditions are favorable.
Bibliography
End-to-end error performance parameters and targets for international digital paths and constant bit rate connections.

![Figure 2.2: Advantages in BBU pooling regarding non-uniform traffic [3].](https://thumb-eu.123doks.com/thumbv2/123dok_br/19768801.0/30.892.131.765.331.573/figure-advantages-bbu-pooling-regarding-non-uniform-traffic.webp)
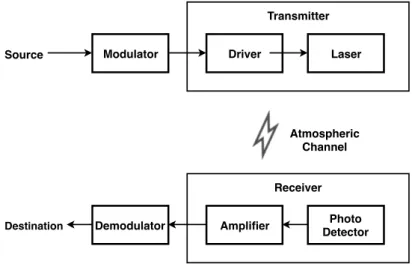
![Figure 2.5: Diagram of an Fiber Optics communication system [13].](https://thumb-eu.123doks.com/thumbv2/123dok_br/19768801.0/33.892.227.660.299.589/figure-2-5-diagram-fiber-optics-communication-13.webp)
![Figure 3.3: Minimum SN R IP C for specific BER and QAM modulation considered [22].](https://thumb-eu.123doks.com/thumbv2/123dok_br/19768801.0/44.892.244.646.309.898/figure-minimum-sn-specific-ber-qam-modulation-considered.webp)
![Table 3.1: End-to-end error performance objectives [24].](https://thumb-eu.123doks.com/thumbv2/123dok_br/19768801.0/45.892.107.789.827.970/table-end-to-end-error-performance-objectives-24.webp)
