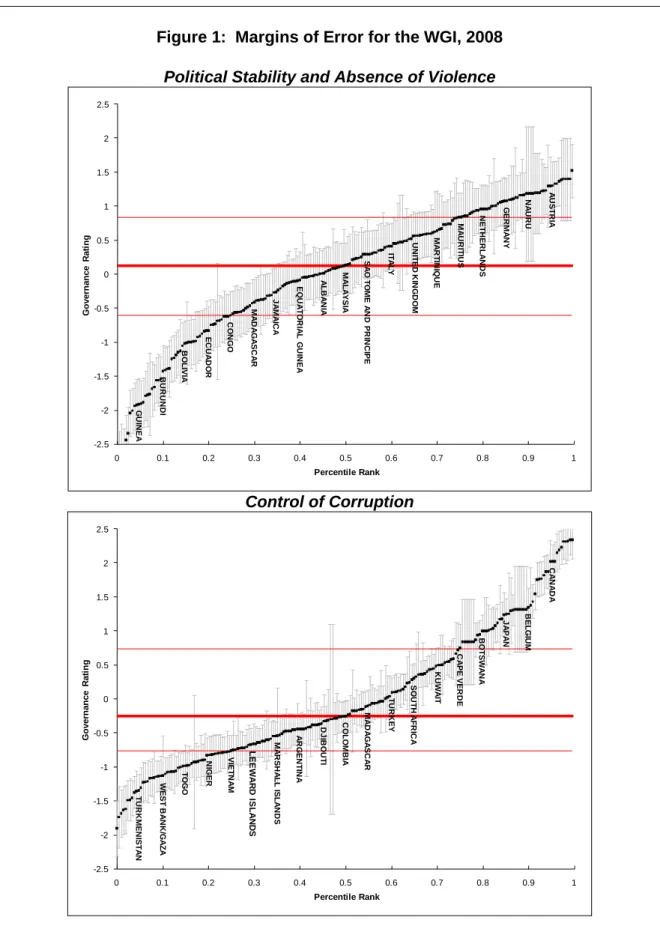
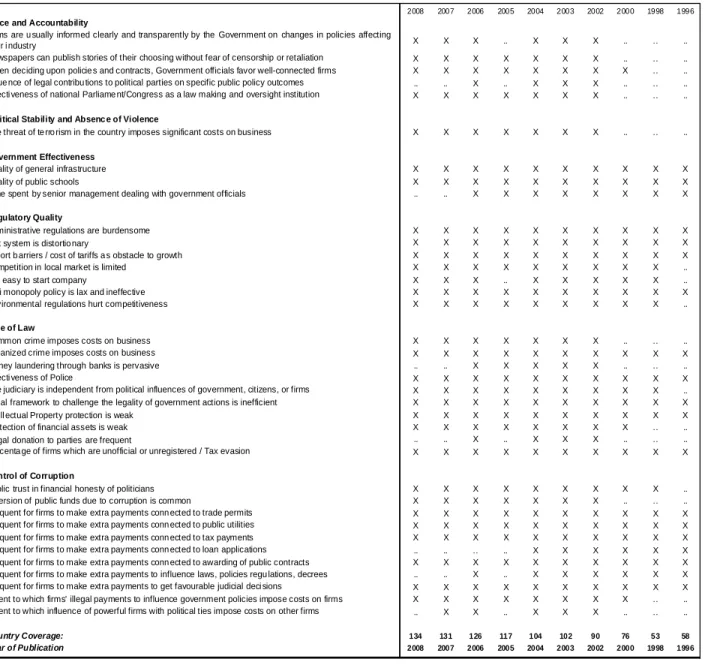
We encourage users of the governance indicators to take these margins of error into account when making cross governance comparisons. For the 2008 round of the WGI, we rely on a total of 441 individual variables measuring different dimensions of governance.
Revisions to Underlying Data Sources
To guarantee the comparability of this source in the long term, we are also removing these questions from the previous rounds of the BPS. At Global Integrity's request, we have canceled the 2003 round of the Global Integrity Index.
Aggregation Methodology
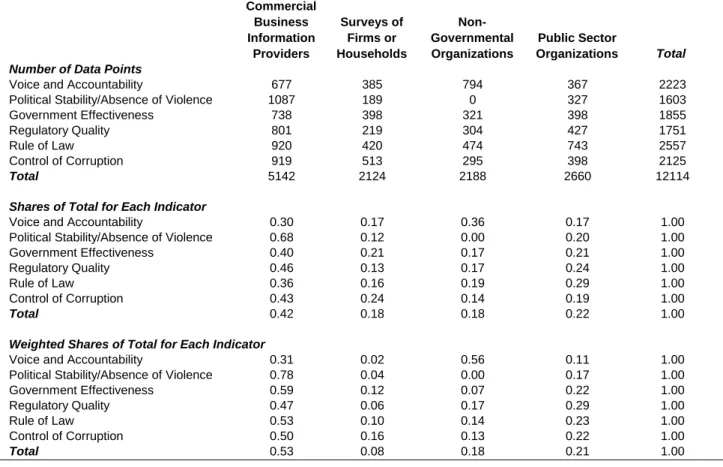
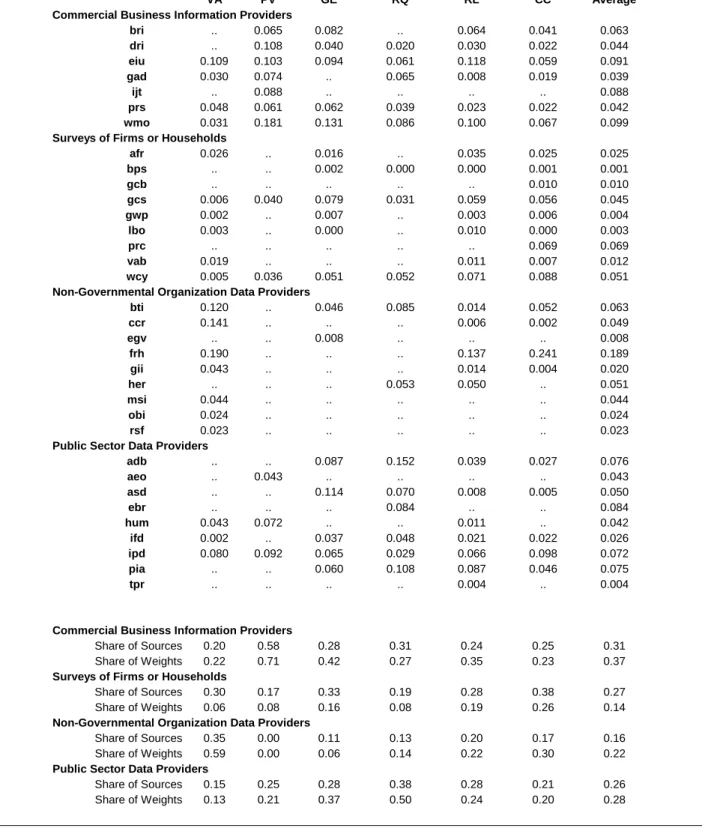
This table lists the weights that would be used in the event that a hypothetical country appears in all available underlying data sources. For each of the four types of data sources, we first report the share of each type in the total number of sources for each indicator.
Estimates of Governance 1996-2008
Cross-Country Comparisons of Governance Using the WGI
11 The X% confidence interval for management can be obtained as the point estimate of management plus or minus the standard error multiplied by (100-x)/2. percentile of the standard normal. We also emphasize that WGIs are unusual in that we generate and report these error bounds that allow for explicit significance assessment.
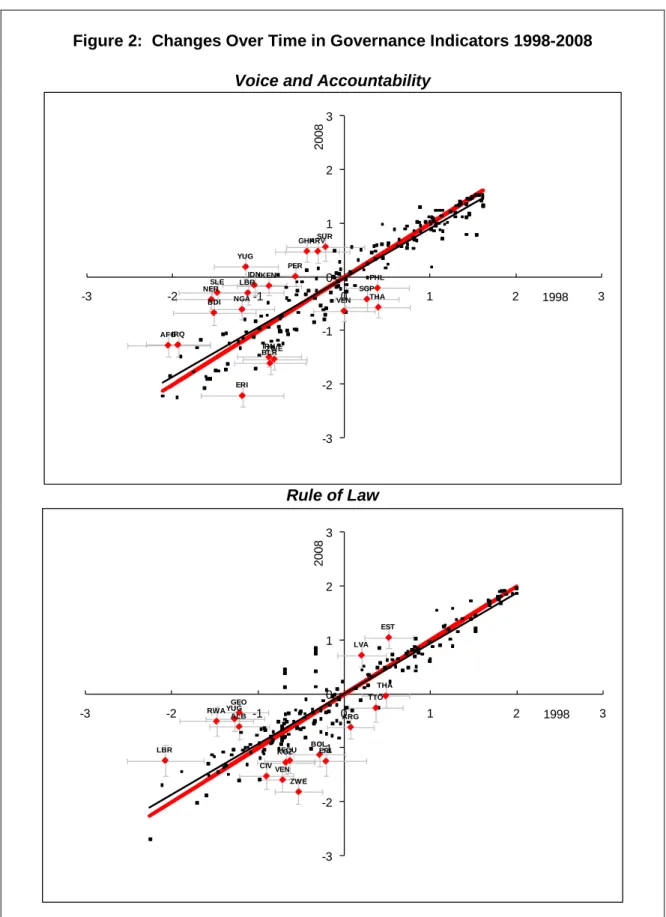
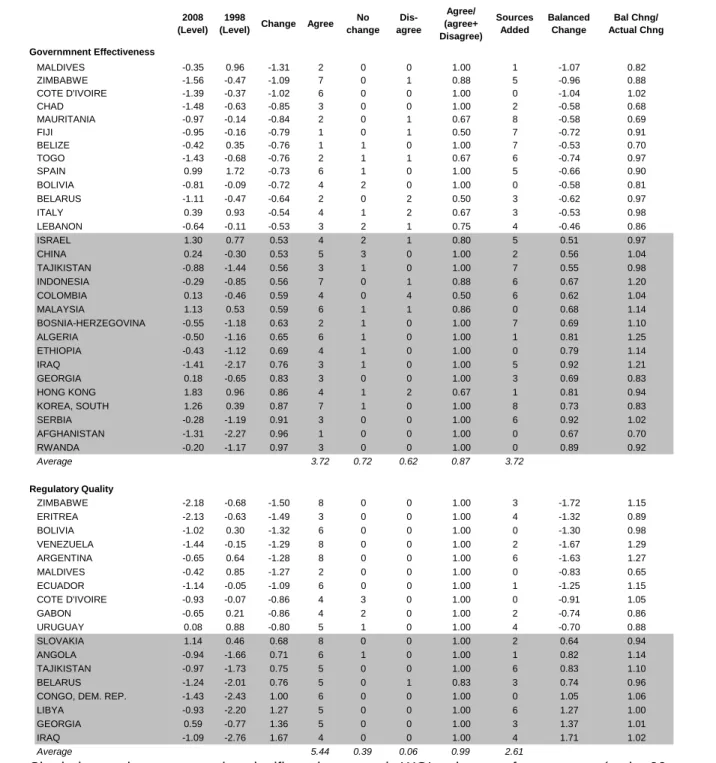
Changes over Time in Governance Using the WGI
The first three columns report the level of management in both periods and the change. 15 We note that the number of sources on which the WGI is based is increasing significantly.
Trends in Global Averages of Governance
For the period 1998–2003, the data show little evidence of significant trends in global governance averages. Discarding this source, we find that significant changes in global averages are roughly evenly split between declines (two) and improvements (three).
Conclusions
We also caution users that in some circumstances the aggregate indicators may be a rather blunt tool for policy advice at the country level. And we also encourage the use of these aggregate and individual indicators in conjunction with a host of potentially more detailed and nuanced sources of country-level data and diagnostics on governance in formulating policy advice.
Commercial Business
Providers
Surveys of Firms or
Non- Governmental
Public Sector
Commercial Business Information Providers
Surveys of Firms or Households
Non-Governmental Organization Data Providers
Public Sector Data Providers
Voice and Accountability
Political Stability/Abse
Government Effectiveness
Regulatory
Quality Rule of Law
Control of
Corruption Average Number of Countries
Median Number of Sources Per Country
Proportion of Countries with Only One Data Source
Average Standard Error
Note: Shaded areas correspond to significant increases in WGI estimates of management (at the 90 percent level), and non-shaded areas correspond to significant decreases. Note: Shaded areas correspond to significant increases in WGI estimates of management (at the 90 percent level), and non-shaded areas correspond to significant decreases. Level) Change Agree No change. Note: Shaded areas correspond to significant increases in WGI estimates of management (at the 90 percent level), and non-shaded areas correspond to significant decreases.
ALL CHANGES
Agree / (Agree + Disagree)
SIGNIFICANT CHANGES (90%)
Agree No Change Disagree
Sample
Balanced Samples]* ** ***
Change 1998-2008
Change 1998-2003
Change 2003-2008
Political Stability
Appendices
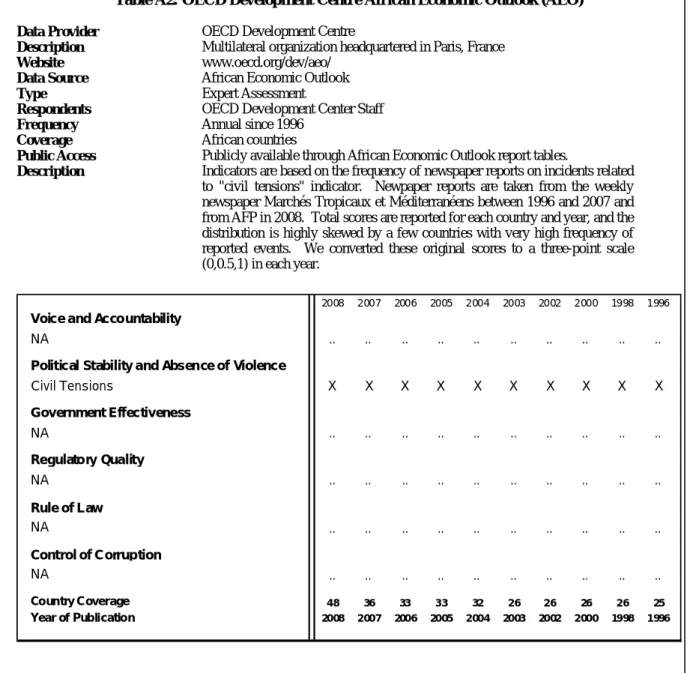
Appendix A: Sources for Governance Indicators
Appendix B: Components of Aggregate Governance Indicators
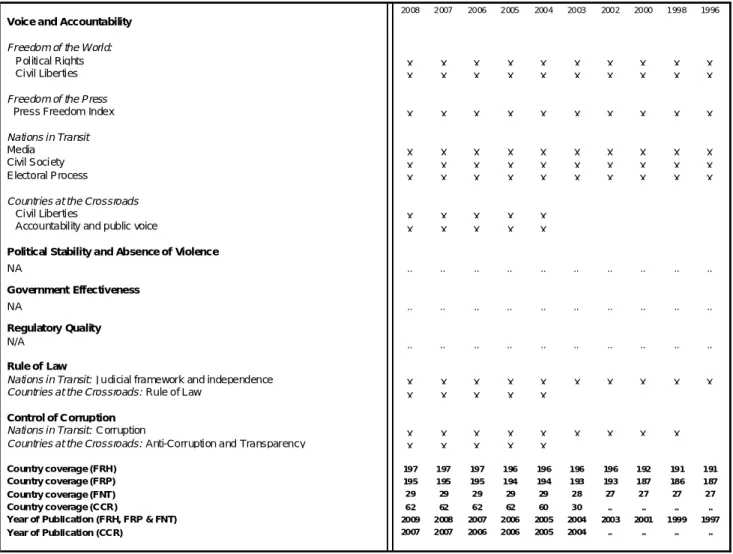
Appendix C: Governance Indicators over Time
Note that we cannot display 2006 and 2007 data because they have not been publicly released by the African Development Bank.
Political Stability and Absence of Violence
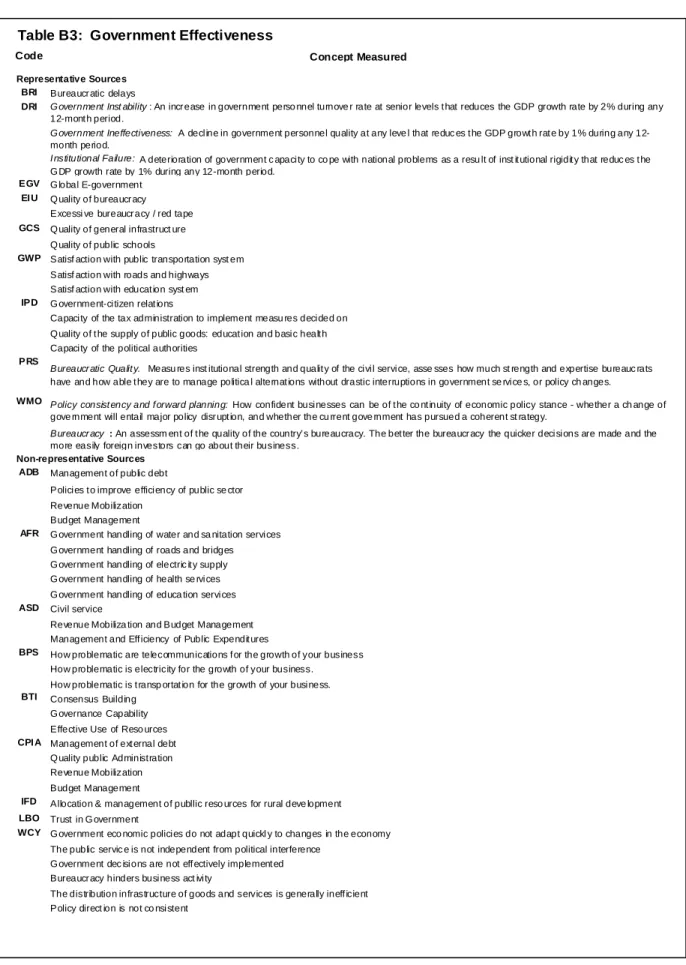
Government Effectiveness
Regulatory Quality
Rule of Law
Control of Corruption
Public Access Since 2005, only for countries eligible for concessional loans by the Asian Development Bank. Data source Political risk index and operational risk index (BRI), quantitative risk measure in foreign loans (QLM). PRI: External Causes of Political Risk: Negative Influences of Regional Political Power s X X X X X X X X X X PRI: Internal Causes of Political Risk: Social Circumstances: Wealth Distribution, Population X X X X X X X X X X X PRI: Internal Causes of Political Risk and Political Fracture: Power.
PRI: Symptoms of Political Risk: Sos ietal conflict that leads to protests, strikes and. PRI: Symptoms of political risk: instability as perceived by non-constitutional changes,. Respondents Staff of Bertelsmann Foundation Frequency Every three years since 2003 Coverage Global sample of countries Public Access Yes.
Description We use data on the subcomponents of the Status Index (SI – rates countries according to dimensions of democracy and market economy status) and the Management Index (MI – rates countries based on progress in achieving democracy and market economy status). Also note that the corruption variable comes from one of the subcomponents of resource efficiency.
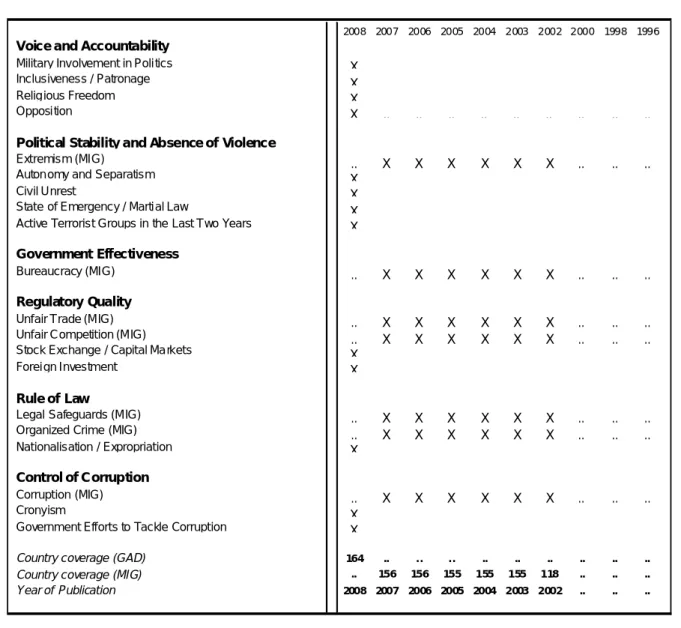
Political Stability and Abs ence of Violence
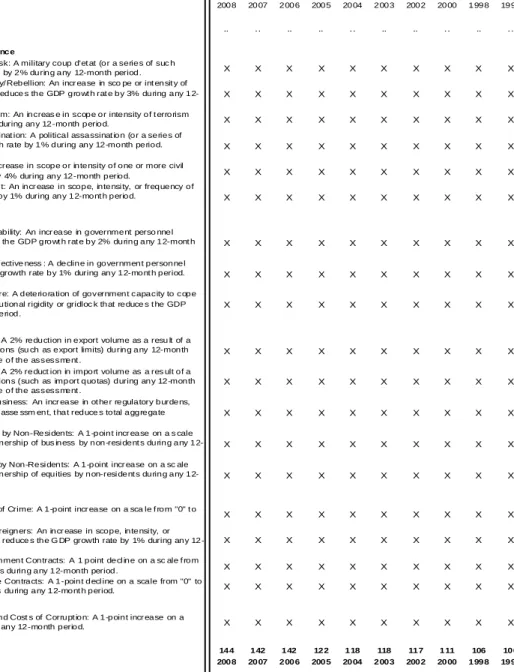
Domestic Political Risks: Military Coup Risk: A military coup by (or a series of such events) that reduces the GDP growth rate by 2% in a 12-month period. Domestic Political Risks: Major Insurgency/Insurgency: An increase in the scale or intent of one or more insurgent movements/insurgency that reduces the GDP growth rate by 3% in a 12-month period. Domestic Political Risks: Political Assassination: A political assassination (or a series of such events) that reduces GDP growth by 1% in a 12-month period.
Domestic Political Risk: Government Instability: An increase in government staff turnover rate at senior levels that reduces the GDP growth rate by 2% during any 12-month period. Domestic P olitical Risk: Institutional Failure: A weakening of the government's ability to cope with national problems due to institutional rigidity or blockage that reduces the GDP growth rate by 1% during any 12-month period. Domestic P olitical Risk: Kidnapping of Foreigners: An increase in extent, intensity or frequency of kidnapping of foreigners that reduces the GDP growth rate by 1% during any 12-month period.
Data source Freedom in the World (FRW), Freedom of the Press (FRP), Countries in Transition (FNT) and Countries at the Crossroads (CCR). This is a composite corruption indicator based on the aggregation of a subset of the data sources we use in our Corruption Perceptions Indicator. They usually combine the indication of the "legal" existence of a particular institution with "in practice".
We use a simple average of the "in practice" components of each of the GII indicators shown, consistent with our practice of relying purely on perception-based data in the WGI. The Political Terror Scale is a numerical coding on a 5-point scale of domestic state-sponsored political terror through imprisonment, torture, disappearances, and violations of the rule of law. Data provider French Ministry of Economy, Finance and Industry and Agence Francais de Developpement.
Political Stabili ty and Absence of Vi olence
Regul ator y Qual ity
Rule of Law
Contr ol of Cor ruption
Description The Open Budget Index is based on a questionnaire with 122 multiple-choice questions on various dimensions of the availability, timeliness and quality of central government budget documents. Description The International Country Risk Guide includes a Political Risk Index, which in turn consists of 12 components that measure various dimensions of the political and business environment facing businesses in a country. This will depend on issues such as: t the type of management, t the cohesion of the government and ruling party or parties, t the proximity of the next election, the government order of the legislature and approval of government policy.
Intermediate ratings are assigned based on the threats to the government and the companies. The law subcomponent is an assessment of the strength and impartiality of Description International non-governmental organization headquartered in Paris, France, dedicated to the protection of journalists and respect for press freedom.
Political Stability and Absenc e of Violence
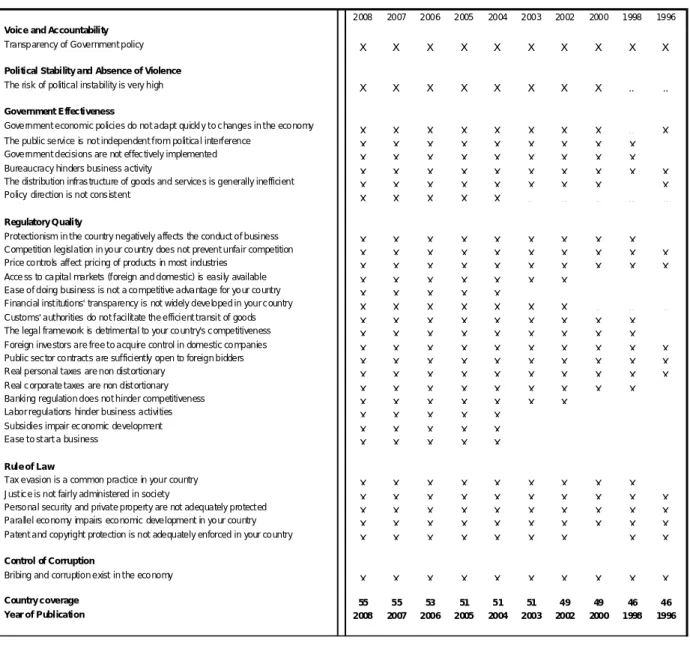
Ease of doing business is not a competitive advantage for your cooperation X X X X X. Description WMO produces assessments of the quality and stability of various dimensions of the business environment. Institutional stability An assessment of how mature and established the political system is.
Policy consistency and the future plan How confident can businesses be in the continuity of the economic policy stance - whether a change of government will bring about a major policy disruption and whether the current government has followed a coherent strategy. Legislation An assessment of whether the necessary business laws exist and whether there are any outstanding gaps. Judicial Independence An assessment of how much the state and other external actors can influence and distort the legal system.
Representative Sources EIU Orderly t ransfers
Representative Sources
Non-representative Sources
BPS How problematic is telecommunications for the growth of your business How problematic is electricity for the growth of your business. How problematic custom and trade regulations are for your company's growth. BPS Fairness, honesty, enforcement and speed in the legal system How problematic is crime for your company's growth.
AFR How many elected leaders (parliamentarians or local co-parliamentarians) do you think are involved in corruption. BPS How common is it for firms to have to pay irregular extra payments to get jobs done O on average, what percentage of the annual total do firms pay in unofficial payments to public officials How problematic is corruption f or growing your business. VAB Frequency of corruption among government officials WCY Bribery and corruption exist in the economy.
APPENDIX C: Governance Indicators over Time
Appendix D: Technical Details on the Construction of the WGI
D1. The Unobserved Components Model (UCM)
The parameter βk captures the slope of the relationship between true but unobserved driving and the observed data in indicator k. Finally, the standard deviation of the error term, σk captures how informative the perceived indicator of governance is about true governance. This in turn means that the distribution of driving conditional on the observed data for each country will also be normal.
Our estimate of governance for each country will simply be the mean of this conditional distribution, and the precision of this estimate will be the standard deviation of this conditional distribution. The variance of the conditional distribution summarizes how reliable or accurate this estimate of governance is. Nevertheless, we can obtain consistent estimates of the unknown parameters of the non-representative indicators by using the following simple argument.
D2. Rescaling the Aggregate Governance Indicators
Finally, we collect all parameter estimates from the representative and non-representative surveys and insert them into the expressions in equations (2) and (3) to arrive at estimates of governance and standard errors for each country. If the new countries added each year were broadly representative of the global distribution of governance, this would not pose any particular problems. In particular, the 2006 indicators cover between 206 and 212 countries, which we can consider representative of the world as a whole.
The standard error of the governance estimate should also be divided by the adjusted standard deviation shown. The higher the average score of new entries and/or the more entries there are, the more we lower the average in the previous period. We also adjust the standard deviation of the year T results to ensure that the standard deviation of this hypothetical sample will be one.