For each hand posture: the left bar is the seated posture; the middle bar is the slow walking condition; and the right lane is in normal walking condition. For each row, different background colors illustrate significant differences in accuracy between machine learning techniques.
The need for Accessible Touch Interfaces
Situationally induced impairments and disabilities can be due to either the work environment or the activities in which the user is engaged (Sears et al., 2003). At the same time, older adults (65+), who experience increased physiological tremor (Raethjen et al., 2000), may experience similar accuracy difficulties.

Goals and Hypothesis
Indeed, our first user study assessed motor impaired users' (i.e., tetraplegic) performance within a set of touch-based interaction techniques. Indeed, similarities emerged from the data, leading to the "Disability Continuum" concept, where both situational and health-impaired users' performance intertwined.
Research Approach and Overview
Research Overview
In addition, motion functions show promising results that can be used to compensate for typos in both groups. We analyzed the effectiveness of various machine learning techniques, prediction models and user-dependent solutions to conclude that motion data can be used as a unified measure to exploit input accuracy.
Research Contributions
Following these two user studies, we analyzed the similarities and differences between SIID and HIID in terms of typing performance and tremor measurements (Chapter 6). Based on previous user studies, we performed a comparative analysis of typing performance between groups of users.
Topics Outside Scope
We ran simulations from participants' data to assess how proposed models would affect writing performance. Although this is something we have not looked at, our models can easily be extended to incorporate language information.
Publications
In Proceedings of the 13th IFIP TC13 Conference on Human-Computer Interaction (INTERACT’11), Mobile Accessibility Workshop. In Proceedings of the 13th IFIP TC13 Conference on Human Computer Interaction (INTERACT’11), Mobile Accessibility Workshop.
Dissertation Outline
In Proceedings of the 12th International Conference on Human-Computer Interaction with Mobile Devices and Services (Mobile HCI'10). The most recent report from the World Health Organization1 sheds light on these issues.

Accessible Computing Approaches
Challenges on Accessible Computing
To provide interfaces that can be used by a wide range of users, designers and researchers should focus on users' abilities, not their disabilities (Wobbrock et al., 2011). First, we need to understand how factors such as light (Barnard et al., 2007), noise or mobility (Schildbach and Rukzio, 2010) (Nicolau and Jorge, 2012c) affect users' abilities to resolve the problems they experience . .
Maximizing Accessible Computing
Discussion on Maximizing Access
For example, SteadyClicks (Trewin et al., 2006) enables motor impaired and older adults to improve their clicking. On the other hand, an invisible keyboard shield (Trewin, 2002) or an angular mouse (Wobbrock et al., 2009) did not make their adjustments visible.

Conclusion
- Evaluation of Touch Techniques
- Results
- Towards Inclusive Design
- Summary
Considering all the interaction techniques, Tapping and Crossing were found to have more similarities between disabled and able-bodied users. No significant effect of interaction technique on the error rate when using the center area of the screen was found in either physically able-bodied or motor-impaired users.

Investigating Visual Demands
- Background
- Evaluation of Knowledge Reuse
- Results
- Lessons Learned
- Summary
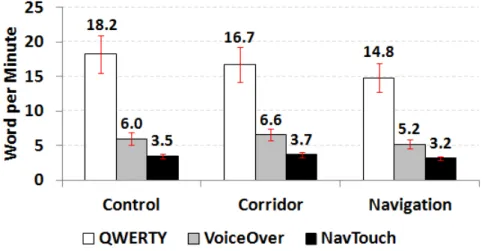
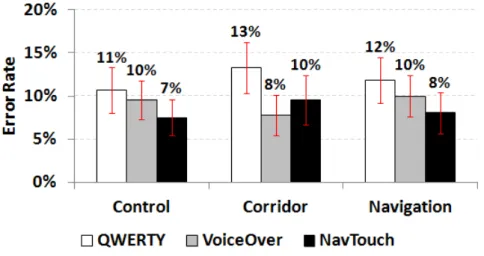
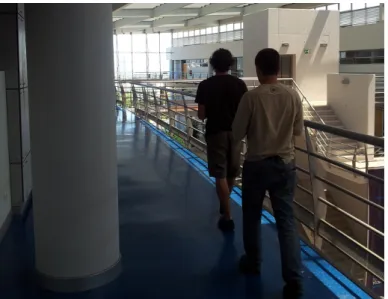
In mobile environments, there is a competition for user attention between the environment and the mobile device (Oulasvirta et al., 2005). In the corridor condition (see Figure 3-9), the QWERTY keyboard not only had a significantly higher error rate (13.27%) than NavTouch (9.55%), but was also higher than the VoiceOver method (7.79%) .

Lessons Learned and Implications from Preliminary Research
Research Approach: A Unified View on Users’ Abilities
The overall movement of the device presents new interaction challenges that reduce the user's typing performance. Motion data can be used to predict users' abilities in many situations.
Conclusion
Effect of Walking on Users’ Performance
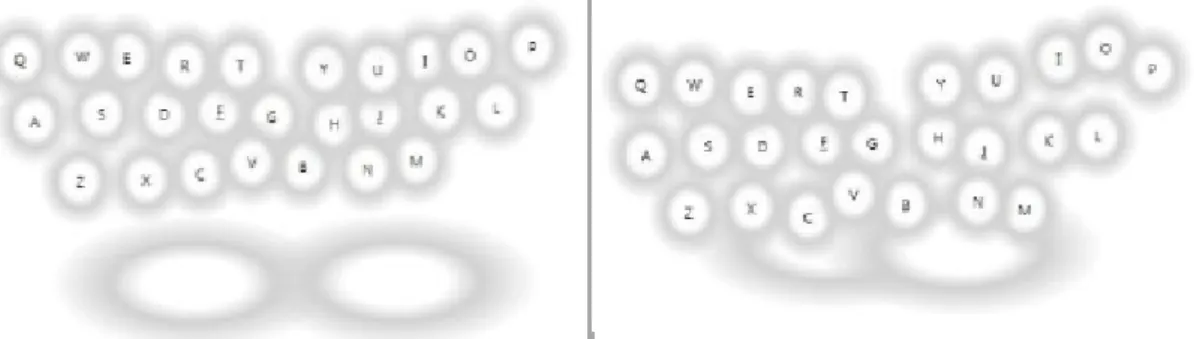
Barnard et al., 2007) assessed reading comprehension and word search tasks while walking under different lighting conditions. Mizobuchi et al., 2005) studied text input with a stylus (Figure 4.1 - right) and tried to reveal the relationship between walking speed and task difficulty.
User Interfaces for Walking
Kane et al., 2008b), reviewed in Chapter 2, explored an adaptive interface that increased target size in accordance with users' movement. Similarly, others have used accelerometer data to compensate for hand tremors during walking (Rahmati et al., 2009) (Yamabe and Takahashi, 2007).
User Study
- Research Questions
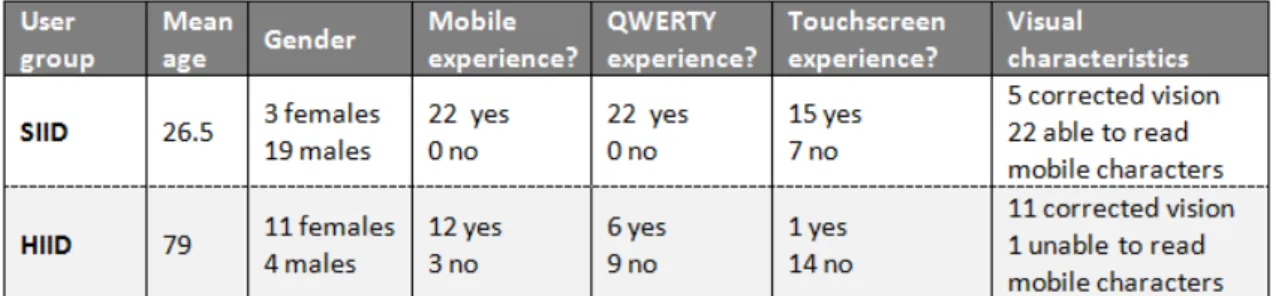
- Participants
- Procedure
- Apparatus
- Dependent Measures
- Design and Analysis
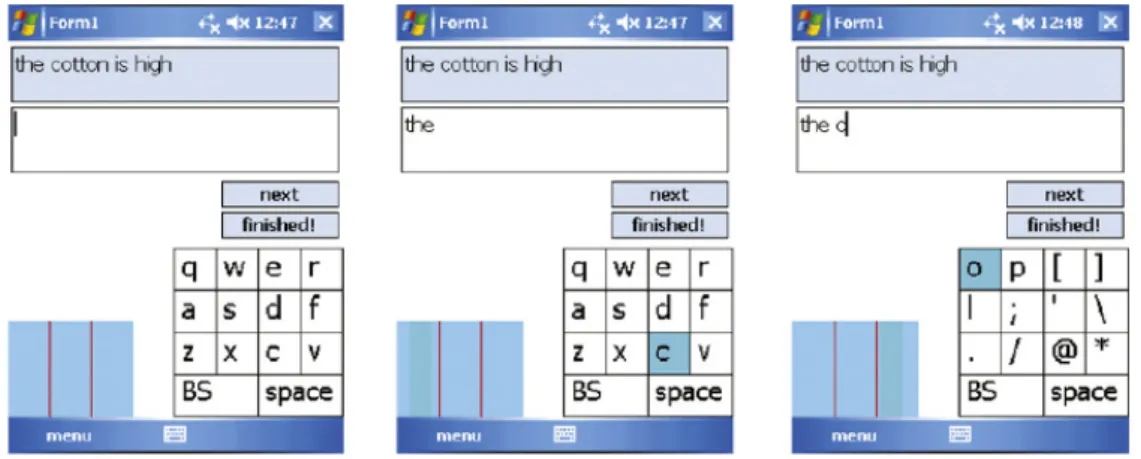
For each condition participants copied seven different sentences (the first two sentences were practice trials), displayed one at a time, at the top of the screen (Figure 4.4 - right). Qualitative measures were also collected at the end of the experiment by debriefing each participant.
Results
- Input Speed
- Quality of Transcribed Sentences
- Typing Errors
- Substitution Errors
- Insertion Errors
- Time-based Analysis
- Walking Performance
- Hand Oscillation
- Participants Preference and Comments
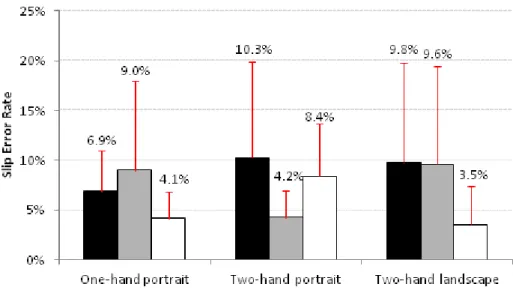
As with mobility, we found no significant effect of hand posture on insertion error rate (F2,42=2.211,p>.1). We found a significant main effect of mobility on long keypress error rate (F p<.05), with significant differences between the seated and normal walking conditions.
Discussion
Answering Research Questions
However, the two-handed prone mode effectively compensates for the negative effect of mobility, as participants achieved a lower error rate than the two-handed portrait mode. In general, participants preferred the prone position with two hands, mainly due to the larger target sizes.
Design Implications
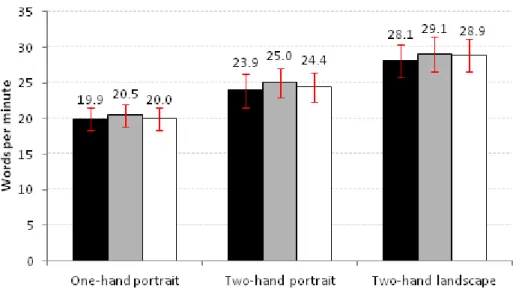
We found a significant main effect of hand position on words per minute, showing that two-handed landscape poses are significantly faster, independent of mobility mode, followed by two-handed portrait and one-handed portrait poses. Regarding the MSD error rate, the target size seems to have a greater influence, as only significant differences were found between bimanual landscape and the remaining postures.
Limitations
Traditional virtual keyboards often use keystroke-based techniques to provide new input methods (eg symbols and numbers). Additionally, results from the user study revealed that key hold latencies should be slightly higher while scrolling in order to prevent the activation of inadvertent access modes.
Conclusion
Older Adults and Tremor
In the most general sense, tremor is defined as any involuntary, roughly rhythmic and roughly sinusoidal movement around a joint (Raethjen et al., 2000). Other analysis techniques have also been used and include cumulative distance traveled (Rajaraman et al., 2000) and adaptive modeling (Riviere et al., 1997).
Older Adults, Touch, and Text-Entry
Wobbrock et al., 2003) proposed a stylus-based approach that uses the edges and corners of a reduced touch screen to enable text input tasks on a PDA. Similarly, Barrier Pointing (Froehlich et al., 2007) uses the edges or corners of the screen to improve pointing accuracy.
User Study
- Research Questions
- Participants
- Procedure
- Apparatus
- Dependent Measures
- Design and Analysis
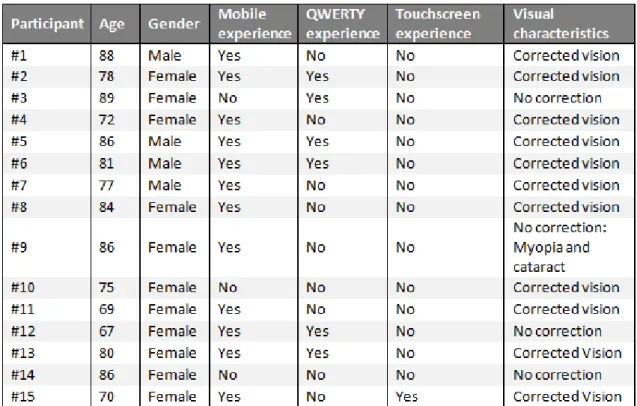
None of the participants had severe visual impairment; with corrected vision all participants were able to read the screen content. Goel et al., 2012), and created a keyboard in such a way that error correction was not available.
Results
Tremor Profile
It is worth noting that the results for each of the frequency ranges show high standard deviations, suggesting that tremor severity varies widely between participants. Again, as in the dominant hand results, the vibration magnitudes for each of the frequency ranges show high standard deviations, suggesting that vibration severity is highly user dependent.

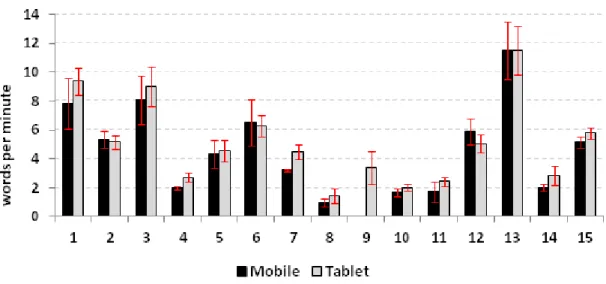
Input Speed
Regarding tremor Kinect had a strong and positive correlation with the magnitude of peak acceleration in the 7-12 Hz interval [Spearman rho=0.59, n=15,p<0.05], which is often associated with physiological tremor (Elble and Koller, 1990). The only exception was peak acceleration magnitude between 1 and 12 Hz [Spearman rho=-.393, n=9,p=.235] with a moderate but low significance correlation.
Quality of Transcribed Sentences
As in the mobile device condition, there was only a small correlation between MSD error rate and QWERTY experience[Pearson r=.155, n=15,p=.58]. Furthermore, both subjective and objective measures of tremor did not show any strong correlation with MSD failure rate in this device condition (tablet).
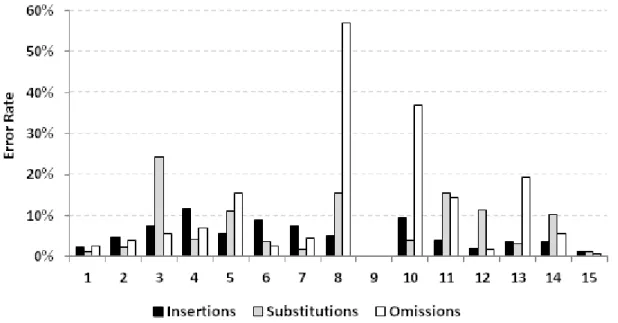
Typing Errors
No large correlations were found between omission error rate and subjective and objective measures of tremor in the tablet condition. On the other hand, we found a large correlation between the release error rate and hand swing in the mobile condition, suggesting that this measure may be related to motor skills.
Substitution Errors
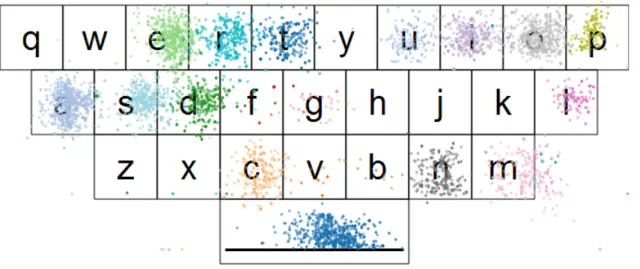
For this analysis, we calculated key centers of gravity for each key across all participants, which are shown in Figure 5-11. This finding suggests that the keys on the left side of the keyboard should be slightly wider (see Figure 5.11 - keyboard layout).

Insertion Errors
Omission Errors
Moreover, analysis of keyboard layout revealed no clear patterns of substitution errors (Figure 5.12). Overall, bounce errors and accidental touches account for a large number of insertion errors (Figure 5.15), so handling them will greatly improve input performance.
Participants Preference, Comments, and Observations
While omission errors may indicate forgetfulness on the part of the participants, there were also some issues with the touch interaction. Overall, there were three main reasons for the high level of omission errors: participants' forgetfulness (either due to lack of typing experience or due to inadequate mental models of required sentences), hitting "blank spaces" and accidentally touching the devices. boundaries.
Towards Inclusive Keyboards
Dealing with Insertion Errors
It is worth noting the decrease in performance of the user-dependent classifier, especially in the mobile device, corresponding to 8.5 times lower error rate. Additionally, this simple solution removed almost 30% and 50% of insertion errors in the mobile and tablet conditions, respectively, which is a good result considering its simplicity.
Dealing with Substitution Errors
Discussion
- Answering Research Questions
- Lessons Learned
- Design Implications
- Limitations
These findings suggest that future mobile interfaces should consider users' tremor profile to provide more appropriate models for text input. For example, derived keyboard layouts may reflect users' motor skills that will not improve with age.
Conclusion
- Participants
- Apparati
- Procedures
- Dependent Measures and Analysis
Twelve participants had a cell phone, but could only make and receive calls. At the beginning of the experiment, participants were told that the general purpose of the study was to investigate how text input performance was affected by walking conditions.
Investigating Differences and Similarities between HIID and SIID
- Input Speed
- Input Accuracy
- Substitutions in Detail
- Tremor Analysis
From Figure 6.6, we can clearly see that situationally impaired participants had higher and more stable dominant frequencies (less variance). The overall error probabilities (substitutions and insertions) follow the same pattern of intercept probabilities for both user groups; that is, participants' higher likelihood of hitting keys while moving their hands in specific directions was also reflected in higher error rates (Figure 6.11).

Discussion
Typing Behaviors
Tremor Profile
Relationship with Accelerometer Features
Recommendations for Design
Conclusion
However, others did not find this approach beneficial, especially when adaptations are visible (Go and Endo, 2007) (Al Faraj et al., 2009). Kane et al., 2008b) also investigated visual adaptations in walking conditions using accelerometer information to magnify targets.
Machine Learning Methodology
The techniques have been chosen to provide a wide range of approaches, namely: rules, statistical modeling, decision trees, linear models, and example-based learning. We used ten-fold cross-validation in our analysis, as this has become the standard method.
Building Instances
Touch Features
This function indicates whether the key that users originally touched (finger down event) is the same when they lifted their finger (finger up event). Direction to previous key (X, Y). The overall x and y directions between the last finger up position and the current finger down position.
Motion Features
The direction of acceleration, either positive (accelerating) or negative (decelerating), between the last and current finger lift events. This feature corresponds to the general direction of the instantaneous velocity, positive or negative, between the last and current finger lift events.
Instances
This allowed us to catch translation errors, for example in the word "but", the character 'u' was entered before 'b'. In a two-class situation, such as identifying whether a keystroke is an insert or not, a simple and common way to make any learning scheme cost-sensitive is to duplicate instances in the dataset (Witten and Frank, 1999).

Research Questions
Evaluation Measures
After designing and building our models (see next section), we measured their performance in terms of accuracy and kappa statistics. Obviously, we used different evaluation techniques to avoid learning bias, such as stratified cross-validation.
Dealing with Insertion Errors
Design of Insertion Classifiers
Second, we added the amplitude of the dominant frequency, as this is a commonly used measure to characterize tremor amplitude. Indeed, these two features give us an approximation of the users' hand movement frequency and intensity.
Evaluation of Insertion Models
Building generic models (i.e. using data from all participants) will therefore result in low classification performance. To mitigate bias caused by the training sample, we used a stratified 10-fold cross-validation to calculate the models' accuracy and kappa statistics for each participant.
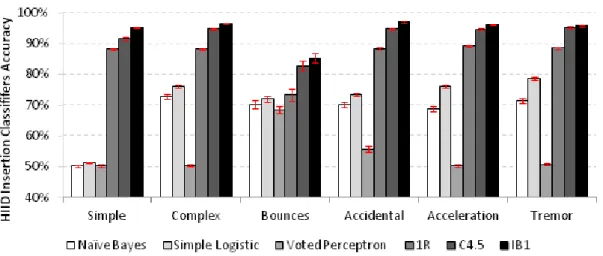
Major Results
Dealing with Substitution Errors
Design of Substitution Classifiers
Description: This classifier improves the Complex Touch-based classification by analyzing movement variance during typing tasks. It counteracts the overall movement of the device by allowing the screen content to move in the opposite direction.
Evaluation of Substitution Models
Major Results
Discussion
Unifying Model
Improvements on Typing Accuracy
Conclusion
Contributions and Major Results
Benefits
Limitations
Future Work
Final Remarks