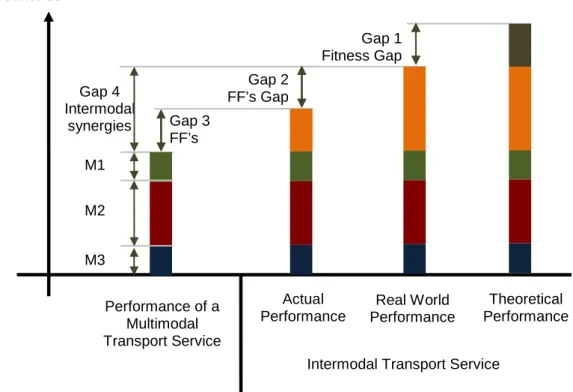
Such behavior raises concerns about the sustainability of the sector in the long term (especially in the capacity of the positive years that the negative plus generates enough internal capital) (Doganis, 2006, pp 6, Button, 1996, pp 276, Button, 2003, pp. 5). A third gap is also identifiable between the actual performance and the performance of the multimodal transport service. A final gap can be identified and corresponds to the difference between the real world performance and the performance of the multimodal transport service.
The first source of adaptability refers to adaptation changes between agents that can lead to improvements in intermodal transport service performance. The production of an intermodal transport chain involves some kind of contact between agent workers.

SIMULATION MODEL - AFETAS
For example, in a special situation, such as: incomplete information, delays, special requirements, etc., employees of an agent can turn to the employees of the other agents. Relational friction therefore emerges when there is either a lack of commitment to intermodality, or tension or suspicion among the agents' employees. The relationship friction can be strong enough to dictate the failure of intermodal transport services.
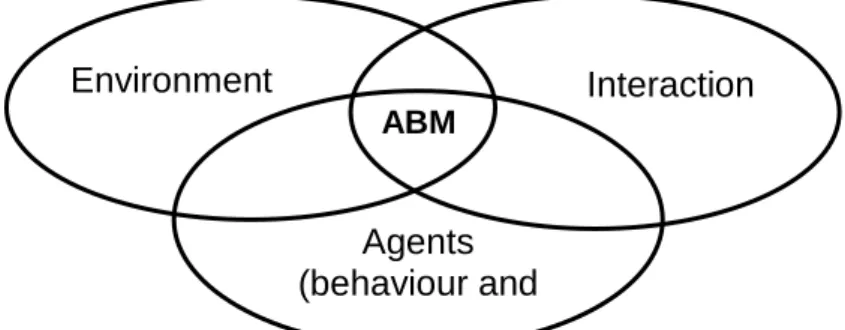
The environment is built to recreate properties similar to those found in real-world conditions, such as: temporal dimension (for example: second, hour, day, or year), geographic dimension, and potential obstacles to agent movement or interactions (on example: rivers or lakes; .or walls, stairs or elevators), limit values (for example: maximum vehicle speed or weight and volume, which are always non-negative values) (Russell and Norvig, 2003). A simulation model is created to assess the impact of competitiveness factors. This model is hereafter referred to as the Air Freight Transport Market Simulator (AFETAS). Freight companies transport cargo between origin and terminal (gate to airport) or between terminal and destination (airport to gate); or between terminals (airport to airport).
Regarding the geographically-related dimension, AFETAS recreates a market geography that relates air transport services (Figure 7). Freight transport services take place in one direction from the origin region to the destination region. AFETAS simulates a freight transport market where the different freight transport agents interact (compete, cooperate or negotiate) on intermodal or single agent transport services aimed at winning the customer's trust.
Physical: according to the transfer of the goods between freight carriers (unidirectional from origin to destination);
EMPIRICAL SIMULATION ASSESSMENT
The variable used to measure the level of performance of intermodal transport services was: market share. As explained, the airline sector has already largely eliminated sources of friction along several fitness dimensions. In other words, the results of the base case are the benchmark against which the (eventual) impact will be assessed.
In this case, all agents and protoagents are considered to be identical. Reduction of transshipment time at the airport, as cargo does not need to be unloaded from (or loaded) from a ground vehicle, sorted and loaded into (or unloaded) containers. A reduction in the damage rate of the operator of the manipulation, because the cargo is protected throughout the journey in containers and is not subjected to any manipulation procedures at the airports.
The assessment of the impact of the schedule coordination factor was carried out by taking into account that one or more air carriers and the target ground carriers coordinate their schedules, while the remaining carriers have non-coordinated schedules. Of course, in the event of any delay in the air part, the ground transport service is lost, and the cargo remains on the ground (the same would not happen in the case of a gap between transport services). The price coordination factor is one of two factors (the other is the schedule coordination factor and was discussed in the previous chapter) of the relational dimension of suitability.
The assessment of the influence of the price coordination factor, to validate the theory, was done by considering that one or more carriers agree to reduce their.
RESULTS
Regarding the Type 2 market, the evidence is also strong for time-sensitive and time-neutral customers. Finally, for market type 3, the evidence is weaker, as there is no clear gap between fitness chains and others. The results demonstrate the existence of benefits derived from the relational dimension of physical fitness (factor: schedule coordination).
The evidence is strongest in Market Type 1 and Market Type 2 for all customer types. Regarding market type 3, the performance of fitness chains is significantly greater than the others, both in terms of average and maximum achievable market share, and in terms. Fitness chains are present in both Market Type 1 and Market Type 2, a clear advantage over other chains.
The results in Market Type 3 are in line with the previous results, but more dispersion is visible. Among the different fit dimensions, the price coordination factor of the relational fit dimension is the one where the benefits are more obvious and sharper. With market type 1 and market type 2, there is little room for doubt about the importance of this factor; while for market type 3 the results are not so clear; the difference between fitness chains and the others is significantly greater, which leads the author to claim that there is an advantage.
In summary, in two markets, market type 1 and market type 2, the results demonstrate a clear advantage of fitness chains compared to non-fitness chains; while for market type 3, the results fail to clearly show the advantages of fitness chains.

CONCLUSIONS
The results obtained for this type of market reveal that non-fitness chains have a market share of about zero and a maximum of about 0.7%; and that fitness chains have a market share of about 2.5% with a peak of about 16%. The difference in results is clear that, despite the fact that it is not possible to claim that zero values do not represent any assessment, the author is convinced of the advantage of fitness chains over others. However, the existing (weak) evidence seems to support the validity of the author's claim that fit dimensions are potential competitiveness factors.
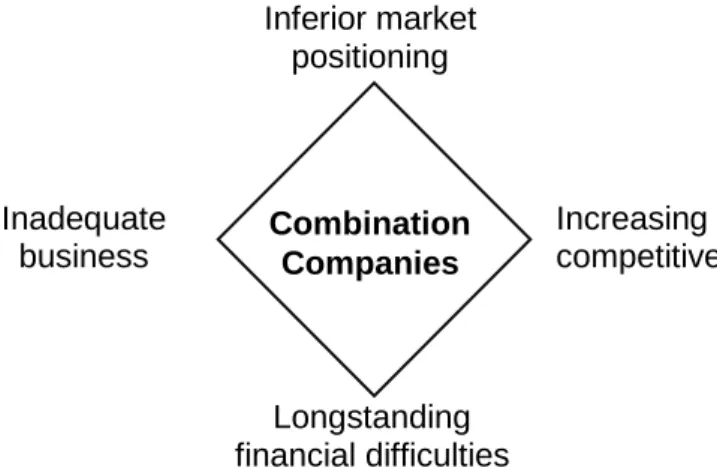
Therefore, passenger airlines must find alternative ways to increase their competitiveness in the air cargo market. Improving the degree of integration between combination companies and other carriers was the intended solution to achieve that goal. Consequently, improving integration can lead to a reduction in performance losses and thus contribute to improving the performance of the intermodal transport service and ultimately contribute to the competitiveness of combination companies.
The paper begins by analyzing the sources of performance of intermodal transport services to find that there are three main sources of performance: dual systems. An agent-based model called AFETAS was developed to assess the impact of these dimensions on the competitiveness of passenger airlines in the air cargo market. Therefore, we can conclude that passenger airlines that strive for deeper integration along these relevance dimensions can expect to achieve higher performance and thereby increase their level of competitiveness.
In conclusion, both the physical dimension of fitness and the relational dimension of fitness are factors of competitiveness for passenger airlines in the air cargo market.
BIBLIOGRAPHY
The current demand paradigm is largely based on high quality door-to-door transport services and secondly, air transport provides point-to-point transport services; then it is to be expected that they will eventually be called upon to integrate with other modes of transport (in the production of door-to-door intermodal transport services). The model simulates an intercontinental freight market where intermodal air transport services are required. Problem? Liberalizing European Aviation: Is There an Empty Core Problem?”, Journal of Transport Economics and Policy, Vol 30, Issue 3, pp Does the 'core' theory explain why airlines fail to cover their long-term costs of capital ?”, Journal of Air Transport Management, Vol 9, pp Principles and concepts of agent-based modeling for development geospatial simulations”, University College of London, Working paper series – paper 110, ISSN commitment”, in “Lecture Notes in Artificial Intelligence , Full.
2005) “The performance of the European liberalization process – an assessment of the scheduled air transport market”, MSc Thesis, Faculty of Engineering of the University of Oporto (Portugal). 2010) “Cargo Business Development in Combined Airlines”, PhD Thesis, Instituto Superior Técnico, Lisbon (forthcoming). 2009) “The World Economy and the Air Cargo Business”, presented at the 7th Annual Aircraft and Transport Operations Conference, Brussels (Belgium), 1-2 April 2009. Shipping Digest (2008) “Air Cargo Industry Group says safety should not be a hindrance to trade", released 22 December 2008. 2009) "Mechanistic simulations of inflammation: Current status and future perspectives", Mathematical Biosciences, Vol 217, Issue 1, pp Calculus of fuzzy limits", in " Fuzzy Sets and their applications to cognitive and decision processes", Editors Lofti Zadeh, King-Sun Fu, Kokichi Tanaka, Masamichi Shimura, Academic Press Inc., New York (United States), ISBN Zhang, A.;.
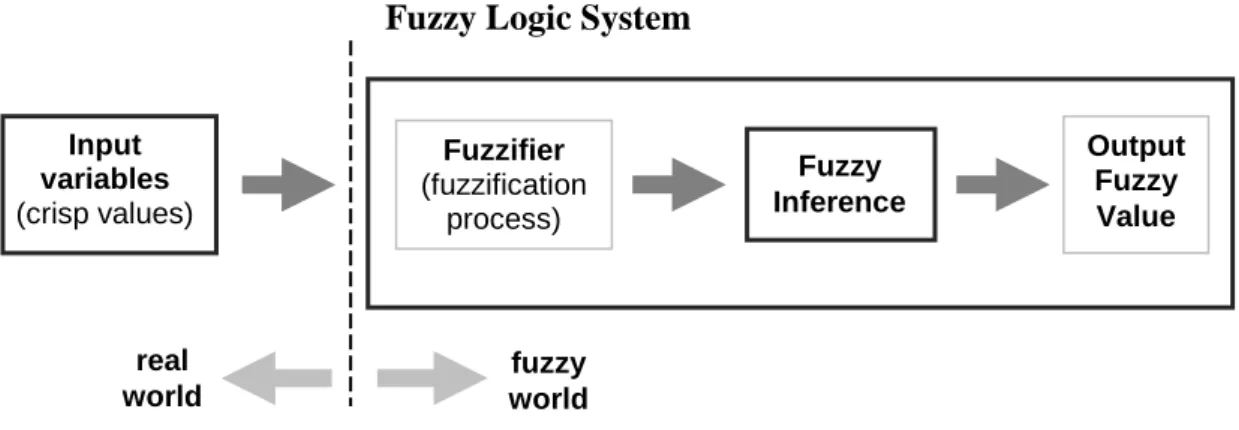
Zhang, Y. 2002) "Issues on the liberalization of air cargo services in international aviation", Journal of Air Transport Management, Vol 8, pp Competing for air cargo – an qualitative analysis of competitive rivalry in the air cargo industry", Master Thesis , Free University of Amsterdam, Amsterdam (Netherlands), Link: http://www.tiaca.org/images/TIACA/PDF/. The final step of the decision-making process consists of determining the actual winning option. AFETAS determines the winner randomly, based on the propensity of each fuzzy value of the final output.
In case of a deterministic situation, the option with the highest output fuzzy value should be the one chosen. In case of a deterministic situation, the choice would always be for the highest, even the difference would be very low. Each position is calculated as the sum of the trends of the previous positions, so the first position is equal to the trend of option 0, the second position is equal to the sum of the trend of option 0 and option 1, and so on. and so on.