The main problem with this social welfare function is that it is not immutable to the positive linear transformation of the utility function. The sum of the WTAs for all sample households represents the total number of households in the country. If xjt is the real income per capita of the jth household in year t, then the average income of all individuals in the country in year t can be estimated as:
Using the identity (17) again in (15), it is easy to show that the pro-poor growth rate of per capita labor income is also related to the pro-poor growth rates of the same four labor market characteristics in an additive manner asix . Subtracting (18) from (19), we obtain a decomposition of the growth rate of inequality in total income with respect to the four factors as
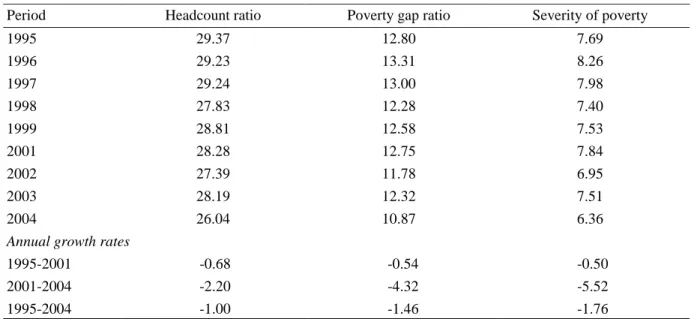
TRENDS IN GROWTH, INEQUALITY AND POVERTY
There were gains in growth rates equivalent to 4.42 percent per year due to falling inequality in the 2000s. This indicates that the positive impact of the rising minimum wage on poverty reduction could have been mitigated by rising unemployment in the 1990s. More importantly, the negative growth during the period was pro-poor in the sense that the poor made positive gains in their incomes despite average incomes falling.

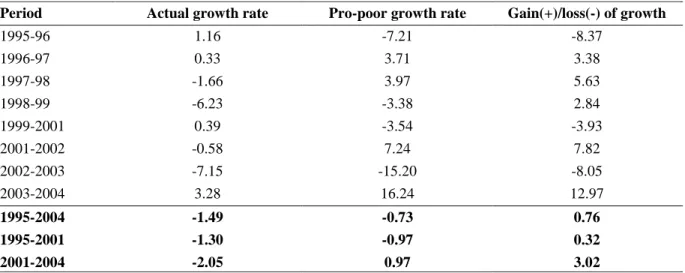
PATTERNS OF PRO-POOR GROWTH
Changes in non-labor income are in sharp contrast to those in labor income. Per capita non-labor income grew at an annual rate of 2.64 percent between 1995 and 2004, the growth rate being much slower in the second period. In view of the pro-poor growth, non-labor income performed even better than the actual growth.
Interestingly, when non-labour income is adjusted for inequality, the growth rate for the second period becomes much higher than for the first period. Therefore, the growth of non-labour income in the period 2001-2004 was much more favorable to the poor. More importantly, the large extent to which non-labour income benefits the poor is the factor underlying the fall in inequality during the second period.
It can be clearly seen from Figure 3 that the gap between the pro-poor growth rate and the actual growth rate widened in the second period compared to the first period. In summary, total income growth is much more pro-poor in the second period than in the first period. This is mainly due to non-labor income that the poor benefited proportionally more than the non-poor.
Compared to non-labor income, the imbalance in labor income was quite small during the period.

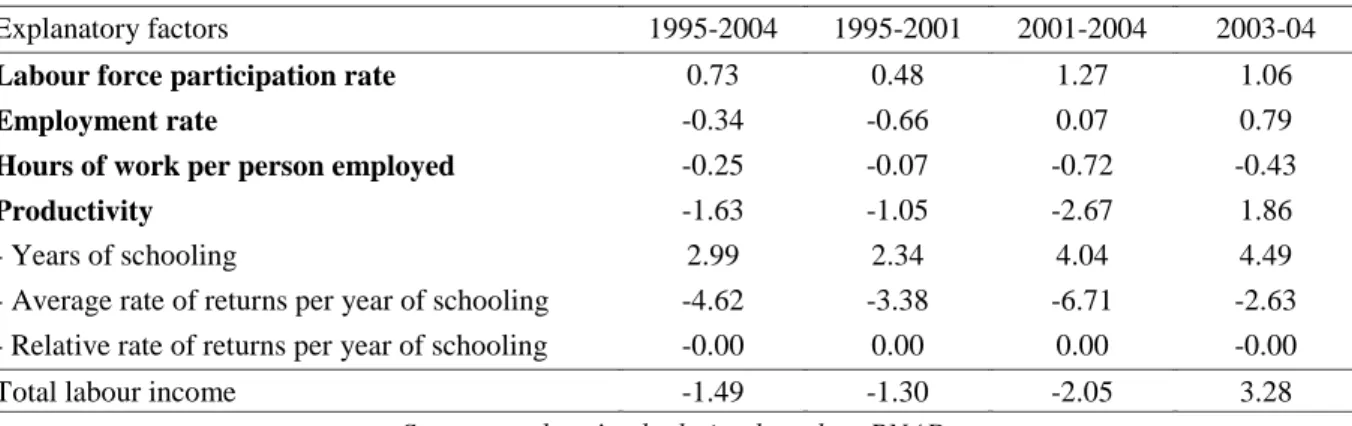
LINKAGES BETWEEN LABOUR MARKET AND PRO-POOR GROWTH xii
Labor force schooling increased at an annual rate of 2.99 percent over the period 1995-04, contributing to an increase in productivity at the same rate (2.99 percent). The expansion of education has been accompanied by a decline in the average return to schooling at an annual rate of 4.62 percent. Again, productivity was the most significant factor contributing to growth, but in this case it contributed to a positive rate of 1.86 percent.
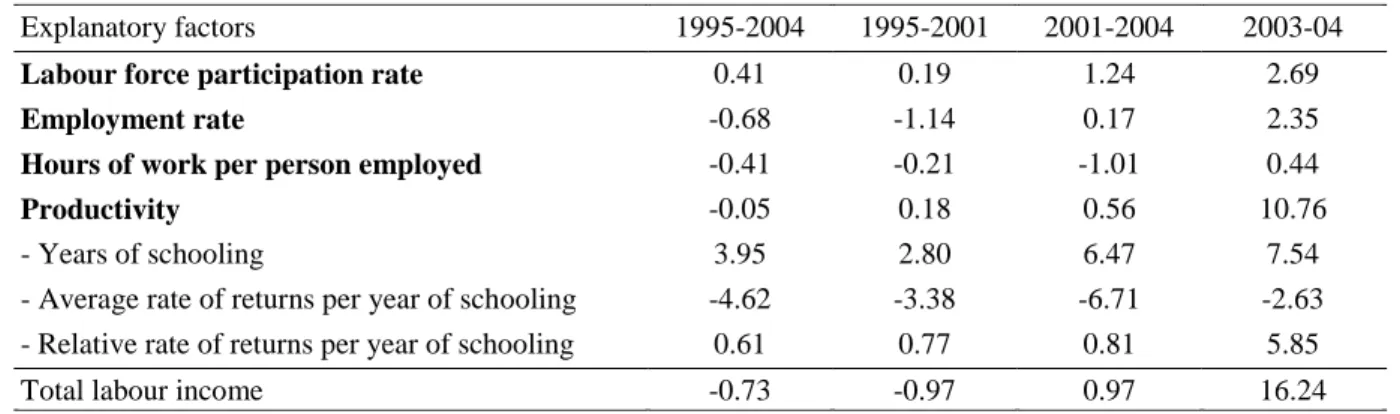
The rate of return to schooling decreased much more slowly, by only 2.63 percent, despite the fact that the number of years of schooling in the labor force increased faster, namely by 4.49 percent. Changes in relative rates of return will not affect the rate of growth of average labor income, but will affect social welfare, which is sensitive to changes in relative distribution. Empirical results show that changes in relative rates of return contributed to an increase in the growth rate of social welfare by 0.81 percentage points.
This is a small contribution compared to the decline in prosperity caused by the average return from training. Labor income strongly favored the poor in the period 2001-2004, contributing to a growth of 3.02 percent. Productivity was the main factor contributing to growth of 8.9 percent.
The relative returns from schooling became very favorable for the poor, which contributed to a growth in the growth rate of 5.85 percentage points.
CONTRIBUTION OF LABOUR AND NON-LABOUR INCOMES TO PRO- POOR GROWTH
In 1995, income from work amounted to 82.1 percent of total income, while the remaining 17.9 percent referred to unemployment. The weight of income from work in social welfare in the initial period 1995 was 83.9 percent, which is even higher than in the case of average total income. Its contribution to the total growth of social welfare in the entire period was -0.60 percent per year, i.e.
Conversely, the share of non-labor income in social welfare growth was 1.33 percent per year, making it an important factor in determining the positive social welfare trend assumed in the period 1995-2004. Likewise, the non-labor income share of pro-poor growth also exceeds its effects on average income growth in both periods. In the period 1995-2001, it was labor income that had a higher contribution to the reduction in inequality: 0.28 and 0.12 percent due to labor and non-labor income, respectively.
In the second period, the increase in growth rate due to a decrease in inequality was 4.42 percent, which is significantly greater than the corresponding figure for the first period. Of the gain of 4.42 percent, 2.20 percent was contributed by the labor income and 2.22 percent by the non-labor income. Thus, the contribution of non-labour income to reducing inequality was slightly higher than that of labor income, despite the fact that the share of labor in total income was much higher than that of non-labour income.
This suggests that non-labor income has been more pro-poor than labor income in the second period.

DECOMPOSING THE CONTRIBUTION OF NON-LABOUR INCOMES
Non-Social Income
Despite negative growth, non-social income contributed to the reduction of inequality over the decade. Nevertheless, the net contribution of non-social income to the overall growth performance was quite small relative to its growth rates.
Social Security Benefits
Other Non-labour Income
According to Table 9, other sources of non-labor income aggregate have grown at an annual rate of 5.77 percent throughout the period 1995-2004, showing very different patterns across sub-periods. They grew by an average of 0.73 percent in the first period, but this growth accelerated significantly in the 2001-2004 period to 13.26 percent, reflecting the expansion of conditional cash transfer programs. The rate of decrease in the inequality of this income component was somewhat reduced in the subsequent period, as shown by the decrease in the magnitude of the increase in the growth rate from 24.77 percent in the period 1995-2001 to 21.95 percent in the period 2001-2004.
This indicates that the impact of remittances became slightly less favorable to the poor in the second period. According to Table 10, the net contribution of income sources other than labor to the reduction of inequality is greater than the contributions of the other two income components. Similarly, the net contribution was 0.37 percent of the decline in inequality over the period 1995-2001, and then increased to 1.84 percent of the decline in inequality.
This indicates that sources of income other than labor are an important determinant of the reduction of inequality in Brazil over the period. The elasticity of the contribution to growth to the poor of a given current transfer relative to its contribution to total growth is useful as a guide for policies targeting the poorest groups in Brazilian society. Each percentage point of the share of government transfers on this item contributed 19.8 times more growth to the poor in other non-labour income than in social security benefits. This result is consistent with the evaluation of conditional money transfers in Brazil and elsewhere (Lindert et al. 2005, Barros 2005, Hoffman 2005, Soares 2006, Bourguignon et al. 2003, Skoufias et al. 2001, Coady et al. 2004, Application 2002).xv.
In sum, sources of income other than labor have played a dominant role in achieving the pro-poor growth pattern in Brazil, while making a small contribution to overall growth and to Brazil's fiscal accounts.
CONCLUSIONS
The Brazilian experience presented in the paper shows that government social policy can play an important role in protecting the poor from external shocks that might otherwise have a devastating impact on the living conditions of the poor. Brazilian Income Distribution in the Sixties: "Facts", Model Results and Controversy, Journal of Development Economics, n.3. Focalização dos Gastos Públicos Sociais e Erradicação da Pobreza no Brasil” In Henriques, R ed., Desigualdade e Pobreza no Brasil.
Paes de Barros, Mercado de Trabalho e Distribuição de Renda: Uma Coletânea, Série de Monografias 35, IPEA: Rio de Janeiro, Brasil. Avaliação ex-ante de programas de transferência condicionada de renda: o caso do Bolsa Escola” Em Bourguignon, F. As transferências não são a principal causa da redução da desigualdade”, Economia 7, no Rio de Janeiro, Brasil.
Redistribuição de Renda aos Pobres e aos Ricos: Transferências Públicas na América Latina e no Caribe", Banco Mundial: Washington D.C. Análise de Sensibilidade da Relação Custo Fiscal/Benefício Social das Modalidades de Ajuste dos Benefícios da Seguridade Social", Boletim Econômico, nº 42, IPEA, Rio de Janeiro, Brasil. Histórias Diferentes em Cidades Diferentes”, In Reis Velloso, J.P. Soluções para a Questão do Emprego, Rio de Janeiro: José Olimpio. Efeitos Difusivos das Reformas Estruturais Brasileiras”, em Baumann, R., eds. 2001), Brasil na década de 1990: uma década em transição, Palgrave - Macmillan's Global Academic Publishing, Reino Unido.
Poverty Lines for Brazil: New Estimates from Empirical Evidence of the Times”, Mimeo IPEA working paper: Rio de Janeiro, Brazil.
Alternative Methodology to Decompose Productivity
This equation gives the contribution of schooling and other unexplained variables to the growth rate of inequality in productivity. The first factor is the change in inequality of years of schooling and the second factor is related to the returns to education. This suggests that years of schooling may be a major factor explaining productivity per capita.
Note that the number of years of schooling varies from one household to another, as it is adjusted for household size. In the per capita table, the years of schooling are shown both for all members and only for employed members of the household. The results show a general increase in the number of years of schooling, but a greater increase for the poor.
Consequently, more years of schooling contributed to a fall in inequality of years of schooling over the period, which is sharper in the second period, 2001-04. The pro-poverty of schooling is much greater in the second period compared to the first period. One is changes in inequality of years of schooling and the other is changes in returns from schooling.
In this context, we look at the returns for each school year in Brazil over 1995-2004.

Subtracting (A.3) from (A.2) gives the contribution of each income component to the inequality of total per capita income.