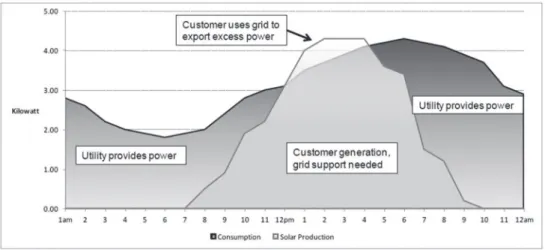
Impact Assessment of Solar Photovoltaic Expansion in the Colombian and Brazilian Residential Sectors. These customers will actually be supplied by the distribution network for most of the day.
Introduction
Concepts and background
Distributed generation
The concept of distributed generation has often been loosely defined and associated with the idea of small-scale electricity generation (Pepermans et al., 2005). In addition, electricity quality and service availability can be affected, as several scattered production plants are connected to the grid (l’abbate et al., 2007; dulău et al., 2014).

Integration and adoption challenges 1. System integration
Economic and regulatory
The integration of distributed generation requires upgrades in the systems as well as in system management processes and operations. Market access lack of transparency about market access procedures disproportionately high entry barriers for spot market trading fees.
Financial issues
This problem can be solved by developing financing options tailored to distributed generation. The distributed generation barriers described provide a broad perspective on the areas where difficulties often arise, hindering their spread.
Innovation and development
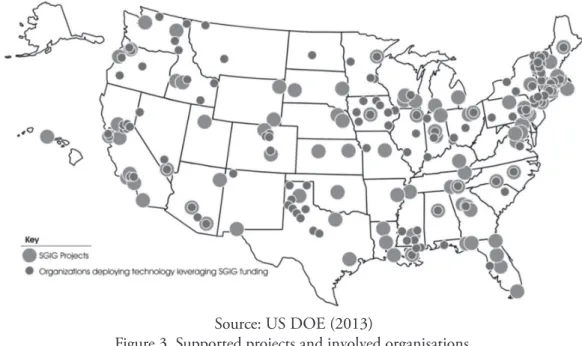
The United States Recovery Act Smart Grids Programs
The areas of development targeted smart grid technologies and processes, development of flexibility capabilities, interoperability, functionality, cyber security, situational awareness and operational efficiency (us doe, 2017). The program described is an example of the efforts that the US Department of Energy has initiated with regard to grid modernization and transformation of electric power systems (us doe, 2017b).
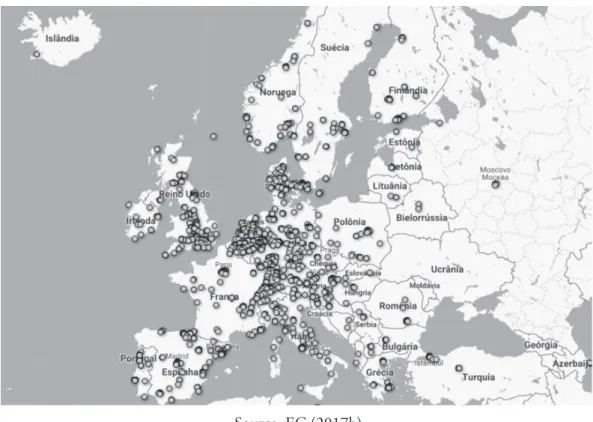
The European Electricity Grid Initiative (EEGI)
For an overview of the EU's overall progress in smart grid innovation, the European Union Joint Research Center contributes to the identification of smart grid research and development and demonstration efforts through its Smart Grid Monitoring reports (Catalin et al., 2014; Gangale, Vasiljevska, Covrig, Mengolini and Fulli, 2017). This new entity brings together eeGi's energy transition delivery efforts for electric grids by driving efforts towards: a reliable, economical and efficient smart grid; storage technologies and sector interface; flexible generation; digitization of network infrastructure and customer engagement; and innovation in the business environment (etip sNet, 2017).
Conclusion
Acknowledgements
Most of these are microgeneration systems - the average size of the solar installations is eight kWp. This phenomenon can lead to a theoretical result known as the “death spiral” of the distribution tools (Costello & . HeMpHill, 2014).

Summary
The impacts of photovoltaic distributed generation on distribution companies and non-solar consumers - problem’s description
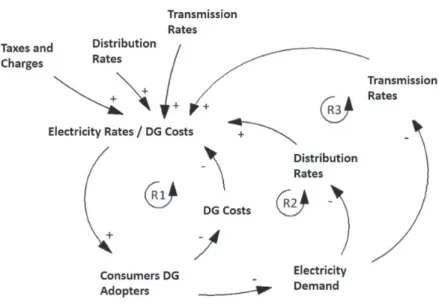
In short, the financial impact of dGpV on utilities and ratepayers is therefore strongly associated with the reduction in retail electricity sales (barbose et al., 2016). However, total costs to be recovered by the dso through distribution tariffs remain almost the same, as large network costs are fixed as they are not closely related to the level of sales (bird et al., 2013).

A discussion of mitigation measures
Alternative tariff structures
The rationale behind adopting this type of rate structure is that most of the distribution costs are fixed in the short term. The results found in each of them are closely related to the assumptions regarding the size of the fixed charge and whether the charge is associated with a corresponding reduction in volumetric charges.
Case studies 1. The Italian case
The capacity and energy costs are expected to cover the costs of the network. Changes in the tariff structure to mitigate the passing on of costs are therefore necessary, given the need to impose on consumers the costs they impose on the grid.

This may happen as the reduction in the cost of solar pV sparks the adoption of solar pV panels by households (Castaneda et al., 2016); this, combined with learning curve effects, reduces the costs of solar PVs, driving PV adoption. The death spiral of utilities has motivated reforms in electricity markets; for example, changing the cost structures of distribution network operators and redesigning network tariffs (pérez-arriaga et al., 2013).
Simulation model
Households” is the unit of analysis used to measure populations of potential adopters and adopters, as a solar PV system is usually owned by one family. Here Dt is the distribution charge, DNC is the costs of the distribution network, Evt is the electricity demand per voltage level, EM is the electricity demand of PV users, AND is the electricity demand of non-PV users, Z is the average energy consumption per household, and S is the microgeneration per households.

Application cases
Colombia
Brazil
Credits are valid for up to five years; in addition, the electricity drawn from the grid is paid according to the applicable electricity tariff (aneel, 2015). Efforts by the Brazilian government to exploit the true potential of distributed solar energy are evidenced by other legislation such as the iCM tax exemption, pis and CoFiNs for net metered solar pV systems (epe, 2012).
Results
Large-scale deployment of solar PV provokes the highest residential tariff, because grid costs are spread over a shrinking energy consumption until 2035 – as total solar PV production minus total energy consumption falls dramatically in the sector housing for this hypothetical case (Castaneda et al., 2017). However, there may be an incentive if PV adopters with some features decide to take advantage of virtual net metering.

Conclusions
Medium to long-term consequences of the death spiral include sales declines due to greater PV adoption and greater revenue losses for utilities. Medium to long-term consequences of the death spiral for the incumbent electricity distribution industry include sales declines due to increased PV adoption and greater revenue losses for utilities.
Advantages and Disadvantages of the NEM Rate Structure
Benefits offered by NEM
Fourth, rooftop solar PV installations reduce solar gain, reducing the need for air conditioning and potentially increasing the need for heating. Finally, distributed solar installations can reduce carbon emissions, to the extent that this energy production replaces fossil fuel production.
Challenges posed by NEM
Case Study: Controversy and Policy in Nevada
The trajectory of the solar industry in Nevada was further accelerated by the state's ambitious economic diversification efforts in addition to environmental goals. The tariff included three components: a basic service charge, which is a fixed charge that the NeM customer pays regardless of the level of consumption; a volumetric charge that increases with the kilowatt-hours consumed; and the compensation rate that the utility pays to the NeM customer for the exported electricity.
GAPS IN AVAILABLE ANALYTICAL RESULTS
Conclusion
Controversy surrounding efforts to change and rationalize policies to compensate owners of distributed generation capacity has been prominent in Nevada in recent years, but elements of Nevada's experience are shared by regulators and policymakers in most states in the United States. Growing adoption of time-of-use meters and the expected adoption of smart-grid technology will generate rich databases to support the detailed analyzes needed to fully understand the impacts of distributed generation on utility costs, carbon emissions, water use, sensitive ecosystems and other environmental properties.
Tables and Figures
Tables and Figures
Bibliography
Finally, we revisit the previous theoretical questions in the light of the specific development of DG in Brazil. Therefore, it is particularly important to recognize the current challenges in the sector and understand how bM innovations can successfully contribute to the pursuit of the country's goals, namely in terms of market enablement, sustainability, efficiency, flexibility, resilience and reliability of the Brazilian electricity system.
Distributed electricity generation: an overview of recent developments and trends
This fact is illustrated in the figure below which shows the lCoe for utility scale power (range and averages). This may not be easy to achieve, both in the short term (where effective price signals can result in overly complex dynamic pricing schedules) and in the long term (where the incentives to invest in back-up capacity are almost non-existent). ).

New business model configurations in the era of distributed energy
Our research includes some keywords "Energy, power, electricity, renewable and ." and "Business Model" in the title. Utilities: Financial-Economic Sustainability in the Age of DG4.1 The DG's Threat to the Conventional BM of the Utilities.

Utilities: financial-economic sustainability in the era of DG 1 The DG threat to the utilities’ conventional BM
- New business opportunities for utilities
- Regulatory innovation envisaging utilities’ financial-economic stability The utilities’ financial-economic sustainability constitutes a key aspect in the de-
In addition, utilities are also beginning to learn (and in some cases are actually deeply involved) in the creation and deployment of innovative DG technologies and solutions. Managers are also concerned (to a somewhat lesser extent) with the regulatory specification of the role of public services regarding permits and authorizations of distributed energy, the introduction of innovative technologies in the network and the use of response to consumption for network optimization/.
Case Study - Brazil
This is quite far from the country's full potential, representing only 0.15% of Brazil's electricity capacity. The dynamism of the pV solar industry is shown in the number of companies participating in the sector today (despite the economic crisis in Brazil).

Conclusions and Future Research
Finally, we wanted to illustrate all these things in the specific case of the Brazilian electricity system, where dG is still in a relatively early stage, but the growth potential is huge, taking into account the natural conditions of the countries for solar PV. For example, postponing investments in the network is generally seen as an advantage of the spread of decentralized generation.
Characterization of the electricity sector
Usually, the proliferation of the distributed solar photovoltaic generation is considered to be beneficial to the electricity system. This paper describes the potential impacts that Brazil may see as a result of the large-scale uptake of distributed photovoltaic generation.
Impacts of photovoltaic diffusion on the Brazilian electricity sector 1. Avoided generation costs
- Postponement of investment in new power plants
- Postponement of investments in transmission and distribution
- Need for investments in distribution networks
- Cross-subsidies, cost shift and commercial losses
- Impacts on energy trading contracts
- Environmental impacts of distributed photovoltaic diffusion
- Diversification of the Brazilian energy matrix
- Duck curve and system flexibility
- Ancillary services
This table also reflects the evolution of the participation of these sources in the production of electricity in the country. The first is the reduced net load during the day, also called generation risk.

Conclusions
The first is to assume that this dispersion does not affect the supply of auxiliary services. When estimating the avoided costs of production of the solar cell source, it is estimated that the avoided costs of future auxiliary services will be in the same ratio (e3, 2013).
The next chapter will examine the political dispute surrounding the implementation and reform of the Renewable Energy Sources Act (Germany's main incentive policy) in order to shed light on the political dispute over the way in which the electricity sector should be transformed. The next chapter will examine the political struggle surrounding the implementation and reform of the Renewable Energy Sources Act (Germany's main incentive policy) in order to shed light on the political dispute over the manner in which the electricity sector should be transformed.