À medida que a geração de energia aumenta mais perto do consumidor final, é mais provável que ocorram problemas de sobretensão nos barramentos da rede de teste, especialmente nos barramentos mais distantes do transformador. O objetivo desta dissertação de mestrado é testar três estratégias de mitigação de sobretensões em um cenário de alta penetração fotovoltaica em uma rede de baixa tensão desequilibrada com 55 barras. Ao optar por um corte total de energia, todos os problemas de sobretensão deixam de existir.
A técnica híbrida combina as vantagens e os pontos fortes das duas técnicas anteriores, o que parece ser a melhor estratégia para lidar com problemas de sobretensão na rede de baixa tensão.
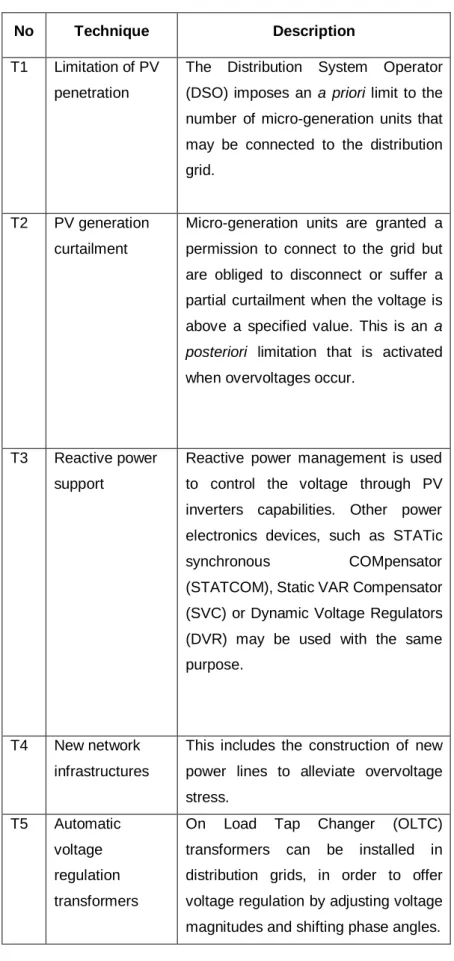
The general main objective of this Master's thesis is to present a study of the impact of the integration of micro-generation from renewable sources, namely PV, into the LV distribution network. In the 1st chapter there is a short introduction to the topic, a general overview of the discussed issues. Here, an overview of the state of the art regarding overvoltage correction strategies during a high PV penetration scenario in the LV grid is presented.
In the first one, it is possible to find the calculation method behind the modeling of the LV test grid - showing how the three-phase power flow can be calculated.
Lewis, “Analysis and Management of the Impact of High Penetration of Photovoltaic Systems in an Electricity Distribution Network,” in 2011 IEEE PES Innovative Smart Grid Technologies Asia (ISGT), Perth, WA, 2011. Vittal, “The Impact of Distributed Photovoltaic generation on residential distribution systems," in 2012 North American Power Symposium (NAPS), Champaign, IL, 2012. Maksimovic, "Active power control of photovoltaic power systems," in 2013 1st IEEE Conference on Technologies for Sustainability (SusTech), Portland, 2013 .
Rodriguez, “Evaluation of the Voltage Support Strategies for the Low Voltage Grid Connected PV Generators”, 2010 IEEE Energy Conversion Congress and Exposition (ECCE), Atlanta, GA, 2010. Pipattanasomporn, “Local Control of Distribution Voltage with Reactive Power Injection from PV Inverters , improved by limiting working power,” in 2014 IEEE PES Assembly | Conference. Ghosh, “Surge and Overload Prevention Using Coordinated Photovoltaic Converters in the Distribution Grid,” in IEEE Industrial Electronics Society 40th Annual Conference (IECON 2014), Dallas, 2014.
Nasiruzzaman, “Voltage Control of Distributed Generation Distribution Networks Using Reactive Power Compensation,” in IEEE Industrial Electronics Society 37th Annual Conference (IECON 2011), Melbourne, VIC, 2011. Pahwa, “Reactive Power and Voltage Regulation in Photovoltaic Distribution Systems generation," at the 2012 North American Power Symposium (NAPS), Champaign, IL, 2012. Østergaard, "Voltage Unbalance Reduction in LV Grids Using Three-Phase PV Systems," at the International Conference on Industrial Technology (ICIT), Seville, 2015 .
Topolanek, “Optimization of voltage regulation in the low voltage network based on the Voltage Quality Index”, in Proceedings of the 2014 International Scientific Conference on Electric Power Engineering (EPE), Brno, 2014. Ochoa, “Voltage control in LV grids: An initial investigation ,” in 2014 IEEE PES Innovative Smart Grid Technologies Conference Europe (ISGT-Europe), Istanbul, 2014. Geurin, “Deployment of energy storage coordinated with smart PV inverters,” in 2012 IEEE PES Innovative Smart Grid Technologies (ISGT), Washington, 2012.
Blazic, “Energy storage options for voltage support in low-voltage grids with high penetration of photovoltaics,” in 3rd IEEE PES International Conference and Exhibition on Innovative Smart Grid Technologies (ISGT Europe), Berlin, 2012.
System Description
Theoretical Framework
The study of three-phase unbalanced load flow methodology has been hotly debated in recent years. With the main objective of the study and comparison of the results between the three tested methods to mitigate the overvoltage, an existing model of unbalanced radial power flow of the three-phase distribution network is used and further presented in the study. There are three main variants of the well-known backward/forward sweep method that have their differences in the type of electrical quantities that, in each iteration, are calculated starting from the end nodes towards the source node, in the backward sweep.
The basis of energy flow equation modeling for a three-phase LV distribution network is based on Kirchhoff's laws. The Forward sweep technique, which works in the opposite direction, with the aim of calculating the voltage at each load node and the voltage drop in each branch, via Ohm's law. The forward sweep is responsible for updating the node voltages, starting at the source node towards the terminal buses, using the previously acquired complex powers.
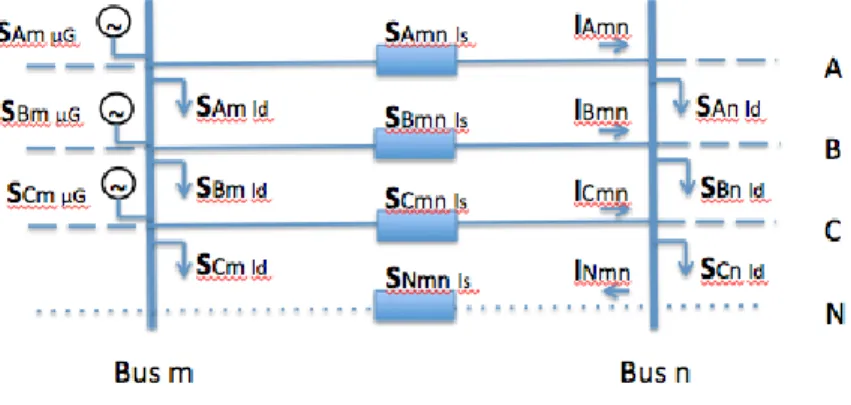
In terms of the small-scale example below, the power injected into bus m must be equal to the sum of the power injected into bus n, 𝑆𝜓𝑛, taking into account the power injected into the grid by the microgenerators - the negative signal refers to the fact that power is being injected into the network – as well as the inherent line power losses between buses m and n. The last term of the equation appears with a negative sign assuming that the current flows in the opposite direction in the neutral (N) line. At this moment, the new voltage values are calculated in the opposite direction, from the feeder bus to the end buses of the distribution network.
The complex powers calculated in the previous step are used, plus the reference voltage value provided by the service transformer bus. In the preceding equations 6 and 7, the main focus is on the calculation of the phase current in bus n - - and the neutral-to-neutral current in bus n.
Simulation Conditions
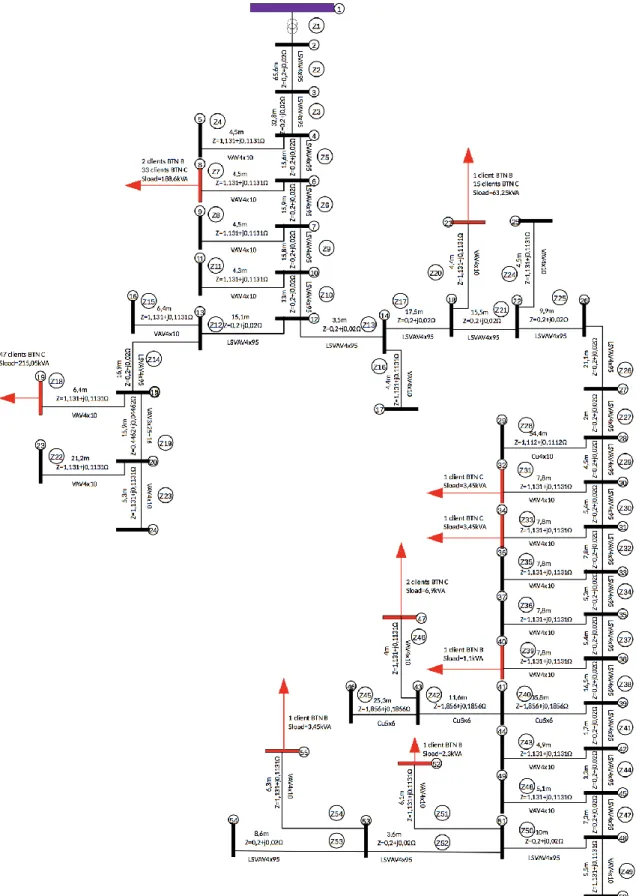
The LV distribution network is equipped with an MV/LV transformer, near the substation, characterized by a delta connection type in the primary windings and star type with earthing in the secondary, with a transformation ratio of 15kV to 0.4kV. The cables that make up the test distribution network in the study have their characteristics shown in the following table 1. It is important to highlight that according to Legislative Decree No. 153/2014 of October 20, Article 5, b), it states that the connection effect of the production unit must be equal to or less than the agreed effect in the energy supply contract.
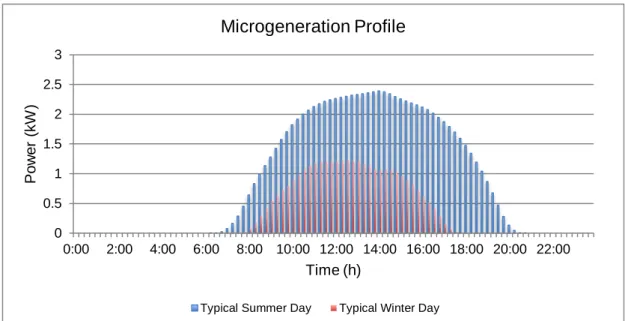
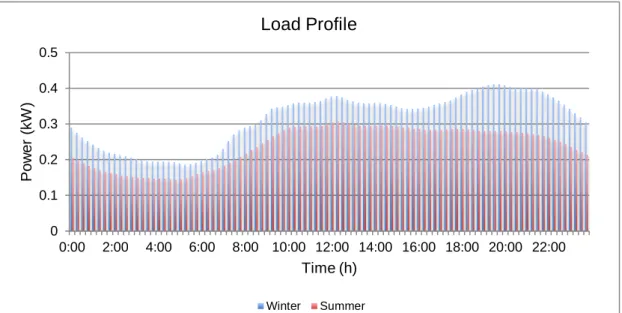
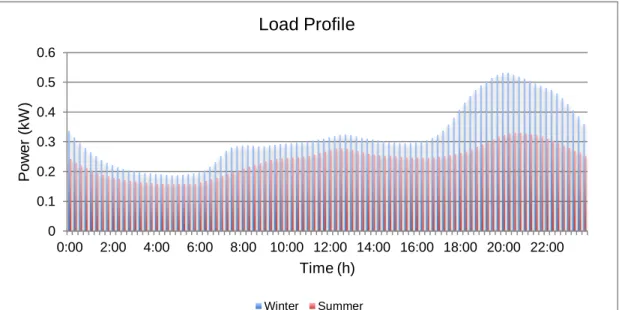
The proposed MATLAB algorithm was developed and programmed by Fernando Camilo in the scope of his PhD thesis and tested on the above network in order to handle overvoltage issues through mitigation strategies. On the other hand, the peak of daily consumption is located early in the morning and in the evening, where the production is at the lowest level or close to zero. Through a careful analysis of the TU distribution network, buses with a larger number of customers connected to their different phases, in addition to an uneven phase distribution and half-moon distances to the transformer, are facing a problematic scenario, more likely to cause imbalance. on the network.
This fact increases the generated power, possibly even reversing power flow, and contributes to increasing the chances of an overvoltage problem in the network. In outdoor tests, these standard test conditions are not possible to have in practice, with temperature and radiation in constant change, leading to a variation in the standard expected values. To have an overview of the studied distribution network and to analyze the generation and load curves in the same diagram, Figure 7 is addressed as an example.
In the afternoon, due to high sun exposure and temperature, a higher power output is achieved, creating a surplus of generated power. But mainly in the afternoon, the households are characterized by having low requirements, which end up in surplus electricity, which can be sold and injected into the grid again or can be stored in batteries and used later, in periods when the consumer load is high and produced electricity is lacking.
Results & Analysis
In the previous example, from 8:15 to 19:30, it is possible to observe some overvoltage situations on these specific buses of the unbalanced LV test network. In case of a partial power outage, it is possible to minimize those losses to a minimum value. The APC technique with a total PV power outage proves itself as an efficient strategy in correcting overvoltage problems in an unbalanced radial network.
In the same way, it is also associated with a loss of energy and profit in the eyes of the producer. In fact, in Figure 18 it is possible to observe that a curtailment of 45% of the produced PV energy is enough to keep the voltage in the entire network below the statutory limits. After applying active power limitation in the previous section, reactive power benefits are tested in the LV network with embedded PV integration.
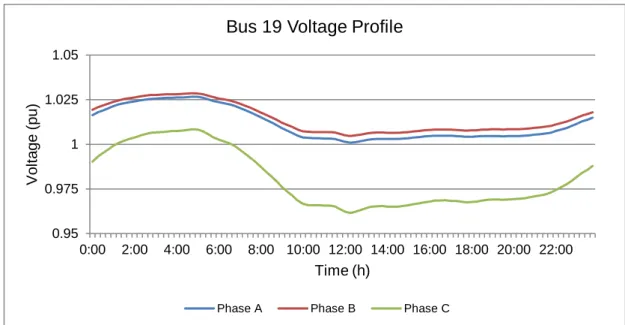
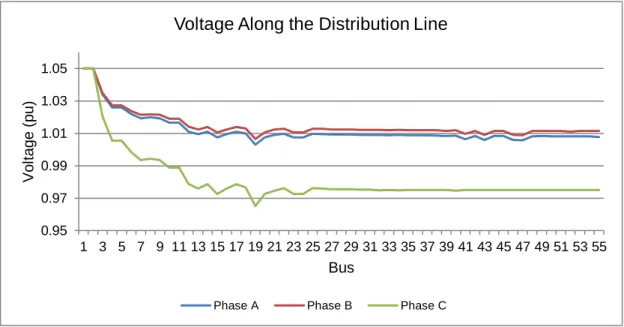
The analysis of reactive power support performance starts with the exhibition of bus 19 voltage profile, in Figure 19, characterized by the lack of PV microgeneration integration in the LV network. In the following Figure 21, a voltage profile example with PV integration in the grid is represented in blue, while the same busbar with a corrective strategy based on Reactive power support is depicted in red. To help visualize the marginal improvements of reactive power support, Figure 24 compares Bus 19 voltage profile with and without reactive power technique, after PV integration in the LV grid.
Despite the positive effects of reactive power support observed in figure 24 above, the objective of keeping the voltage profile values within its legal limits and ensuring the normal operation requirements of the TU network is not achieved by resorting only to the Reactive Power technique . Figure 26 below presents a perfect summary of the solutions studied to address overvoltage issues in the distribution network and helps realize the efforts of each strategy to minimize the impacts of the TU network. As the microgeneration is penetrating the grid, approximately starting at 8 am, numerous cases of overvoltage are recorded in the LV grid (when the Phase A curve, represented in blue, crosses the threshold).
In the recorded examples above, it is possible to understand the main weaknesses and strengths of the proposed surge correction strategies.
Conclusion