I NTRODUCTION
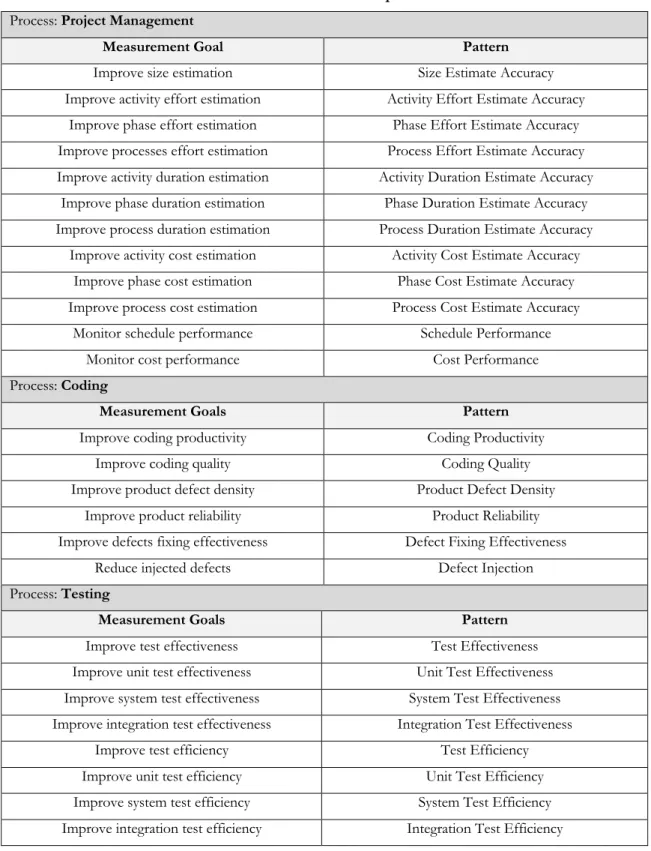
MePPLa has 28 patterns: 12 related to the Project Management Process, 6 to the Coding Process and 10 to the Testing Process. Improve activity effort estimation Activity Effort Estimation Accuracy Improve phase effort estimation Phase Effort Estimation Accuracy Improve processes effort estimation Process Effort Estimation Accuracy Improve activity duration estimation Activity Duration Estimation Accuracy. Improve phase duration estimation Phase Duration Estimation Accuracy Improve process duration estimation Process Duration Estimation Accuracy.
Improving activity cost estimation Activity cost estimation accuracy Improving phase cost estimation Accuracy of phase cost estimation Improving process cost estimation Accuracy of process cost estimation. Improving Unit Test Effectiveness Unit Test Effectiveness Improving System Test Effectiveness System Test Effectiveness Improving Integration Test Effectiveness Integration Test Effectiveness. Improve Test Prep Productivity Test Prep Productivity Improve Test Prep Efficiency Test Prep Efficiency.
Thus, new patterns can be added, new relationships identified, and new processes addressed in the future. Chapter 3 will present behavioral models, and Chapter 4 will provide a detailed description of each model.
M E PPL A S TRUCTURAL M ODEL
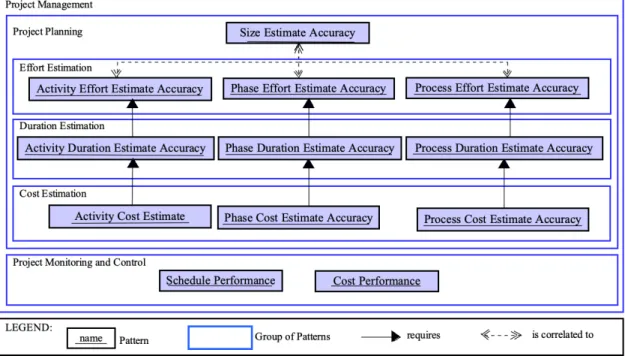
The structural model of the Project Management process consists of two subgroups, one related to the Project Planning subprocess and the other related to the Project Monitoring and Control subprocess. In the Project Planning group, there are subgroups for patterns related to effort estimates, duration estimates, and cost estimates. There are dependency relationships between patterns associated with estimates of cost and duration, as well as between patterns associated with estimates of duration and effort.
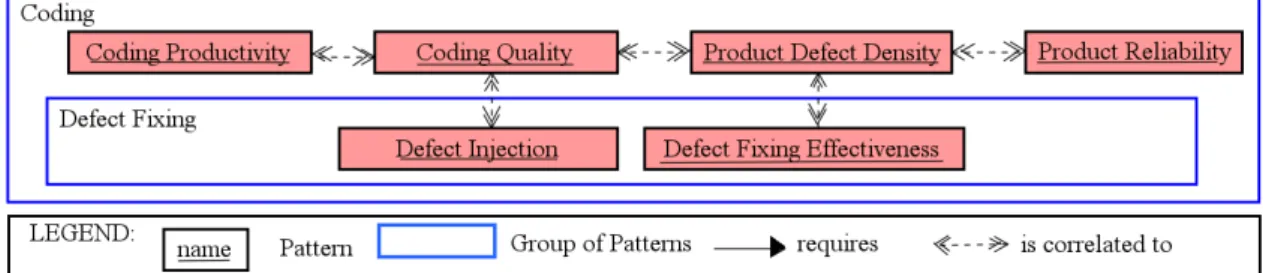
For example, activity effort estimation accuracy is correlated to size estimation accuracy because, although effort and size are related, in some contexts it is possible to apply the former pattern without having applied the latter. For example, the product defect density pattern is correlated to the coding quality pattern, since the quality of the coding process can affect the quality of the product (a poor quality process should result in a poor quality product), but using the product defect density pattern does not depend on the coding quality pattern (so there is no dependency relationship between them). Similar to patterns related to encoding, there are only correlations between patterns related to tests.
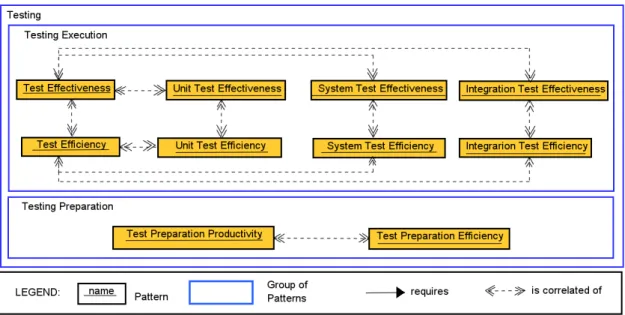
For example, Test Efficiency is correlated with Test Efficiency, as improvements in the efficiency of the tests can have an impact on their effectiveness (more efficient tests may require more effort). The structural model related to Tests has two subgroups, one related to the Test Preparation sub-process, which refers to the preparation of procedures or test cases, and the other related to the Test Execution sub-process, which deals with aspects related to the test execution itself.
M E PPL A B EHAVIORAL M ODEL
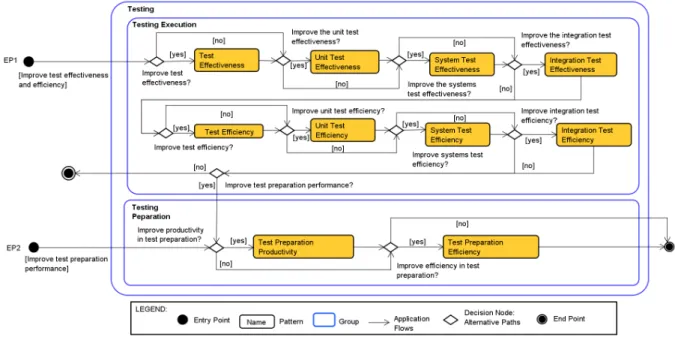
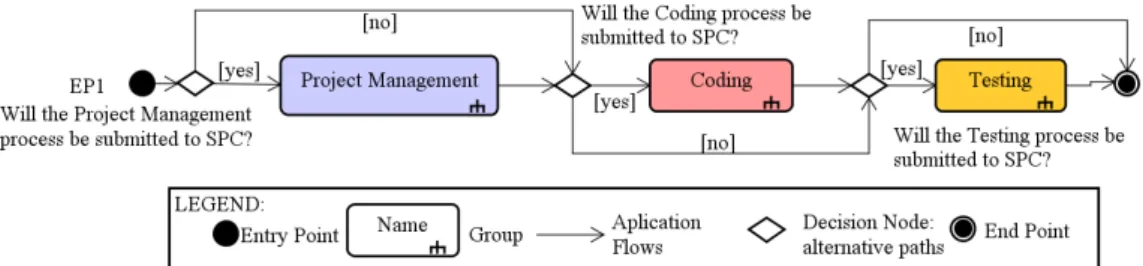
The behavioral model has two formats: the black box format, which provides the general overview of the pattern language, and the detailed format, which provides the detailed behavioral overview of the pattern language, containing the flows that guide the pattern application. The black box format consists of groups and decision nodes that must be followed by the user from the starting point to the ending point. In addition to the structural model, the patterns are grouped according to the processes and subprocesses to which they relate.
For each process group, subgroups are used to group patterns related to sub-processes. It is important to note that the behavioral model is consistent with the structural model, so both have the same groups, subgroups, and patterns. For example, in the behavioral model related to project management, the flow allows the use of the cost estimation accuracy model only if the duration estimation accuracy model has been used before, since there is a dependency relationship between these models in the structural model of Project Management.
The user must follow the flows in the behavioral model until an end point is reached. Figures 5, 6, and 7 present the behavioral model of the Project Management, Coding, and Testing groups, respectively.
M EASUREMENT P LANNING P ATTERNS
Project Management Group
Measurement Procedure Calculate the accuracy of the estimate of the activity effort using the formula for calculating the measure. Measurement Procedure Calculate the accuracy of the phase effort estimate using the formula for calculating the measure. Measurement Procedure Calculate the accuracy of the process effort estimate using the formula for calculating the measure.
Measurement Procedure Calculate the activity duration estimation accuracy using the formula for calculating the measure. Description Measure that quantifies the estimated duration of the activity up to the moment of measurement. Measurement Procedure Calculate the phase duration estimation accuracy using the formula for calculating the measure.
Description Measure used to quantify the process duration estimation accuracy, which is given by the ratio between process actual duration and the estimated duration of the process. Measurement Procedure Calculate the process duration estimation accuracy using the formula for calculating the measure. Description Measure used to quantify the accuracy of the activity cost estimate, which is given by the ratio between activity actual cost and the estimated cost of the activity.
Measurement Process Calculate the accuracy of the activity cost estimate using the measure calculation formula. Measurement Procedure Calculate the phase accuracy of the cost estimate using the measurement formula. Measurement process Get the actual costs for the work done in the project up to a certain point in time.
Coding Group
Moment of measurement <
Measurement Procedure Get the <
Procedure <
Description Metric that quantifies the number of errors reported by the customer with reference to the delivered product. Measurement Procedure Obtain the number of reported failures by the customer with reference to the delivered product. Description Measure used to quantify the efficiency of fixing defects, which is given by the ratio between the number of fixed defects and the number of detected defects.
Description Measure used to quantify the rate of injected defects due to previously detected repair defects, which is given by the ratio of the number of defects injected into a product to the product size. Measurement Procedure Obtain the number of defects injected into the product due to previously detected repair defects. Measurement Procedure Obtain the <
Tests Group
Description A measure used to quantify the density of defects found during a unit test, given by the ratio of the number of defects found in a unit test to the size of the product under test. Measurement Procedure Calculate the delivered defect density in a unit test using the formula for calculating the measure, considering the same product (or part of a product) for both base measures of the formula. Description A measure used to quantify the density of defects detected during a system test, given by the ratio of the number of defects detected in a system test to the size of the product under test.
Calculate the density of delivered defects in the system test using the sizing formula, considering the same product (or part of the product) for both basic measurements of the formula. Description Metric used to quantify the density of defects detected during the integration test. This is determined by the ratio between the number of defects detected in the integration test and the size of the product tested. Measurement procedure Calculate the detected defect density detected in the integration test using the size calculation formula.
Measurement Procedure Calculate the delivered error density in the integration test using the formula for calculating the measure, considering the same product (or part of the product) for both base measures of the formula. Description A measure used to quantify the performance of a test, given by the ratio of the effort expended in detecting defects to the number of defects detected in the test. Metrics: Unit test performance, Number of unit test bugs detected, Unit testing effort.
Description Metric used to quantify unit test effectiveness, which is given by the ratio of unit test effort to the number of defects detected in the unit test. Objectives: System test efficiency, number of detected defects in the system test, system test effort. Description Measure that quantifies the effort used to detect errors in the system test.
Objectives: Integration test efficiency, number of detected defects in the integration test, integration test effort. Description Measure used to quantify the efficiency of the integration test, which is given by the ratio of the effort in the integration test to the number of defects detected in the integration test. Description Measure that quantifies the effort spent on detecting defects in the integration test.
Description Measure that quantifies the number of test cases elaborated in the preparation of the test. Measurement procedure Get the number of test cases detailed in the preparation of the test.
R EFERENCES