The performance of the proposed system is not discussed if the amount of data increases. However, the authors do not explore the combined prediction and dimensionality reduction of the data (since satellite images require more computing space compared to text data). However, the authors do not detail how the parametric variation of the forecast model affects the results.
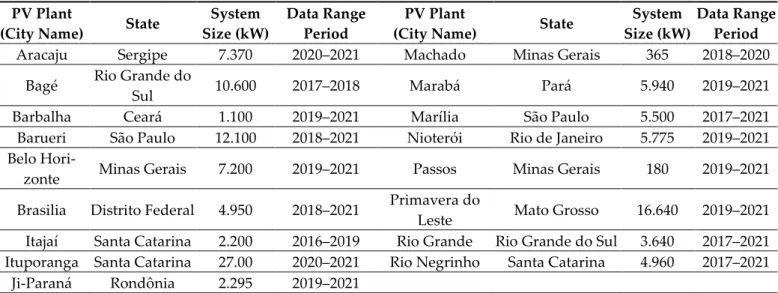
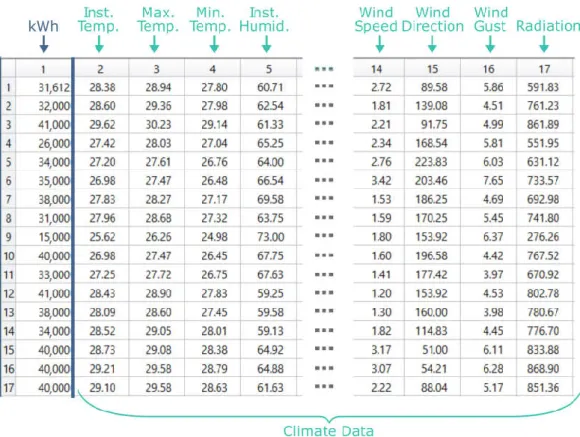
The data in this study are not subjected to dimensionality reduction and the parametric configuration of the models is not detailed. The reason for choosing these units was due to the availability and quality of data in the time horizon of the study. The standardization calculation is performed according to Equation (2), where “ ” is the observed value, “μ” is the mean, and “σ” is the standard deviation.
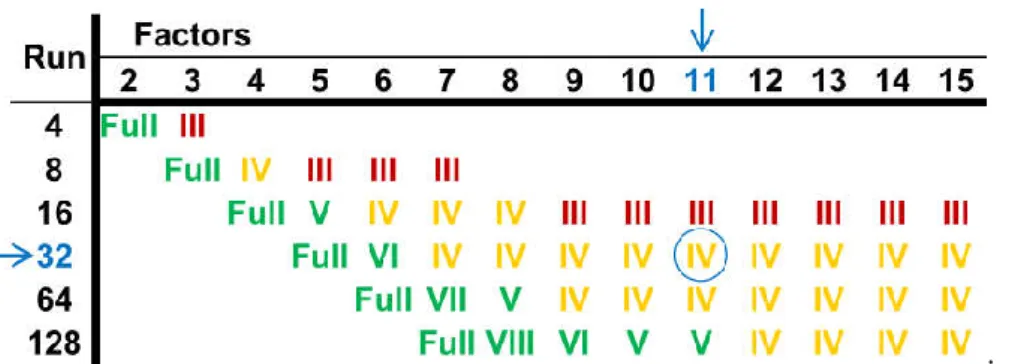
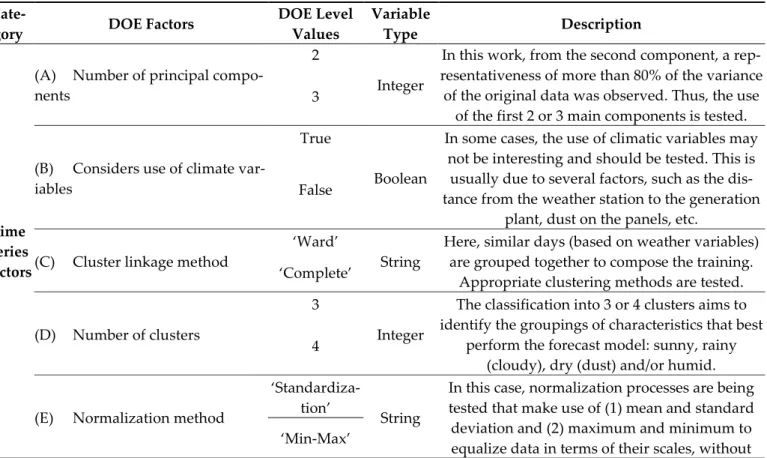
The representation of the variance of the data tends to be in the first components. where the first component has the maximum explanation compared to the other components [52] and so on). It is noted in the literature, an extensive record of the use of DOE, such as for parametric calibration of prediction models [68], selecting the training set [69] and also applied parameter optimization in manufacturing simulations [70]. Although there is no definition of optimal neural network architecture, this work considers the definition of the number of neurons in the intermediate layer based on the following formula: (K. Here, the value of K is associated with. the levels of this factor.
The learning rate determines the step size the model takes in the search space.
Case Study
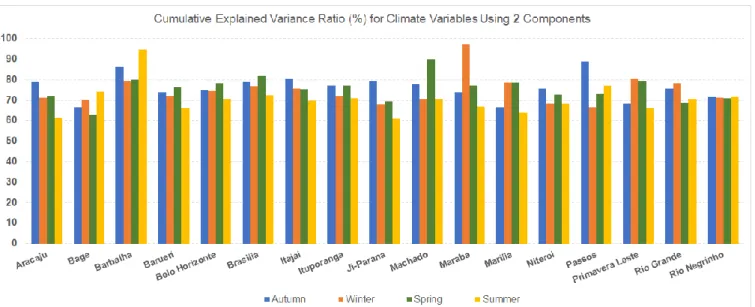
Overview of percentage representation of variance of climate variables considering two main components. When three components are considered, a natural increase in the explanation of the variance of the climate variables is perceived, which is shown in figure 11. Overview of the percentage representation of the variance of the climate variables considering the three main components.
This process was considered because it is believed that each season has its own characteristics that can affect energy production. Thus, the average MAPE for each season of the year is included in Table 5 for all the experimental series defined above. Considering the average MAPE for each season of the year as a response to DOE, the main effects of this implementation can be identified.
Autumn was the only season of the year that differed from operational expectations in terms of the use of climate variables. The other parameters have little influence on the forecast error in relation to this season of the year. As in other seasons, the normalization method was kept as 'minMax' as indicated to reduce the error.
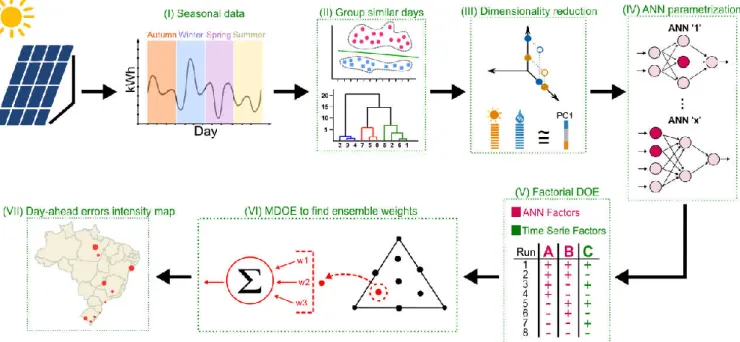
As expected from this investigation, most of the results show that the use of climate variables, with at least three main components in dimensionality reduction, contributes to the reduction of forecast error. The motivation for the combination is to produce more accurate results than the best forecasting components, considered individually. Thus, the combination of forecast results used the Mixture DOE statistical tool to find the ideal weights so that the ensemble could be formed.
In the case of the forecast related to autumn, shown in Figure 13A, the results belonging to the '7' group were selected, which were three elements. Thus, the formation of mixture DOE is a function of the number of elements (factors or ingredients) to be combined. From this perspective, Figure 14 presents the representation of the ideal point for a combination of forecasts for each season of the year except spring (which has five weights).
This phenomenon is also observed during the calculation of RMSE, which penalizes higher errors in its metric. The highest numerically observed MAPE values were 28.4% (autumn-Bagé) and 23.6% (summer-Rio Negrinho).
Conclusions
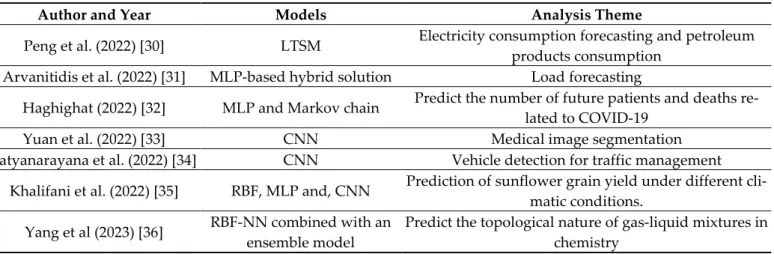
Application of extreme learning machine for short-term output power prediction of three grid-connected PV systems. Deep Learning-Based Surface Irradiance Mapping Model for Solar PV Power Forecasting Using Sky Image. Time Series Forecasting for Hourly Photovoltaic Power Using Conditional Generative Adversarial Network and Bi-LSTM.
A new integrated photovoltaic power forecasting model based on variational mode decomposition and CNN-BiGRU considering meteorological variables. An approach for day-ahead photovoltaic power range forecasting: A new quantile regression modeling method based on DCGAN and LSTM. Low smoothing and random forest-based GRU model: A short-term forecasting method of photovoltaic energy production.
Very short-term prediction: different classification methods of all-sky camera images for detection of sudden variations in PV power. The effect of the normalization method used in different sample sizes on the success of an artificial neural network model. Energy production forecast from solar photovoltaic power plants based on meteorological parameters for the Qassim region, Saudi Arabia.
Combining machine learning techniques with Kappa-Kendall indexes for robust hard cluster assessment in substation pattern matching. A new method for detecting serial arc faults in photovoltaic systems based on blind-source separation. Analysis of potential tourism behavior using PCA and modified affinity propagation clustering based on the Baidu index: taking the city of Beijing as an example.
Time-ahead photovoltaic generation forecasting method based on machine learning and multi-objective optimization algorithm. Improving the direct torque control using artificial neural network for a doubly fed induction motor. Short-term multi-energy load forecasting for integrated energy systems based on CNN-BiGRU optimized by attention mechanism.