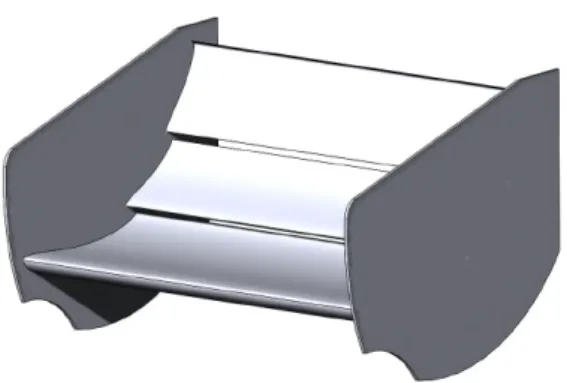
To André Oliveira and Professor André Marta: thanks for their cooperation in the wind tunnel experiments at the Aerospace Laboratory. The purpose of this project is to propose a different design of the rear wing end plate of such a car.
Nomenclature
Glossary
Introduction
- Overview of Vehicle Aerodynamics
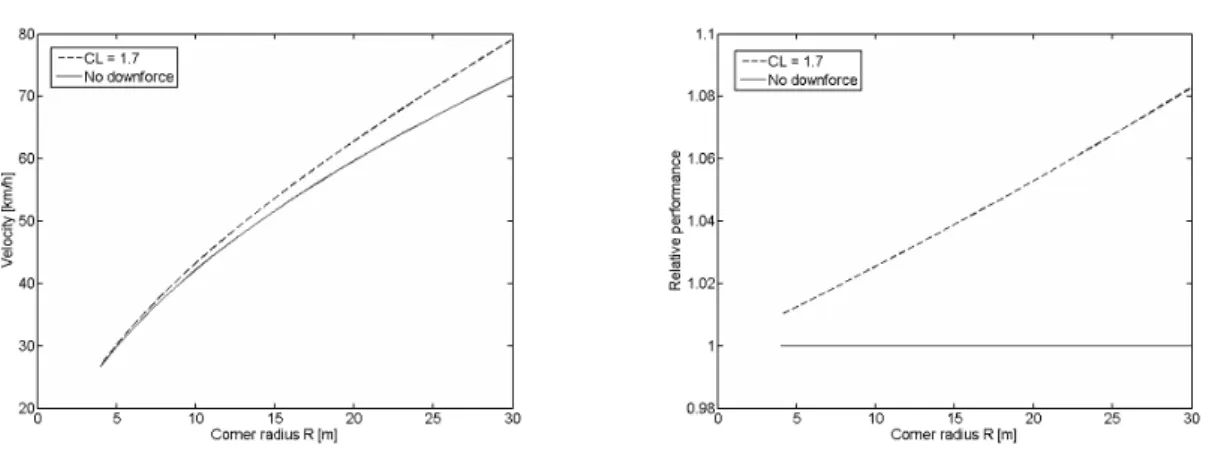
- Impact of Aerodynamic Loads on Tyre Behaviour and Racecar PerformancePerformance
- Downforce Generation on a Racecar
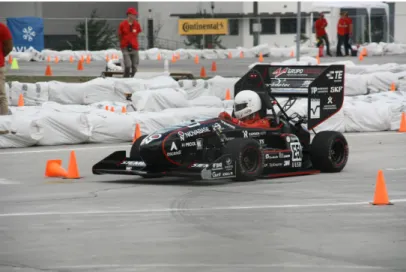
- Formula Student
- Competition Summary
- Aerodynamics in Formula Student
- Motivation
- Objectives
- Thesis Outline
This can be attributed to the different interactions between the different parts of the racing car. This means that the performance of the cars is the main priority of the teams.

Mathematical Formulation of the Problem
- Airflow Characterisation
- RANS Equations
- Turbulence Models
- SST K-omega Model
- Boundary-layer
- Transition
- Transition Effects on Flow over an Airfoil
- Transition Model – Gamma ReTheta Transition
Although most of the flow field is invisible, its structure will inevitably be affected by what happens in the boundary layer where viscous forces are important. It uses two transport equations for the variables k - the turbulent kinetic energy - and ω - the specific diffusion rate (Equations (2.6) and (2.7)). This mixture function F1 fulfills the stated purpose by effectively activating the original k-ω model in the boundary layer and switching to the k-ε model in the free stream, thereby eliminating the main problem of the original k-ω model.
The boundary layer is the flow region in which viscosity effects must be considered [24]. Viscous substrate This viscous substrate is very thin (y+<5) and viscous effects are dominant in this region adjacent to the wall, where the flow is almost laminar.
![Figure 2.1: Schematic of a boundary-layer on a flat plate with no angle of attack [24].](https://thumb-eu.123doks.com/thumbv2/123dok_br/19768327.0/41.892.212.687.189.351/figure-schematic-boundary-layer-flat-plate-angle-attack.webp)
Preliminary Tests
Numerical Accuracy
Mesh Convergence Analysis
- Background
- Geometry Model
- Volume Mesh Generation
- Numerical Setup – Models and Boundary Conditions
- Results
This is because the trimmed mesh in Star-CCM+ multiplies the cell size by two and uses the size of the target surface as an initial value [26]. Slow growth away from multi-layered surface. cells of the same size. The quantities of interest for performing the analysis were the lift and drag coefficient of the wing.
The residuals of one of the simulations are in Figure 3.7, and the data from the mesh convergence analysis are shown in Table 3.2. The intersection of the curve and the y-axis is the estimate of the exact solution.
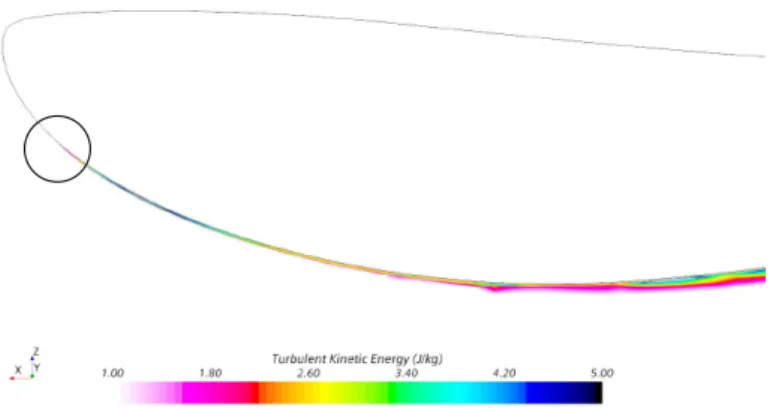
Once again, the TKE contour on the plane of symmetry was drawn near the main member of the wing (Figure 3.12). The Cpof of the simulation with the γ-Reθ transition model is lower in larger parts of the wing than with the SSTk-ω model, especially near the symmetry plane at the leading edge of the wing and at the trailing edge of the main element over the entire wing span. The wall shear stress on the low-pressure side of the wing shows that the separation occurs over the entire span of the main element with the γ-Reθ model, represented by the dark blue strip (W SS = 0P a) after the leading edge.
Finally, the lift and drag coefficients of the γ-Reθ model are compared with those of the k-ω model in Table 3.4. However, since the physics of the flow is different, the γ-Reθ model had to be chosen for the rest of the projects' simulations.
Assessing the Effect of Wing Tip Endplates with CFD
Geometry Model
Flat Endplate Versus Airfoils
The position of the end plate relative to the main plane affects the strength of the wing tip vortices, as can be seen from the vorticity counter in Figure 4.3. Looking at the various components of drag, the introduction of an airfoil on the endplate reduces the total drag of the wing by reducing the pressure and viscous drag of the endplate. However, the viscosity and pressure drag values of the main wing increase slightly with end plate 2402, resulting in a higher overall main wing drag.
The difference in lift coefficient appears to come from the different pressure distribution of the low pressure side of the wing Figure 4.4. The isobaric lines of the upper = 50 mm configuration are closer to being parallel than those of the lower = 50 mm pattern.

Four Endplate Designs – Comparison
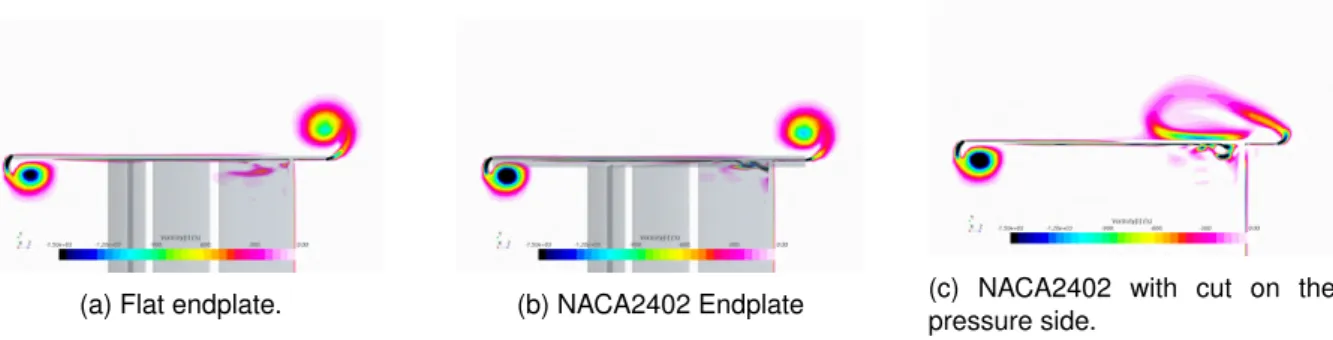
Finally, the efficiency of the four end plates is measured with the values of lift over resistance in Figure 4.6c. The pressure distribution in the low-pressure surface of the wing is shown in Figure 4.7. The pressure distribution on the high-pressure surface of various designs is shown in Figure 4.8.
Additionally, the increased vorticity due to the curvature of the NACA2402 airfoil creates a vortex near the tip of the wing at the underside of the wing. On the right, the pressure side vortex; on the left, the vortex from the suction side.
Full Wing
On the right the vortex on the pressure side; on the left, the low-pressure side vortex. This means that we essentially have two wings operating on different planes and whose vortices, due to their different core orientation, will not oppose each other in the same way as we saw with the single-element wing. More research is needed to understand this interaction and how to exploit the effect of the curved endplate on the performance of a multi-element wing.
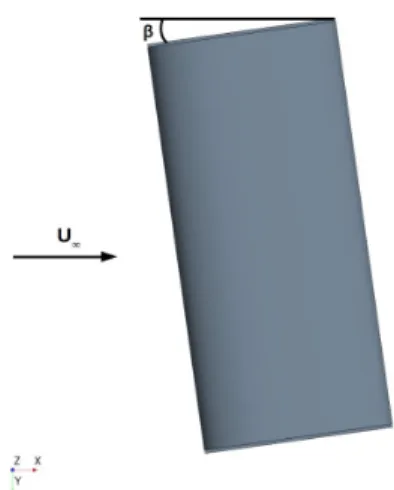
Yaw Simulations
This can be used to see where the vortices are, as well as to separate affected zones of the wing. It can be seen that the separation on the flat end plate is indeed greater than that of the NACA2402 end plate. This can be attributed to the curvature of the airfoil delaying the separation, which does not happen with the flat plate.
Furthermore, the air from the separated region flows into the tip vortex in the flat endplate case. The separation zone increases with the swing angle, due to the pressure gradient increase.
Wind Tunnel Testing Considerations
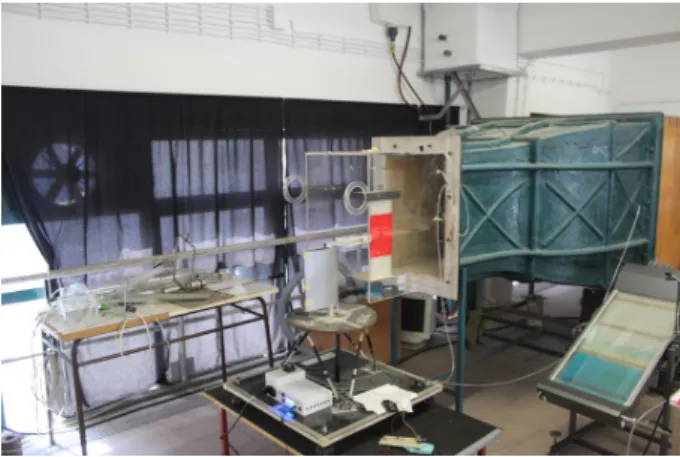
After the simulation phase, a scale model was built so that wind tunnel tests could be performed to confirm the trends observed in the simulations. At IST there are three wind tunnels available for testing: the Low Speed Wind Tunnel (LSWT) (described in [37]); the Fluids Laboratory wind tunnel, also a low-speed wind tunnel; and the Aerospace Laboratory's wind tunnel.
Wing Model
Firstly, to hide the bolts necessary to connect each of the end plates to parts 3a and 3b, thus reducing their resistance; Secondly, to guarantee that the wing span would be the same regardless of the end plate, which would have been more difficult, especially in the case of the curvature end plate; The subassembly forms the structure attached to the threaded rod of the balance.
The printing side of this was extremely rough due to the support material added during the printing process. To address this problem, the surfaces of the curvature endplates were sanded and putty added, a process that was repeated until the surface had a good finish (Figure 5.4).
Experimental Procedure
After this process, the wing model was mounted on the tunnel to assess its readiness for testing (Figure 5.5). It was noted that the lower end of the wing was too close to the flow next to the lower wall of the tunnel, which had a marked effect on the stability of the wing. Therefore, an extension was added to the support so that the wing would be in a more centered position relative to the working area.
The maximum speed of the tunnel still could not be reached because from that speed onwards the vibrations of the wing model were strong enough to threaten its structural integrity, as well as that of its balance. Woolen threads were added to the surfaces of the wing so that the airflow behavior over the wing could be visualized and compared to the CFD simulations.
Test Results
- Clean Wing
- Sand Paper
- Yaw Angles
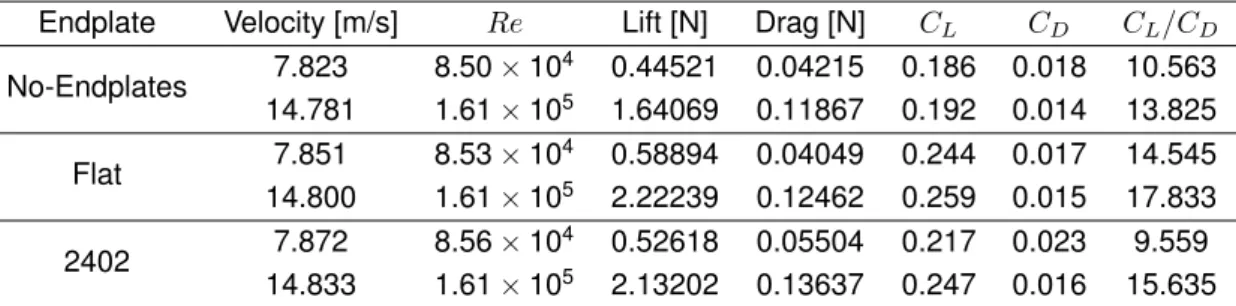
The differences between the two end plates at higher Re were much smaller for each of the three coefficients. These were installed on the leading edge of the wing (on the pressure and suction sides) near the tip of the wing and on all surfaces of the end plates. There appears to be more interference in the flow with the 2402 end plate (Figure 5.8), which may be related to the dimensions of the sandpaper (width and height) which may result in small areas of separation behind it.
With the help of wool threads in the paths with swing angles shown in Figures 5.9 and 5.10. The flat endplate separation seemed to extend further from the leading edge, while the 2402 endplate was stronger but shorter.
Discussion
- Low-Reynolds Simulations
- Simulating the Wind Tunnel Conditions
On the other hand, the increasing beneficial effect of the 2402 end plate effect on CL and CD. The airflow behavior at these Reynolds numbers in the simulations shared some similarities with those in the wind tunnel tests. For the flat end plate, there is only a small separation zone at the junction between the end plate and main wing near the trailing edge of the wing.
The wind tunnel simulations show the opposite for β = 4◦ and β = 8◦ : for these angles the NACA2402 endplate has a lower CD than the flat endplate. The values from the wind tunnel testing have a wider range, with a higher increase in CL/CD compared to what was seen in the respective simulations of the experiment.

CAST Tunnel
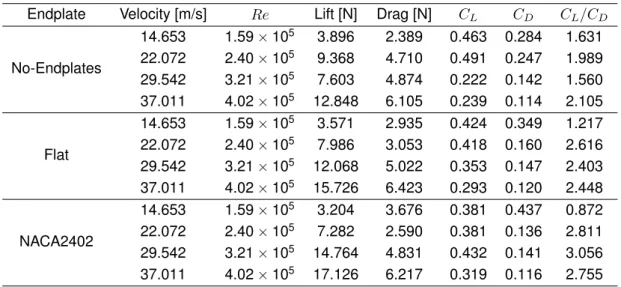
For the lowest Reynolds number, which coincides with the highest Reynolds number tested in the Fluids Laboratory, the trend is the same: the flat endplate has a larger CL, smaller CD, and a CL/ higher CD. In terms of CL , in the second lowest part, the flat Rethe endplate still outperforms the 2402 endplate, but this trend is reversed for the two highest Reynolds numbers. The efficiency values are a direct consequence of the evolution of the CLandCD coefficients, as it is smaller for the 2402 endplate than for the flat endplate at lower Re, but for the following three Reynolds numbers it is consistent with the CFD simulations.
At the highest Reynolds number that allows flow similarity, the trend is the same as that observed with the simulations, indicating that the tested flow is indeed similar to the conditions simulated in CFD. This means that the proposed solution is valid for the Reynolds numbers experienced by Formula Student.
Conclusions
Conclusions
Future Work
Bibliography
A design approach and selected wind tunnel results in high subsonic speeds for the wingtip-mounted wings. Internal Report 00/4, Department of Thermo and Fluid Dynamics, Chalmers University of Technology, Göteborg, Sweden, 2000.
Appendix A
Airfoil Nomenclature
Appendix B
Balance Specifications
Fluids Laboratory
Aerospace Laboratory
![Figure 1.2: Maximum relative cornering speed over the years, with and without aerodynamic downforce [2].](https://thumb-eu.123doks.com/thumbv2/123dok_br/19768327.0/24.892.286.605.630.998/figure-maximum-relative-cornering-speed-years-aerodynamic-downforce.webp)
![Figure 1.3: Coefficients of adhesion as a function of slip for the braking and lateral situations [2].](https://thumb-eu.123doks.com/thumbv2/123dok_br/19768327.0/25.892.140.769.575.765/figure-coefficients-adhesion-function-slip-braking-lateral-situations.webp)
![Figure 1.4: Schematic of the tyre’s performance envelope. The downforce enlarges the range of opera- opera-tion of the tyre [2].](https://thumb-eu.123doks.com/thumbv2/123dok_br/19768327.0/26.892.281.611.115.433/figure-schematic-performance-envelope-downforce-enlarges-range-opera.webp)
![Figure 1.5: Relationship between laptimes and the coefficients of lift and drag of a generic racecar at the Hockenheimring [4].](https://thumb-eu.123doks.com/thumbv2/123dok_br/19768327.0/26.892.257.640.565.812/figure-relationship-laptimes-coefficients-lift-generic-racecar-hockenheimring.webp)
![Table 1.1: Values of C D and C L of different components of a Formula 1 car [5].](https://thumb-eu.123doks.com/thumbv2/123dok_br/19768327.0/27.892.186.708.631.902/table-values-c-d-different-components-formula-car.webp)
![Figure 1.9: Design limitations on aerodynamic devices imposed by FS rules [8].](https://thumb-eu.123doks.com/thumbv2/123dok_br/19768327.0/30.892.249.650.436.725/figure-design-limitations-aerodynamic-devices-imposed-fs-rules.webp)
![Figure 3.3: Three types of core mesh on the same geometry [26].](https://thumb-eu.123doks.com/thumbv2/123dok_br/19768327.0/50.892.136.761.399.600/figure-3-3-types-core-mesh-geometry-26.webp)

