Los Angeles' share of scripted broadcasts dropped from 53 percent in the 2014-15 television season to 48.5 percent in 2015-16. Los Angeles accounted for 40.4 percent of digital scripted broadcasts in the 2015-16 television season, followed by New York City, which claimed a 27.7 percent share. Los Angeles' share of broadcast reality and other show venues fell from 70.6 percent in the 2014-15 television season to 65.2 percent in 2015-16.
Drama remained the largest cinema genre in 2016, despite a decline since the last report from 27.9 percent to 24.1 percent of the total.

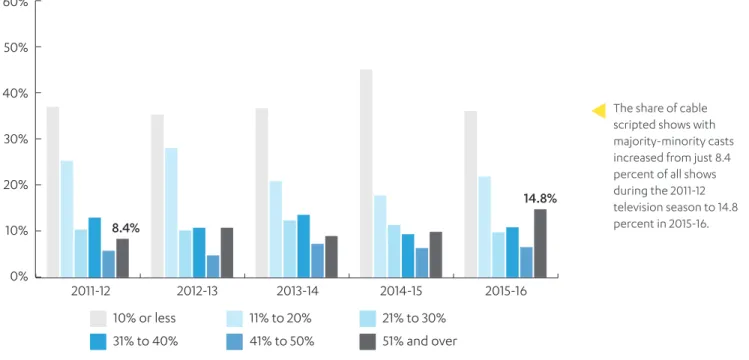
Nevertheless, they will need to double their 2015-16 share to achieve proportional representation (38.7 percent). Women's share of lead talent for broadcast reality and other programs decreased from 24.5 percent during the 2011-12 television season to 18.8 percent in 2015-16. The share of TV programs with a majority-minority group increased from just 8.4 percent of all programs during the 2011-12 television season to 14.8 percent in 2015-16.
Meanwhile, in 2015-2016, blacks achieved proportional representation among the actors in cable-scripted programs, claiming 13.3 percent of the roles.

Only 1.3 out of 10 film directors are people of color
There was virtually no change in people of color's share of directors for the top films between 2011 and percent and 12.6 percent, respectively. Minorities would have to triple their 2016 share to achieve proportional representation among film directors (38.7 percent). Although women's share of directors for the top films increased more than 50 percent between 2011 and 2016 (from 4.1 percent to 6.9 percent), women would need to multiply their 2016 share of directors by more than seven to reach parity with men to achieve
Less than 1 out of 10 film directors are female
In nearly two-thirds of scripted shows from the 2015-16 season (64 percent), women directed 20 percent or fewer of the episodes. More than two-thirds of cable shows from the 2015-16 season (69 percent) had black people direct 10 percent or fewer of the episodes. For more than half of the 2015-16 scripted shows that aired (52 percent), black people directed 10 percent or fewer of the episodes.
For more than half of cable scripted episodes from the 2015-16 season (54 percent), women directed 10 percent or less of the episodes. For nearly three-quarters of digitally scripted episodes from the 2015-16 season (74 percent), people of color directed 10 percent or fewer of the episodes. For more than two-thirds of digitally scripted shows from the 2015-16 season (68 percent), women directed 10 percent or.
TV show creators are the writers who successfully pitch the idea for a show to a network, studio or talent agency. Previous reports in this series show that women and people of color are marginalized in the show creation process relative to their male and white counterparts. The following charts show significant progress over the past year for women and people of color among the ranks of creators in digital television, modest progress for minorities in broadcast, and stagnation for both minorities and women in cable.
On almost every front, both groups remained significantly underrepresented among show creators during the 2015-16 season.

TV SHOW CREATORS
They would have to multiply their 2015-16 share by more than 5 to achieve proportional representation (38.7 percent). People of color more than doubled their share of digital scripted show creators over the three TV seasons examined, from just 6.2 percent in 2013-14 to 15.7 percent in 2015-16. However, minorities will need to double their 2015-16 share to achieve proportional representation (38.7 percent).
The overall minority share of credited writers for scripted shows broadcast in 2015-2016 was 15.5 percent, compared to 13.4 percent a season earlier. Minorities would need to more than triple their share of directors at the dominant agencies in 2016 to achieve proportional representation (38.7 percent). Minorities would need to more than triple their share of leads at the dominant agencies in 2016 to achieve a proportional representation (38.7 percent).
The share of cable scripted show creators who were represented by one of the three dominant talent agencies increased from 70.5 percent during the 2011-12 television season to 77.3 percent in 2015-16. The share of digitally scripted show creators who were represented by one of the three dominant talent agencies fell from 82.6 percent during the 2013-14 television season to 68.1 percent in 2015-16. However, they would need to double their 2015-16 share in order to achieve proportional representation (38.7 percent).
The share of scripted leads who were represented by one of the three dominant talent agencies increased from 55.6 percent during the 2011-12 television season to 70.3 percent in 2015-16. Minorities will need to double their share of leadership in 2015-16 in both dominant and residual agencies in order to achieve proportional representation (38.7 percent). The percentage of digital scripted executives who were represented by one of the three dominant talent agencies fell from 63 percent during the 2011-12 TV season to 46.2 percent in 2015-16.
Nevertheless, minorities would need to more than triple their share in 2015-16 to achieve proportional representation (38.7 percent).

THE BOTTOM LINE
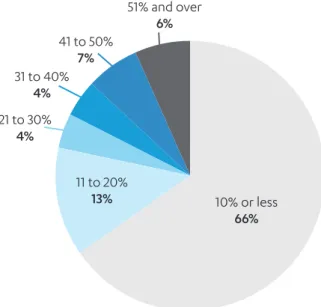
Global return on investment15 peaked in 2016 for films with a cast that was 41 to 50 percent minority (2.9). Most of the top 173 films of 2016 had a cast that was 10% minority or less. During the 2015-2016 television season, the average volume of tweets16 was highest for scripted shows with casts that were 21 to 30 percent minority (8,600), followed closely by shows with casts that were 31 to 40 percent. minorities (8500). ).
During the 2015-2016 television season, the average number of tweets peaked for cable shows with casts that were between 31 and 40 percent minority (4,000). Six of the 10 top-rated shows among viewers ages 18 to 49 in 2015-2016 had casts that were at least 21 percent minority, including the top-rated show, Empire (Fox), with a majority-minority cast. Nine of the ten most aired scripted shows among black households in 2015-2016 had casts that were at least 21 percent minority.
Six of the ten most aired scripted shows among Latino households in 2015-2016 had casts that were at least 21 percent minority. Five of the ten most-aired scripted shows among white households in 2015-2016 had casts that were at least 21 percent minority. Eight of the top ten cable-scripted shows among Black households in 2015-2016 had casts that were at least 21 percent minority, including five shows with majority-minority casts on BET and OWN.
Six of the top 10 cable shows in Latino households in 2015-2016 had at least a 21 percent minority cast. In 2015-2016, five of the 10 most popular cable shows in white households had at least a 21 percent minority cast.

NEW SHOWS
Show creators of color were responsible for only 8.9 percent of new scripted shows that debuted in the 2017-18 television season, and all of those show creators were black. That figure exceeds the number of black people announced for scripted television or cable combined as a percentage, or 7.3 percent), but falls short of the number for digital scripted shows that season (15.7 percent). Female show creators were responsible for just 15.6 percent of new scripted shows that debuted in the 2017-18 television season.
This figure represents a step back for women in this arena, as the group's share of show creators in the broadcast scripted, cable scripted and digital scripted arenas were all higher during the 2015-16 season. People of color made up 28 percent of leads for new scripted shows debuting in the 2017-18 television season, a figure significantly greater than those observed in the 2015-16 season for broadcast scripted, cable scripted or digital scripted programming. Twenty-four percent of new scripted shows that debuted during the 2017-18 season featured majority-minority casts, a number significantly higher than the numbers for the broadcast, cable or digital arenas in 2015-16.
Women claimed just 28 percent of leads for new scripted shows debuting in the 2017-18 television season, a number significantly less than those observed in the 2015-16 season for broadcast scripted, cable scripted or digital scripted shows (35.7 percent, 44.8 percent). and 43.1 percent).

Five Years of Progress?
But much of the movement for talent of color has been limited to blacks, who have actually approached proportional representation in few arenas. Sparked by the public exposure of widespread sexual abuse and mistreatment of women in the workplace, the Me Too movement also shed light on long-entrenched gender biases and structural ones. The launch of the Me Too movement inspired prominent women in the entertainment industry to launch the Time's Up movement, a comprehensive agenda to promote equality and safety in the workplace through legislative initiatives, changes in company and employment policies.
In addition to his participation in the Hollywood Diversity Report, he is currently investigating the cultural politics of independent filmmakers of color. Her research takes an intersectional approach to unpacking the ways women employ different strategies of embodiment to navigate the double binds they encounter in the workplace. Darnell Hunt is Dean of the Department of Social Sciences at UCLA and Professor of Sociology and African American Studies at UCLA.
Hunt has contributed to numerous projects addressing the issues of access and diversity in the entertainment industry, including work with the WGA, SAG, AFTRA, the NAACP and the U.S. 3 Totals for the various analyzes in this report may differ from the total for the number of movies or TV shows evaluated due to focused analyzes on a subset of the data (listed below) or missing values for some cases (e.g. (eg many reality shows do not identify a cast, director or writer). The HH ratings presented by race are based on the race of the head of household, while the 18-49 ratings are based on individual viewers.
11 In the analyzes for this section, a film or television show that received an Oscar or Emmy in any category is counted as an "Oscar winner" or "Emmy winner". No distinction is made between films or TV shows that have won a single or multiple awards. 21 Time's Up is a major initiative created by over 300 women in the entertainment industry in January 2018 to fight systemic sexual harassment in Hollywood and in craft industries across the country. For more information, see https://www.timesupnow.com/.