In the case of Brazil, the main institutional changes were economic opening and stabilization. Moreover, the effects of the reforms implemented by Collor and Cardoso on income distribution were dominated by changes in the macroeconomic environment (inflationary instability, deep recession, stabilization boom and external crisis). We believe that this is mainly due to the effects of the 1994 stabilization on income distribution.
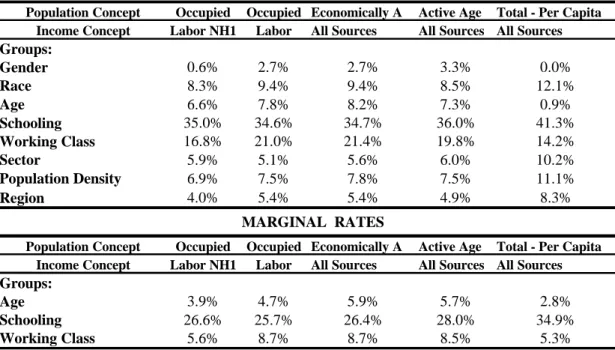
Gross and Marginal Contributions: Robustness AnalysisB - MARGINAL RATES OF CONTRIBUTION THEIL-T
In summary, the period 1990-97 – marked by the implementation of reforms in Brazil – shows an increase in the explanatory power of education, a decrease by age, while the contribution of the working class remained at the same level, in the extremes of the economy. series. Comparing premiums for the occupied population with and without controlling for work hours shows that the explanatory power attributed to gender, race, and age (especially gender) decreases dramatically once the effects of partial work hours are taken into account. In contrast, the marginal and gross contribution of the working class falls from 8.7% to 5.3% when we move from EAP to per capita concepts.
This subsection assesses how this wealthy group performed during the reform period using standard poverty techniques applied to the analysis of individuals at the top of the income distribution. This process can be attributed not only to the effects of economic reforms implemented by the color administration (such as the opening of the economy) that broke the monopoly power of the industrial elite - including entrepreneurs and union workers - coupled with an aggressive but short-lived administrative reform which affected public servants. The evolution of the rich can also be captured by the distance of the average per capita income of the wealth relative to a given wealth line.
In other words, we calculate not only the size of the group defined as wealthy, but the expansion of their income stream as well. During 1990, the average income gap of the rich with respect to the poverty line amounted to 16.39%, which means that the rich average per capita income corresponds to 583 Reais of 1997.
Profile of the Impact of the Reforms on the Riches
As expected, the wealthy are overrepresented among those with a dependency ratio of one: 29%, compared to 10% for the total population. The wealthy are also overrepresented among those who pay for their own homes and among those who pay rent. They are underrepresented among those living in ceded areas and among those living in their own homes without land ownership rights.
Access to public services such as water, sanitation, electricity and garbage disposal is almost universal among the wealthy, but not so for the non-wealthy groups of Brazilian society. The biases resulting from gender, age and immigration status of the head of household among the wealthy are relatively small, while the race. In terms of the specific human capital acquired through job tenure, 43% of the total population stated that an individual with five or more years of experience in the current position is at the head.
In other words, most of the wealthy reported that they did not change jobs during the reform period, thus preserving and increasing their stock of specific human capital. Finally, the working class and the activity sector of household heads show that the rich were over-represented in the public sector, the service sector and among employers in 1997.
Exercises on Inequality Decomposition
The Top 10%
Although the absolute contribution of the rich to aggregate inequality is extremely high, there is little evidence to suggest that it has increased during the reform period. The per capita concept shows a similar movement during the reform period; the only difference is that the decline observed in 1993–97 more than compensates for the increase observed in 1990–93.
University Graduates
The increase in the university group's contribution to overall inequality was so great that it completely canceled out the favorable trends in the rest of the population. Morley (1999) found how much of the increase in university contribution came from an increase in the difference in knowledge, how much from a change in the size of the university group, and how much from increased variance within the university group itself. In Brazil, the contribution of university graduates to total inequality is much smaller than elsewhere, despite the fact that the skills gap is by far the highest in the region.
Looking at Table 9, the reason is that the share of the university-educated workforce is so small that it simply does not carry much weight in any calculation of inequality. The Theil's total was 0.81, graduates made up only 0.3% of the adult population and earned 8.8 times more than the non-graduate group. For countries with very small university-educated populations, an increase in the share of university graduates in the labor force is regressive over a wide range or over a very long time, unless it is accompanied by a significant decline in the skills gap.
The reason countries have this problem is that a small favored group (university graduates) expands relative to the rest of the population. This is regressive, until the group becomes large enough to be representative of the population as a whole.”
Rates of Return to Schooling
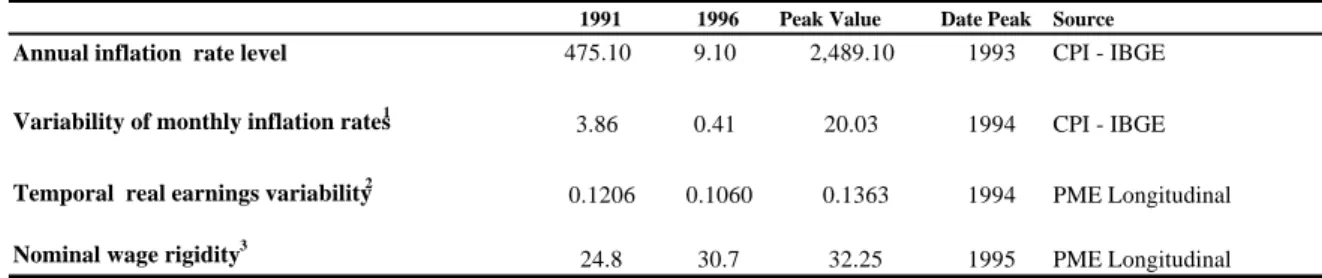
In the Brazil case, to keep the overall Theil constant at its 1976 level when the university population share grows to 5%, one would have to cut the skill differential in half (from 8.8 to 4.2). The second part of the paper explores PME monthly household surveys to extract connections between movements of distributional variables, on the one hand, and economic reforms and macroeconomic fluctuations, on the other. At the same time, PME's longitudinal aspect allows us to refine the inequality decomposition exercises performed in section 2.3 with PNAD, in order to qualify the effects of the 1994 stabilization on income distribution.
The rest of this part aims to isolate the distributional effects of macro shocks and policies using standard time series techniques. The Pesquisa Mensal do Emprego – PME - This monthly employment survey was conducted in the six main Brazilian metropolitan regions by IBGE. PME's large sample size combined with its high frequency allows us to also construct monthly time series on earnings dispersion at a fairly detailed level of disaggregation.
PME replicates the U.S. Current Population Survey (CPS) sampling scheme, attempting to collect information on the same home eight times over a 16-month period. This short-term panel typical of PME allows us to derive some dynamic aspects of income distribution reforms.
An Updated Assessment of Inequality
Similar comparisons using Gini coefficient indices shown in the first line of Table 11B indicate that the values found for 1994 were 4.3% above the values found versus 0.59). Second, the various external shocks that hit the Brazilian economy in September 97 (Asian crisis), August 98 (Russian Crisis) and January 99 (Real Devaluation Crisis) must be included in the analysis. Otherwise, we would have an overly optimistic view of the trends of the Brazilian income distribution and its relation to economic reforms (especially the opening of the economy).
The comparison between PME data collected in 1998 provides evidence on the effects of the Asian Crisis on the Brazilian income distribution. The first line of Table 11.A shows that the Theil-T index for labor earnings for the. One could argue that given the rise in unemployment rates observed after January 1998, most of the effects of the 1997 Asian Crisis were not felt by the employed population.
Nevertheless, the first line of Table 11C shows that the Gini coefficients for the group of working-age individuals were almost constant between 1997 and 1998. One could extrapolate this exercise to draw conclusions about the possible effects of the Russian crisis on income distribution, not yet fully incorporated into the data.
PME’s Longitudinal Aspect and Inequality Comparisons We have also decided to incorporate PME data because its longitudinal aspects
The larger decline in traditional measures of inequality on a monthly basis compared to measures on a four-month basis is explained by the decline in the individual volatility measures following the sharp decline in inflation rates over this period. On the other hand, the observed decline in inequality stricto sensu was much smaller than what inequality measures based on monthly measures would have suggested. In summary, the drop in inequality after stabilization for the always-occupied population is much higher on a monthly basis (as traditionally used in Brazil) than when using average earnings over four months.
Theils and Ginis declines are 2 to 4 times higher when using the former concept. Another way to look at the effects of inflation and stabilization is to note that most of the decline in inequality measures is attributed to the within-groups component, especially in month-on-month inequality measures. For example, in the case of the month-by-month income concept presented in Part B of Table 13, during 1993 the sum of the marginal contributions between groups explains the component in relation to schooling, working class and age (i.e. the three main characteristics) only 31, 5% of the total inequality.
For the corresponding measures based on mean earnings over 4 months shown in Table 13, Part A, the relative increase in explanatory power is 12%. Overall, the main point of this section is that most of the decline in monthly income inequality observed after stabilization can be attributed to a reduction in earnings volatility and not to a decline in permanent income inequality (or strictu senso inequality).
Other Distributive Impacts of Stabilization 10
The prices of non-tradable goods are not directly affected by the opening of the economy and the appreciation of the exchange rate. So there is a change in the relative prices against the tradable sectors and in favor of the non-tradable sectors. Low-income workers are concentrated in some of the non-tradable sectors, particularly in personal and social services.
In other words, most of the reduction in inequality measures observed in Brazil over the 21 years in question took place in the last four years after stabilization. We evaluated the absolute income changes in the top 10% of the income distribution by assessing how the composition of this group changed during the reform period. The second channel considered here is the skills gap between the high school group and the rest of the workforce.
This last statistic was 53% in 1990, indicating a sharp effect of the reforms on the composition of wealth, favoring highly educated groups. Another way to look at these effects of stabilization on inequality measures is to note that most of the fall in the inequality measures is attributed to the within-groups component in the monthly inequality measures.
