4] optimized both the stiffness and mass distributions via the same optimization routine to match the scaled natural frequencies of the full model. used two separate optimization routines to efficiently optimize the stiffness and mass distributions of the scaled model, while matching the scaled natural frequencies and the non-dimensional mode shapes of the full model with reasonably good results.
Boeing Joined Wing SensorCraft
The methodology used for the scaling procedure is a variation of that used by Richards et al. Although there are many areas of study of static or dynamic aeroelasticity, this work will focus on the flutter characteristics of the test subjects to verify the similarity of aeroelasticity.

Aeroelastic equations of motion
Flutter is one of the most important aeroelastic phenomena and also one of the most difficult to predict. It should be noted that the last element of this equation, the gravitational influence, is not a necessary component for the scaling of the EOM if there is no significant coupling between flight dynamics and aeroelasticity, but is required to design a scaled model with the correct flight dynamic scaling. will therefore be used.
Aeroelastic Scaling
2.2.4) where [φ] is the matrix of the non-dimensional mode shapes and {η} are the modal coordinates. The size and aerodynamic shape (item 1) of the scale model are completely determined by this length ratio.
Wingbox characteristics
The results for the scaled modal and aeroelastic response will be presented in the last section. The central beam was modeled using SHELL93 and BEAM189 elements, being the beam element used at the top and bottom for modeling the beam caps and the shell element as web. The modal analysis produced results for the first 15 modes, but only the first 10 will be of interest and are shown in Table 3.3.
The design constraint for the scale model was to create a model that could fit into a 1 meter diameter wind tunnel test chamber. With the reference length, b, defined and following the same procedure as in section 2.2.1 for the JWSC, one can calculate all the scaling parameters needed for scaling the Wingbox. The initial design point for the scaled-down model has a similar structural layout to the full-scale model, but is naturally scaled down to 12.3% of its size.
Considering the frequencies for the full-scale model shown in Table 3.3 and the frequency ratio (λω) already calculated and shown in Table 3.4, the target scaled frequencies to be matched through the optimization procedure can now be calculated and appear. in table 3.5. The target mass for the scaled model can also be calculated, mm = 0.6156 [kg] and of course all other target scaled quantities can already be calculated but will not be shown.
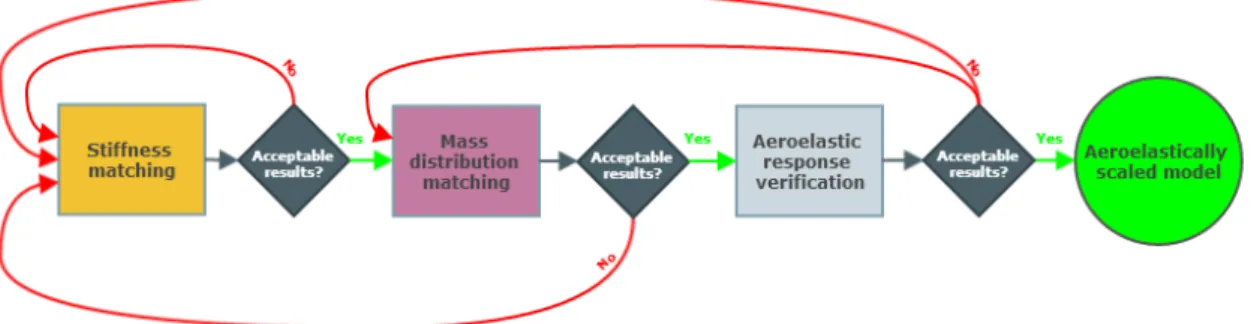
Scaling methodology
Other programs can also be added to the iterative routine, such as MathWorks MATLABR, to retrieve and manipulate data obtained through the FE analysis into usable (objective) variables for the optimization algorithm. In this way, the scaled model height is already limited, as are the section heights of the various structural elements in the scaled model. Taking this into account, the only variables applicable to the optimization procedure were the section thickness of beams, ribs and skins.
For the stiffness fitting, two different load cases were used to properly fit both the bending and torsional stiffness of the model. An average nodal relative error, e, is also defined and ¯ serves as a reference when presenting results for the fit, it is the average value between all the nodal relative errors. The objective function for the stiffness optimization routine is then set to minimize the RMSD variable.
To match the mass distribution, 33 point masses were added to the already adjusted scaled model in a symmetric manner to match the modal response to the target scaled values. Again, Figure 3.7 presents the iterative optimization process for matching the Wingbox mass distribution.

Wingbox scaling results
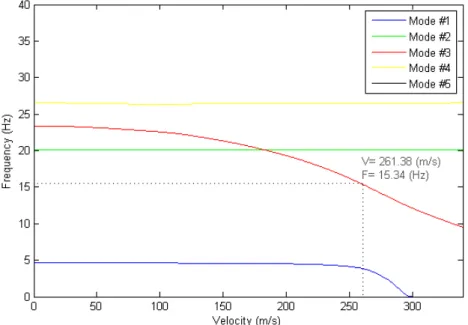
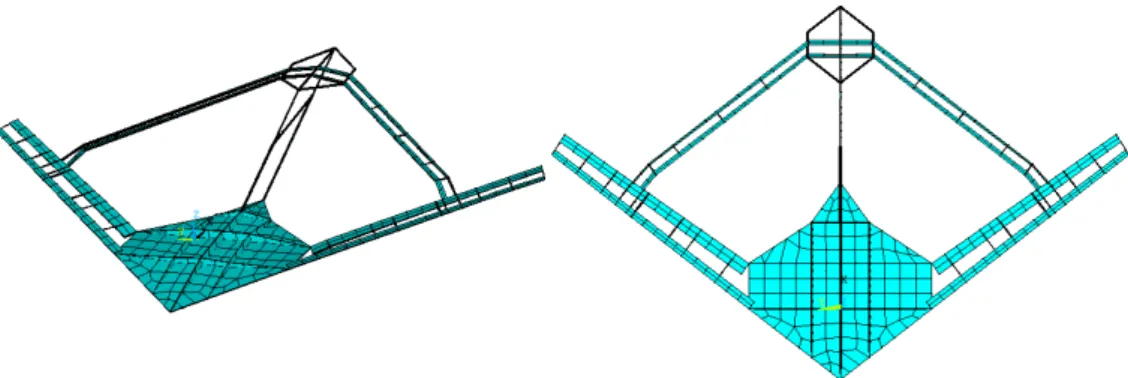
Again there is a steady increase in the mean junction error for the mode shapes, but when we compare these values with those in Table 3.6 the improvement is noticeable. Note that for this flutter analysis only the first five vibration modes were included and the boundary conditions were the same as for the FE model. By analyzing these images, one can realize that the natural vibration mode responsible for the flutter instability is the third mode, shown in red, and extract both the flutter speed and the frequency for the structure.
Now looking back at section 3.1.2 and table 3.4 and multiplying the full-scale model flutter speeds and frequencies by the velocity ratio (λV) and the frequency ratio (λω) respectively, we get the expected/target values for the scaled model flutter response characteristics. In Figures 3.21 and 3.22, the evolution of the structural damping with respect to the airflow velocity and the evolution of the structural frequency with respect to the airflow velocity are represented once again, respectively, as obtained through the g-method this time for the scaled model. As for the aeroelastic response characteristics (Vf and ff), both the values obtained through the g-method and the K-method are really close to the target values previously presented in Table 3.9, this deviation is represented as relative errors for a better understanding in Table 3.11.
In this chapter, the scaling methodology presented in Chapter 3 will be used once again, this time for linear aeroelastic scaling of the United Wing Sensor. Once again, Ansys'R Mechanical APDL software will be used for the static and modal analysis of the scaled FE model.

Scaled model
This algorithm relies on a derivative-free method for multiobjective optimization problems that does not aggregate or scale any component of the objective function, but uses the concept of Pareto dominance to reach and maintain a list of possible non-dominated (optimal) points [19] . This algorithm has been proven to give best-of-the-art results and has been used for both stiffness and mass distribution/scaled modal response matching. As the object of structural optimization is this "bare" model, when optimized this model will itself provide a good approximation of the static and modal behavior of the target full-scale prototype, but the skin must be placed to test it in flight.
Two options for this fit to the skin will be presented in order not to significantly change the resulting stiffness of the scaled model. The first option is to use a flexible fabric such as an impermeable compound such as low-stiffness polyurethane-coated Spandex around the internal structure to match the increased aerodynamic shape of the JWSC prototype. This option is expected to add little or no stiffness and extra mass to the scaled model and not significantly change the scaled aeroelastic response of the model, while recreating a good approximation of the scaled JWSC external shape.
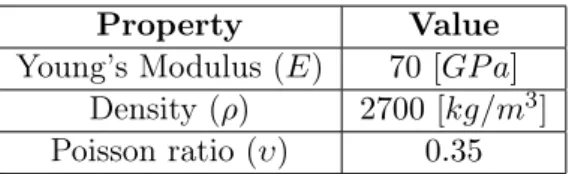
Returning to the scaled FE model, the front and rear wings as well as the center boom are composed of the same aluminum metal that was used for the wing box in the previous chapter, therefore with its mechanical properties shown in Table 3.1. Regarding the internal structure of the hull, a carbon fiber reinforced polymer (CFRP) laminated composite was used and its mechanical properties are shown in Table 4.1.
Scaling methodology
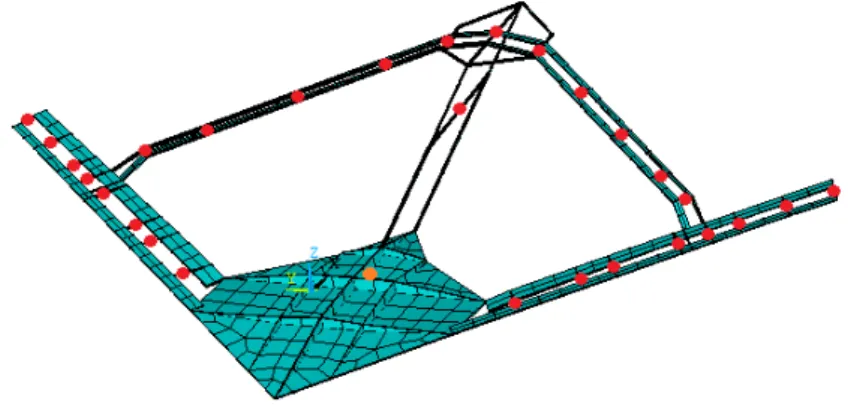
Now, this optimization procedure is expected to give the optimized layout for the shoulders and ribs of the front and rear wings, the center boom and all connections (front rear wing, rear wing-center boom) however, the fact that the structure is stuck in the vicinity of the pipe leads to unrealistic nodal values with almost zero displacement in the pipe components in all load cases and, therefore, to the impossibility of its structural optimization. To overcome this problem, an additional stiffness matching step was included. For the optimization of the fuselage components, the non-structural point masses used to match the mass distribution were added to the structure as shown in Figure 4.3.
A total of 6 variables were defined for this optimization procedure, the thicknesses of the fuselage components (5 variables) and another for all the applied masses, i.e. the value obtained for the masses at the end of this "extra" optimization step will serve as the initial design point for the scaled modal response optimization procedure. The initial design point for this phase was set by both of the previous steps, leaving us with 16 variables (due to symmetry) for the point masses, as seen in Figure 4.3.
This time the target values will be the full-scale free modal analysis data, and as in the Wingbox case, two RMSD objective variables were defined, one for the scaled frequencies and another for the scaled mode shapes. Once again, the objective variable for the nodal displacements (RM SDφ) used only the z component of displacements.
Joined Wing SensorCraft scaling results
As previously stated, 10 modes (from the 7th to the 16th) are included in the scaled modal response fit for the scaled JWSC. Let us now visually compare the resulting mode shapes of the modal response fit for the JWSC. Now, for the flutter analysis of the scaled model a similar aerodynamic model and methodology was used.
It can be seen that the vibration mode responsible for the flutter instability of the scaled model is the 12th mode, represented in black, and its vibration response characteristics are shown in Table 4.6. In Table 4.7 there is a comparison between the obtained flutter response characteristics for the scaled and full scale model. Although the relative error in terms of flutter frequency is low, there is a known discrepancy between the target and the velocities obtained for the scaled model.
For the modal response matched, the stiffness and mass distribution were successfully decoupled and separately optimized. For the Wingbox case there was a very good match of the scaled aeroelastic response with the correct flutter mode, frequency and speed were captured with both the g and K method.
Future work
PhD thesis, 48th AIAA/ASME/ASCE/AHS/ASC Structures, Structural Dynamics and Materials Conference, 2007. Design of a scaled flight test vehicle incorporating linear aeroelastic effects. 54th AIAA/ASME/ASCE/AHS/ASC Structure, Structural Dynamics and Materials Conference Proceedings, 2013. Structurally integrated antennas in a winged aircraft.
Præsenteret på den 46. AIAA/ASME/ASCE/AHS/ASC Structures, Structural Dynamics and Materials Conference, Austin, Texas, 2005.