Regarding the persistence of performance, empirical evidence points to the consistency of the performance of the European bond fund. The Persistence of European Bond Fund Performance”, working paper NEGE 7/2004, Universidade do Minho (paper presented at several national and international conferences/seminars);
Motivation and Purpose of this Research
Mutual funds are sold primarily through banks to risk averse investors, and bond fund returns are (wrongly) associated with safe returns. A major issue that can be raised in the context of conditional models relates to the choice of variables to use as conditional information.
Organization of the Dissertation
- Introduction
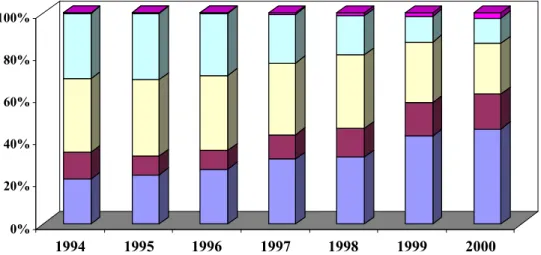
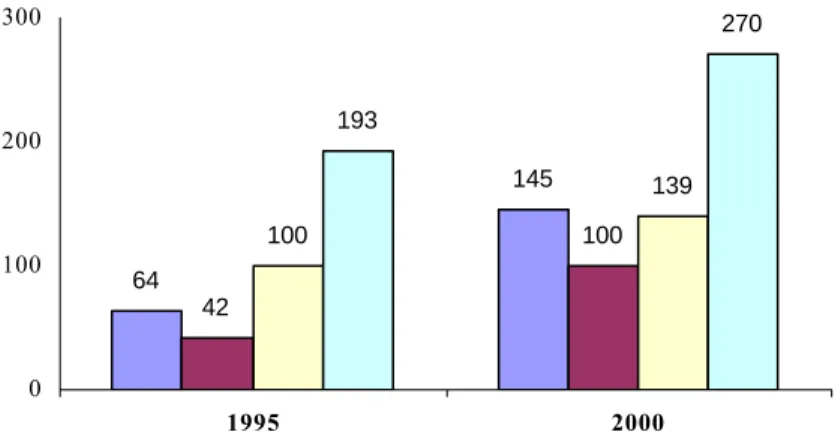
- The European Mutual Fund Industry: Recent Developments
- Principles of Funds’ Taxation
- Perspectives for the Future
With the adoption of the Euro, the European market became the second largest mutual fund market, after the US. This table provides a summary of the UCITS tax principles for some European countries, at the end of December 2000.
Introduction
In this model, the market portfolio is one of the factors, and state variables appear as additional factors. The use of conditioning information is one of the most recent developments in mutual fund performance.
Performance Evaluation in the Context of Asset Pricing Models
On a theoretical (and even practical) basis, multiple index versions of Jensen's measure seem more appropriate than single index versions.14. Some studies have examined the explanatory power of the single-index model using duration as a measure of risk.
Predictability of Security Returns
Fama and French (1989) investigate the ability of the dividend yield, a default spread and a term spread as predictor variables. 27 With respect to the US market and for the period 1965-1995, these four variables capture 10 percent of the monthly variation in excess bond returns.
Conditional Measures of Performance
38 The conditional alpha model can be viewed as a linearized version of the conditional measure proposed by Dahlquist and Söderlind (1999) (see Söderlind, 1999). The main problem with the conditional performance evaluation approach is related to the assumed functional form for the time-varying betas.
Persistence of Performance
Studies on persistence also differ in terms of the methodology used: cross-sectional regressions (Kahn and Rudd, 1995), contingency tables (Khan and Rudd, 1995; Malkiel, 1995) and performance-ranked portfolios (Elton, Gruber and Blake, 1996). Overall, the results of the empirical studies on the persistence of bond funds seem to indicate that there is less evidence of performance persistence on bond funds than on equity funds. In their study, on the European equity fund market, Otten and Bams (2002) also found that the evidence they found for the persistence of average returns, for funds investing in the UK, is even stronger when considering conditional models.
Overall, most empirical research seems to show that the inclusion of informational variables does indeed change inferences about the persistence of performance, thus challenging the evidence from the previous literature.
Conclusions
Subsequently, significant variables, which represent useful information in predicting returns on European bonds, will be included in the conditional models (Chapter 5). Empirical results regarding predictability in the European bond market are presented and discussed in the next chapter.
Introduction
These information variables have been shown, through empirical studies examining stock returns and primarily in the US market, to have some predictive power. Therefore, we start by analyzing the ability of different variables to predict bond yields in the European market, rather than assuming a set of predetermined information variables as conditioning information. Thus, the aim of this chapter is to investigate the predictive power of a set of predetermined information variables in the case of the European bond market.
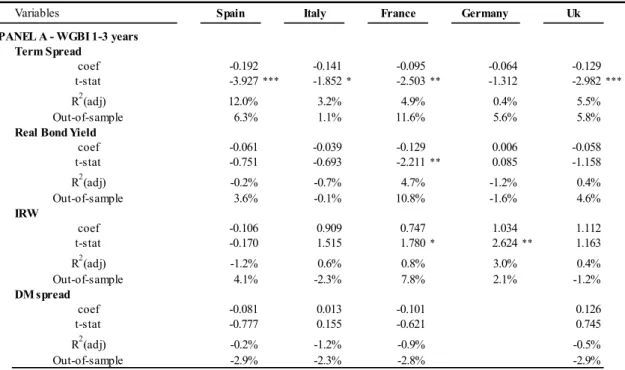
We test whether variables, which are often used in the context of other markets (such as inverse relative wealth, term spread, real bond yields and a January dummy), are also useful predictors of European bond yields.
Motivations for the Information Variables
These two variables are used as proxies for the total expected bond risk premium, as suggested in Ilmanen (1995). In the literature review, we mentioned several other studies that use the term spread (a measure of the slope of the term structure) as a predictor of the expected excess bond return. If we subtract expected short-term interest rates or expected inflation from the bond yield, we should get a better proxy for the expected bond risk premium.
Neither of these two variables is a perfect proxy for the expected bond risk premium, as both contain information about it and about expected nominal or real rates.
The Data
- Bond Market Returns
- Predetermined Information Variables
To investigate this possibility, we also consider a dummy variable for the month of January. As predefined information variables, we consider the term spread, a real bond yield and the inverse relative wealth, plus the yield spread relative to German bonds and a dummy variable for the month of January, as described in the previous section. We reject the null hypothesis that the series is I(1) in favor of the alternative hypothesis of an I(0) series if the test statistic has a more negative value than the MacKinnon critical value (MacKinnon, 1991).
Regarding the level variables, we find relatively high correlations, namely between the forward spread and the real bond yield and between the real bond yield and the DM spread.
Empirical Results
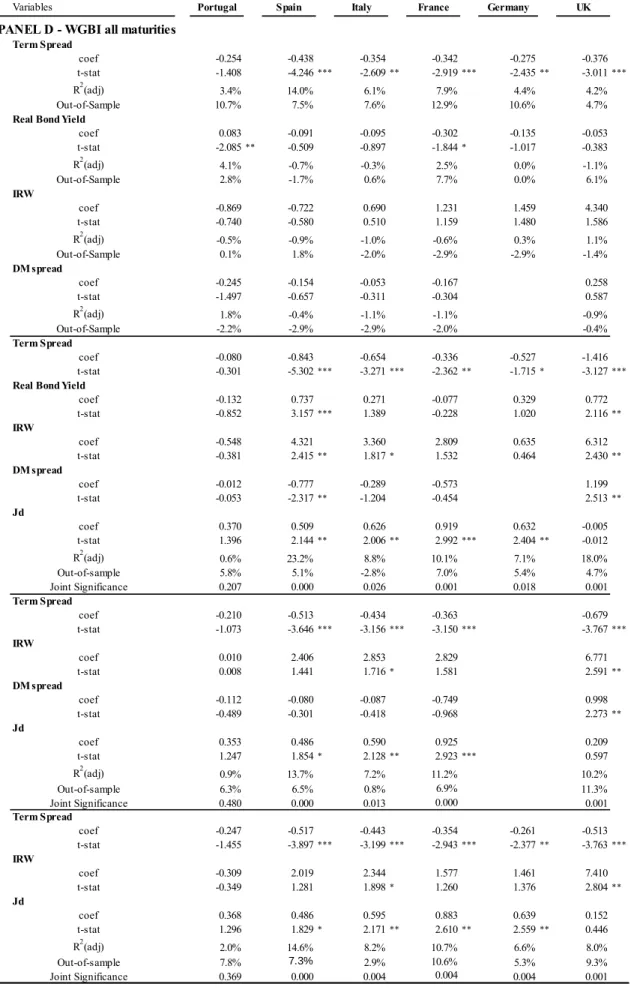
The period from February 1994 to December 1997 (a total of 47 monthly observations) is used to estimate the coefficients for the information variables. In general, the evidence of predictability is slightly higher for shorter maturity indices (1-3 and 3-5 years to maturity) both in-sample and out-of-sample. Comparing the results of the three multiple regressions, the out-of-sample predictability is always higher for the one that includes the spread term, IRW, and the January model.
60 In a study of the Japanese market Cai, Chan and Yamada (1997) also found a negative sign for the term spillover variable.
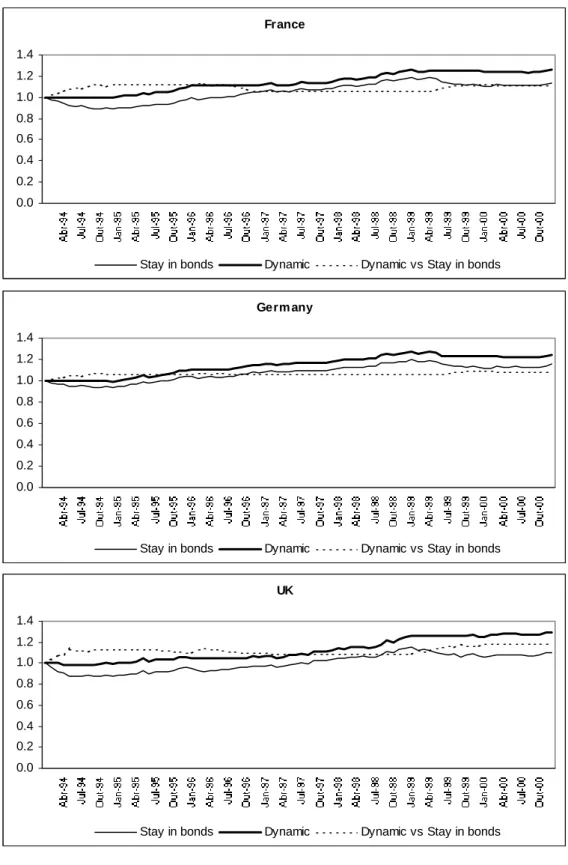
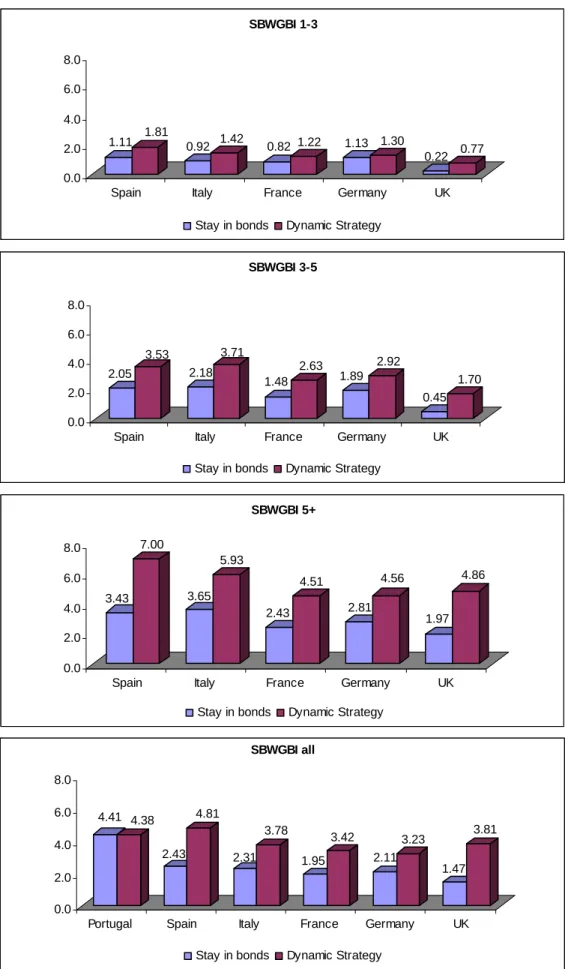
Investment Implications
The second solid line shows the cumulative excess return of the passive "stay in bonds". The relative performance of the dynamic strategy over the cash market gradually increases throughout most of the sample period. The second solid line shows the cumulative excess return of the passive "stay in bonds" strategy.
Panel A reports the results of the passive strategy while Panel B presents the results of the dynamic strategy.
Conclusions
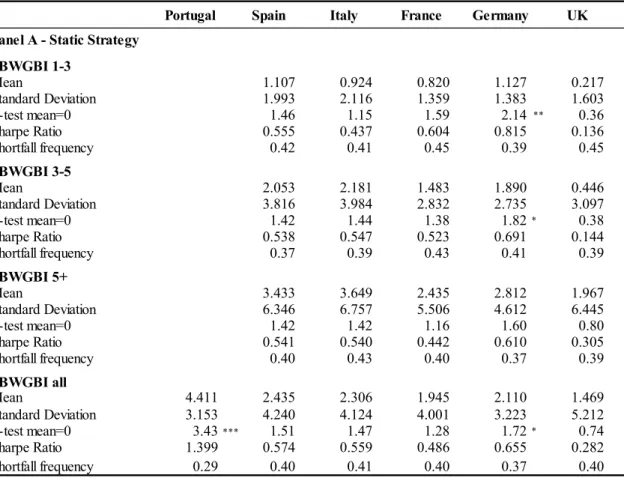
Regressions of excess bond yields on lagged information variables for the subperiod February 1994 to December 1997. The dependent variable is the monthly continuously compounded excess yield for each Salomon Smith Barney WGBI country for three maturity subsectors and for a broad index of all maturities. Joint significance' is the probability for the chi-square statistic of the Wald test for the constraint that all variables have a coefficient equal to zero.
Regressions of excess bond returns on lagged information variables for the January 1998 to December 2000 subperiod.
Introduction
In this context, we innovate, first, by conducting the first comprehensive study of an important market, the European bond fund market, and, second, by using information variables that are more informative about bond returns that we have found, in the last chapter. , to have forecasting skills for the European bond market. Consequently, this approach may challenge previous findings in the literature, especially for the specific case of bond funds, as research on them is very scarce. Thus, in this chapter we propose to examine the performance of a sample of bond funds in the European market.
In light of the benchmark problem mentioned in the literature review, to analyze whether conclusions on bond performance differ using a single-index model or a multiple-index model;.
Unconditional and Conditional Models of Performance Evaluation
Ap = the vector measuring the response of the conditional alpha of portfolio p to the information variables;. That is, we replace equation [5.2] with a similar equation for each of the K-factor betas of the managed portfolio. Thus, the regression equation of our conditional K-factor model will have (L+1)*K+1 regressors: a constant, the K factor portfolios and the product of the L information variables in Zt−1 with the K factor portfolios .
In the case of the conditional model with time-varying alphas (expressed in equation [5.5]) it will have more L-regressors corresponding to the variables in Zt−1 leading to a model with (L+1)*( k+1) regressors.
The Data
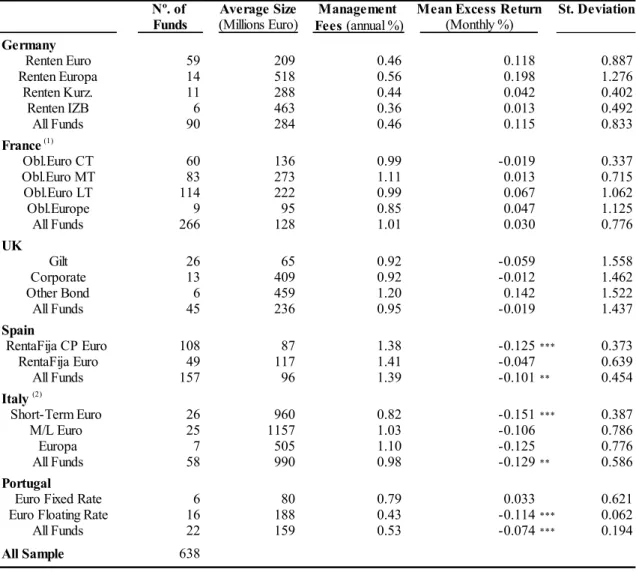
- Bond Fund Returns
- Benchmark Returns
Bond funds are classified according to the classification used by domestic associations (BVI, Assogestioni, Autif, APFIN, AFG-ASFFI and Inverco) as well as Micropal. Italian funds are classified as follows: bond funds that invest in short-term securities in euros (Short-term Euro), bond funds that invest in medium and long-term securities in euros (M/L Euro) and bond funds that invest in European securities. (Europe). For Spain, we have bond funds that invest mainly in short-term securities in euros (RentaFija CP Euro) and bond funds that invest mainly in long-term securities in euros (RentaFija Euro).
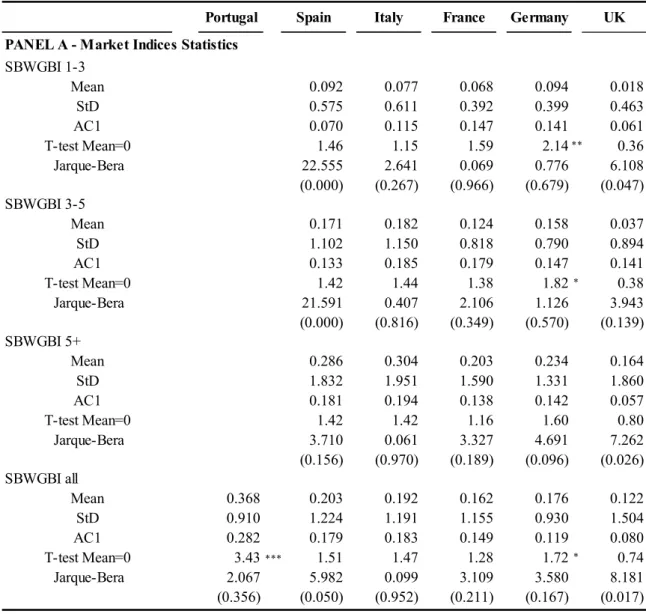
In terms of the volatility of the monthly premiums, UK bond funds clearly offer the highest standard deviation.
Overall Bond Fund Performance
- Unconditional Models
- Conditional Models
- Management Fees
- Concluding Comments
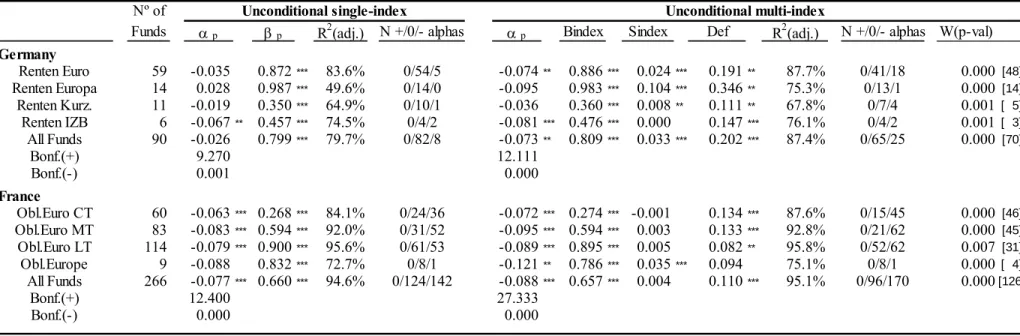
We present estimates of alphas (percentages) and regression coefficients with their significance based on errors adjusted for heteroskedasticity and autocorrelation (following Newey and West, 1987), as well as R2 (adj.) for each of the equally weighted asset portfolios. This table presents the coefficient estimates for the conditional beta function for equally weighted fund portfolios and for single and multiple index models. This table presents the coefficient estimates for the conditional alpha function for equally weighted fund portfolios and for single and multiple index models.
In Table 5.7, we report the estimates for the alphas using fund returns before expenses.
Performance Persistence
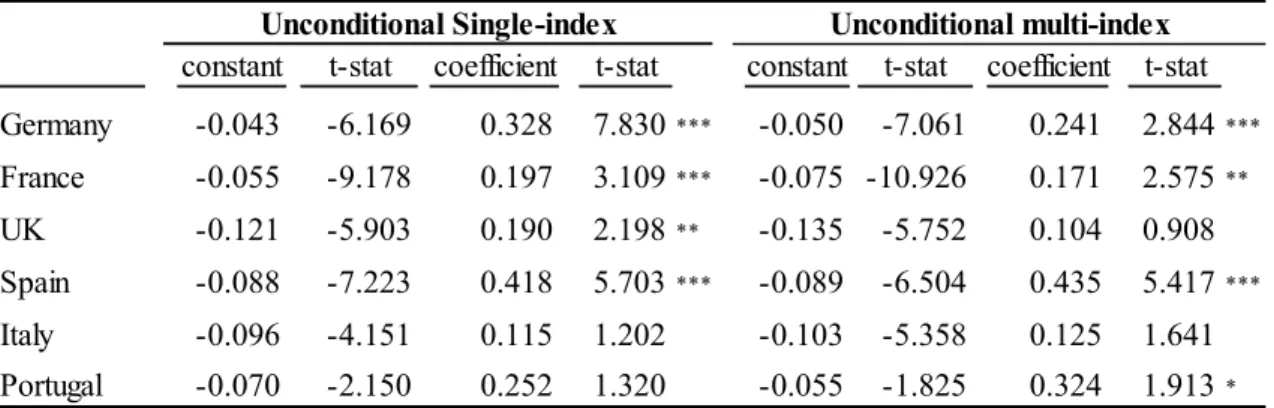
This table reports, for each European country, the statistics for the regression of the cross-sections of alphas for the sub-period January 1998 to December 2000 on alphas for the sub-period January 1995 to December 1997, considering the unconditional single and multi-index models. This table reports, for each European country, the statistics for the regression of alphas for the sub-period January 1998 to December 2000 on alphas for the sub-period January 1995 to December 1997, considering single and multi-index conditional models. This table reports, for each European country, the cross-sectional regression of excess returns for the sub-period January 1998 to December 2000 on alphas for the sub-period January 1995 to December 1997 considering the unconditional single and multi-index models.
This table reports for each European country the statistics for the cross-sectional regression of excess returns for the sub-period January 1998 to December 2000 on alphas for the sub-period January 1995 to December 1997 under conditional single and multi-index models.
Conclusions
Instead, they tend to invest based on marketing efforts or the general reputation of the bank. As well as an increase in the R2 (adj.), the two additional factors are statistically significant for a large number of funds. This apparent contradiction can be explained by the fact that the risk of the funds' underlying securities changes over time.
Moreover, we note that the evidence on persistence decreases when we consider conditional alphas, especially for the multi-index model, which indicates that some of the persistence phenomena may be driven by time-varying betas.