The manual provides detailed guidance on the design, preparation, certification, and use of PE samples necessary to ensure compliance with the requirements for analytical chemistry aspects of the USACE Environmental Quality Assurance (QA) Program as prescribed in ER 1110-l-263 and ER 1180 -1-6. Other branches of the Department of Defense (DOD), other federal agencies, and interested parties (commercial laboratories): scientific validity and legal soundness of the PE tests and proficiency testing.
Acronyms and Definitions
Roles, Responsibilities, and Qualifications
EP sample providers include several government agencies, including two environmental laboratories under the USACE Environmental Research and Development Center (ERDC) and the United States Environmental Protection Agency (USEPA). Laboratories involved in proficiency testing must explicitly follow the PE sample analysis requirements and data reporting plan (see Section 6.1.5 of Chapter 6).
Fees, Budget, and Funding
Fees. The unit cost of PE samples includes material and labor costs for development,
Budget Request and Funding. Budget requests to HQUSACE should be made annually by the Program Manager and include proposed tasks such as PE program operation and PE sample
Effective Date and Amendment
A PE sample is a physical sample that is representative of a relevant matrix and contains one or more analytes of interest at concentration levels unknown to the laboratories being assessed. PE samples are used to evaluate a laboratory's analytical and reporting performance under prescribed conditions against a set of criteria.
Purposes of PE Samples
Types of PE Samples
Blindness. Based on the degree of blindness of the identity of PE samples, PE samples are classified as single or double blind
Compared to double-blind PE samples, single-blind PE samples are unknown to the laboratory. Double-blind PE samples mimic field samples in analytes, concentrations, matrices, interferences, packaging and related sample documentation.
Requirements of PE Samples
Sample Certification. Because PE sample results can be used to disqualify a laboratory from being awarded a contract or to reject the analytical data produced by a laboratory, the quality of PE
General Design Considerations
Specific Design Considerations
- Methods. General method considerations include the following
- Challenging Analytes. It is common to include both more and less challenging target
- False Positives and False Negatives. False positives or negatives are serious but
- Concentrations. Concentration of PE samples should be determined using these guidelines
- Quality Assurance/Quality Control. Use proper design and different types of PE samples to
- Verification of Solid PE Samples. For soil and sediment PE samples, following these guidelines for monitoring stability
- Unstable PE Samples. The following steps are taken for unstable PE samples to ensure equivalent PE samples
- Amount. Use these guidelines to determine PE sample amount
- Safety. Because hazardous and toxic chemicals are used to prepare PE samples, safety guidelines to consider include
- Cost. Proficiency testing is an effective but also expensive way to evaluate laboratory
- Documentation and Record Keeping. The PE Sample Providers must
For example, analytical methods for metallic PE samples depend on the metallic elements, concentrations and project requirements. Use "full volume" PE samples (unless stability is a concern) that mimic the compositions of field samples to evaluate the entire laboratory (sample handover, preparation, analysis, method selection, record keeping, and data validation and reporting).
Customization
Double Blindness. To conceal the identity of double blind PE samples, follow these guidelines
The trend to replace paper documentation with electronic documentation is rapidly increasing and the data management practices used to protect the integrity of electronic data are becoming increasingly important. Manufacturing PE samples from authenticated compositions requires careful planning to ensure that PE samples reach their intended purpose.
Selection of PE Sample Matrices
Reagent Water Matrix. Use reagent water that is free of contaminants of concern at MDL for preparation of aqueous PE samples by following these guidelines
Contaminated soils can be used after purification by acid washing, solvent extraction or thermal treatment. To mimic field samples, real-world environmental matrices such as ash water, surface water, groundwater, soil, and sediments can also be used to prepare PE samples.
Selection of Chemicals and Reagents
- Concentration. Determine the concentration or purity of all starting materials by various procedures that are listed below in an order of increasing uncertainty
- Certified Reference Materials. When commercially available reference materials are utilized as PE samples or used to prepare PE samples, follow these guidelines
- Chemical Compositions. Determine chemical compositions using these guidelines
- Selection of Matrix. After matrix selection
Establish acceptance limits for target analytes in PE soil samples based on the same preparation and analysis methods to be evaluated. Collect actual results of Karl Fisher analysis to determine the concentration of PE samples if the standard is hygroscopic.
Facility and Equipment Requirements
- Facility. Facility requirements include the following
- Balances. Standards for balances include
- Ovens and Furnaces. Guidelines for oven and furnace use include
- Thermometers. Standards for thermometers include
- pH Meters. Guidelines for pH meter use include
- Volumetric Glassware. Standards for volumetric glassware use include
Check each balance daily (or with use) with two ASTM Class 1 or equivalent weights that include the expected weight range. Standardize the pH meter at least daily with two buffers that determine the expected pH range.
Preparation of PE Samples
Fortified PE Samples. General guidelines regardless of matrix are given below followed by fortification techniques for aqueous and soil PE samples
- General guidelines. Prepare fortified PE samples of any matrix using these guidelines
- Aqueous PE Samples. Aqueous PE samples can be prepared by either gravimetric or volumetric methods depending on the physical properties of bulk materials
- Soil PE Samples. Soil PE samples are prepared with clean soils in bulk or in small quantity
Use bulk PE samples for stable target analytes and subsample for long-term use. The choice of a particular method depends on the chemical properties of the target analytes and the stability of the PE samples.
Handling and Storage of PE Samples
Packing and Shipping. Follow these guidelines for packing and shipping to ensure the integrity and quality of the PE samples
PE sample reference values are concentration values assigned to target analytes that are assumed to be within statistical limits. PE samples sent to each laboratory must be equivalent to the PE samples on which the acceptance limits were determined. Prior to determining acceptance limits, the homogeneity, stability and reproducibility of PE samples must be determined and proven within limits to ensure equivalent samples.
Initial Verification of PE Sample Composition
Although the composition of spiked PE samples is well known, perform an initial check to ensure that the mean measured concentrations are within the prepared values. Determine the composition of actual PE samples through appropriate qualitative and quantitative analyzes in addition to analytical methods used for laboratory evaluation. The composition of the actual PE samples is therefore based on the mean value of the measured concentrations.
Ensuring Homogeneity, Stability, and Reproducibility
- General Guidelines
- Stability
- Spiking Standards
- Spiking Standards
- PE Sample Homogeneity
Check the stability of the spiked soil PE samples and the spike reagents routinely and before use to ensure that no significant changes in analyte concentrations have occurred. Check the homogeneity of PE materials by analyzing replicate PE samples from different sections of the bulk PE sample materials. Most real-world soil or sediment samples are very stable under proper storage conditions.
Testing for Homogeneity, Stability, and Reproducibility
Experiment Design
Statistical Analysis. Guidelines for statistical analysis include
Stability. Stability is discussed for fortified and real-world PE samples along with guidelines for sample handling and spiking standards
- Between-Batch Testing
Performing tests on multiple PE samples (e.g. at least five or more) randomly selected from a production batch. To do this, compare the magnitude of the total intra-batch variances to the acceptance limits of PE samples. Select any number (e.g. at least five or more) of PE samples from different production batches.
Determination of Reference Values and Acceptance Limits
Determination of Reference Values. A reference value is usually derived from
Carefully test the reference values and the acceptance limits of PE samples both internally and externally before and during proficiency testing. Various other approaches can also be used to determine the reference values and acceptance limits of PE samples. The acceptance limits of reinforced aqueous PE samples can be determined by failure analyzes of the sample.
Hybrid Approach
Use it to verify the suitability of existing reference values and acceptance limits established by other approaches. Investigate possible causes of error if the revised reference values and acceptance limits differ substantially from the original values. Re-adjust the reference values and acceptance limits of PE samples based on additional (e.g. a minimum of 40 data points) new or pooled data.
Statistical Analysis
General Considerations. Before applying any statistical techniques to analytical data, a preliminary data review is conducted to determine whether the data support underlying assumptions or
Use the average measured value of the results of reference laboratories to establish reference values. Use the 99% and 99.9% confidence intervals around the mean measured value to establish initial acceptance limits. Statistically analyze PE results from peer laboratories regularly to check for significant variations in bias and precision of PE sample analysis.
Distribution Tests. Chemical data can usually be analyzed using normal or Gaussian statistics
Acceptance limits should not be determined by data sets that are strongly influenced by outliers. Outlier statistical tests provide the data and, therefore, are suspected of misrepresenting the population. Perform a statistical analysis of the data set (eg, mean and standard deviation) on both the full (outliers included) and trimmed (outliers excluded) data sets to measure the effect of data removed.
Other Considerations
Data Comparability. All PE samples must be analyzed with the same methodology by
Use the results of all PE sample analyzes to develop control charts that show true. USACE may adjust the acceptance limits for any PE sample to compensate for unexpected problems with a particular sample or analysis. Each PE sample provider must have, within its own dedicated facility, the ability to design, manufacture, test and distribute PE samples, and within its own dedicated facility the ability to design, manufacture, test and distribute PE samples and provide data analysis and reporting capabilities for any batch of PE samples .
Documentation
Use the results to adjust the limits of acceptance to observe the relative performance of each laboratory using a given protocol compared to peers.
Standard Operating Procedures
Confidentiality and Ethical Considerations
- PE Sample Providers. Concerns include the following
- Overview. The USACE laboratory validation process for HTRW environmental projects consists of five major sequential steps
- Metal PE Samples. For metal analysis, the laboratory validation is granted based on a combination of the analytical methods used and the number of metal elements in the PE samples
- Analytical Methods. Standard analytical methods from the following sources are usually required for USACE’s HTRW environmental projects and hence for the analysis of PE
- Approval for Modified Analytical Methods. Because the acceptance limits of PE samples are developed for specific combinations of sample preparation and analytical methods,
- Laboratory Analysis. A laboratory shall treat PE samples as regular field samples and follow the specified methods and any sample-specific instructions to analyze and report PE
- Evaluation of PE Sample Results. Acceptance limits and evaluation criteria of PE samples are discussed below
- Evaluation Report. Within ten calendar days after receipt of PE sample results, the PE Sample Provider shall prepare and send a written evaluation report to the Program Manager for
- Status of Proficiency Testing. The Program Manager will review the evaluation report and determine the pass/fail status of each PE sample based on the statistically established
- Tentatively Identified Compounds (TIC). Some non-target analytes may exist in the
Any changes or modifications in preparation or analysis methods for PE samples must be approved by the program director. The number of target analytes is based on the target analytes in the PE samples instead of the number of analytes specified in the analytical methods. The majority of PE samples available from the USACE are inland water and/or soil/sediment matrices.
Post-Contract Performance Monitoring
Continual Performance Monitoring. In order to measure laboratory performance after the validation process, the Program Manager may send additional PE samples on a quarterly or as
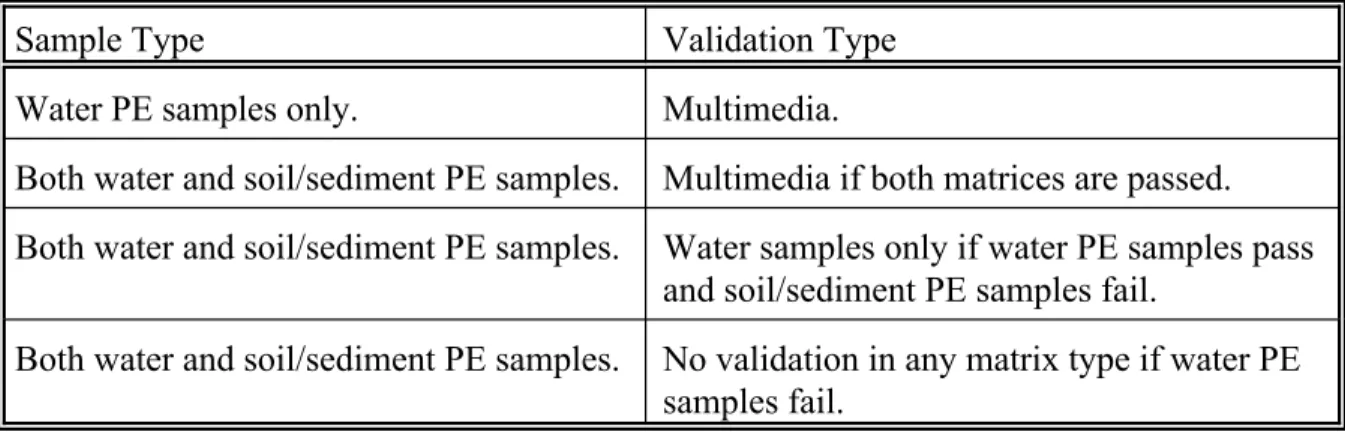
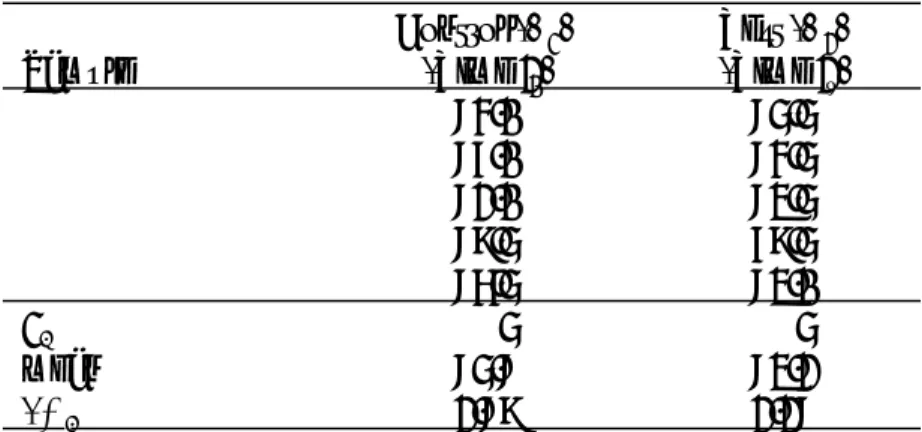
See the following table for assigned water and/or soil/sediment matrix validation types. Based on the deficiencies and responses, the program manager may send additional PE samples or conduct additional inspections to verify and evaluate corrective actions. At the request of the customer(s), the Program Manager will send PE samples for laboratory performance evaluation during field sampling.
Special Requests for Proficiency Testing. Upon request from a customer(s), the Program Manager will send PE samples to evaluate laboratory performance during field sample
Complaints and Corrective Actions
Program Manager. The Program Manager shall investigate and resolve all complaints regarding the proficiency testing program within 20 calendar days from receipt of complaints
Required Publications
Statistical interpretation of data – estimation of the mean – confidence interval.” Geneva, Switzerland: International Organization for Standardization, 1980. General Requirements for the Competence of Calibration and Testing Laboratories.” Geneva, Switzerland: International Organization for Standardization, 1990. General Requirements for the Competence of Testing and Calibration Laboratories.” Geneva, Switzerland: International Organization for Standardization, 1999.
Related Publications
Quality management and quality system elements - Part 2: Guidelines for services.” Geneva, Switzerland: International Organization for Standardization, 1991. Quality Management and Quality System Elements - Part 3: Guidelines for Processed Materials.” Geneva, Switzerland: International Organization for. Calibration in Analytical Chemistry and Use of Certified Reference Materials.” Geneva, Switzerland: International Organization for Standardization, 1997.
Pierre Gy’s Sampling Theory
Maximum Allowable Particle Size. Using the above assumptions for density and shape factor, this equation can be rearranged to calculate the largest particle size that can be
The tighter the precision required, the larger the sample mass and/or the smaller the particle size. This table assumes that the soil particle has a typical spherical shape and serves as an example of how the maximum allowable particle size changes as a function of these parameters. Maximum allowable particle size that can be captured by a given sub-sample mass at several percent relative standard deviation (RSD) recommended.

Distribution Test
Normal Probability Plot
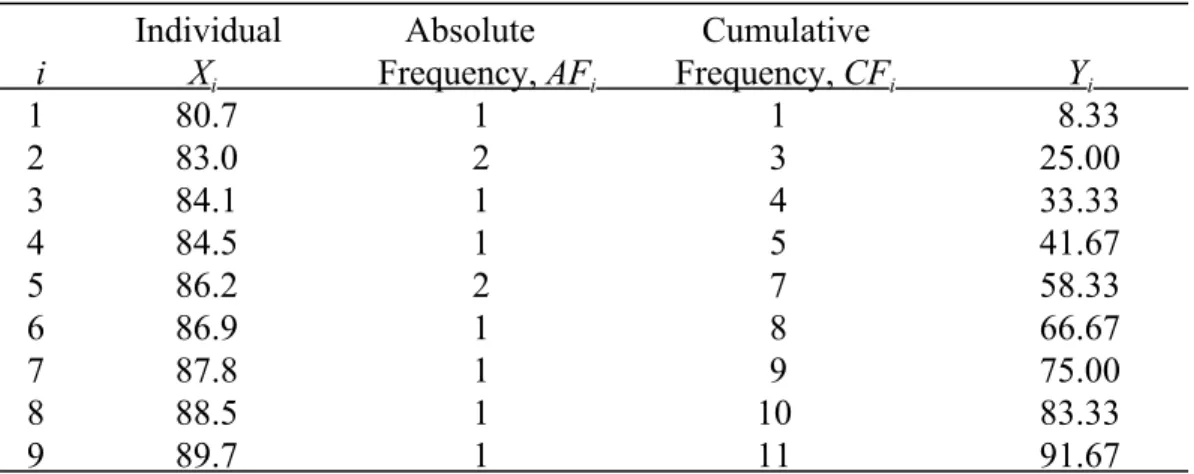
- Procedure. Follow these steps to perform a normal probability plot
Follow these steps to perform a normal probability plot:. Xn) from the lowest to the highest. If the plot of these pairs forms approximately a straight line, the data are probably normally distributed.
Outlier Test
Purpose. Outliers are measurements that are extremely large or small compared with the rest of the sample data and are suspected of misrepresenting the population from which they were
Grubbs’ Test
If G exceeds the critical value in Table F-1 of Appendix F, either X1 and/or Xn is the outlier depending on the test statistic. Because the mean and standard deviation are sensitive to the distribution of the data, a normality test is first performed on the data set. A normal probability plot shows that there is no reason to suspect that data with no suspicious differences are not normally distributed.
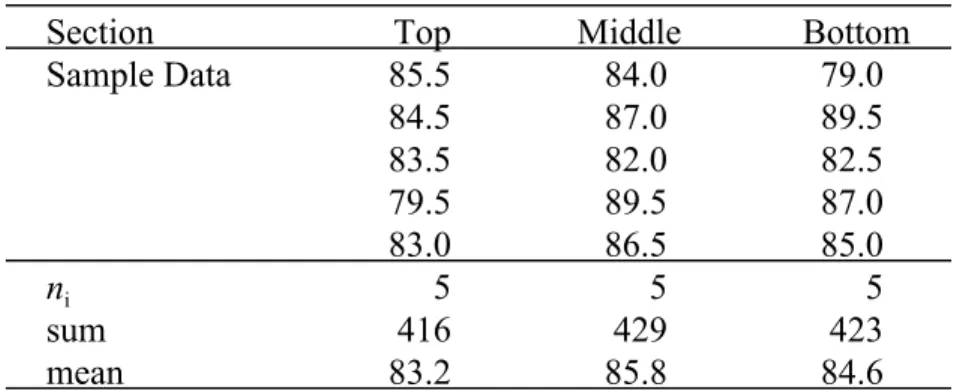
Homogeneity Test
Procedure. To test the homogeneity of bulk PE sample material in a container, follow these steps
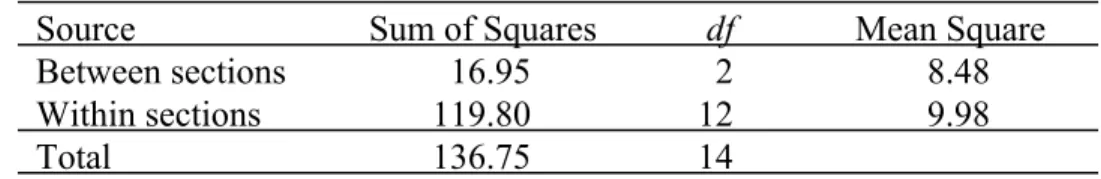
Sum of squares (within) = variability within sections Sum of squares (between) = variability between sections Sum of squares (total) = total variability. Interpreting results: If F is less than the critical value at a significance level of 0.05, the material is considered homogeneous. If F is greater than the critical value, but the total standard deviation of samples, i.e. the square root of Sum of Squares (total), is less than 0.3F, where F is the target standard deviation of proficiency tests, the material can still be considered as be considered homogeneous.
Stability Test
F Test
- Procedure. To perform an F test, following these steps
Calculate the sample variances, SD12 and SD22, and the test statistic, F-ratio, where SDA2 is the larger of the two variances. Interpreting results: If F < F1!"/2, there is no evidence that the two variances of the two populations are different. Since F is less than F0.975, there is no evidence that these two variances are different with a confidence level of 95% level.
Student’s Two-Sample t Test
If the variances of the two samples are not equal, use the Satterthwaite t-test (see Section E.6.4). Calculate the pooled standard deviation (SDP) as follows. The SDP below uses the SDi values from the example table.). Since t Ý t0.025, there is insufficient evidence to reject the null hypothesis, i.e. the data do not provide sufficient evidence to suggest that PE patterns are unstable.
Satterthwaite’s t Test
Use at least five samples, randomly selected from the production at the beginning and end of the proficiency testing study. Perform the analysis at the beginning and end of the proficiency test period. The procedure and an example of the basic Mann-Kendall trend test are shown below.
Reproducibility
The null hypothesis, HO: no trend, versus the alternative hypothesis HA: either an upward or downward trend at significance level is used for a trend test of sample stability. After examining the data below in Table E-7, the likely trend is clearly a downward trend. Since S = !4 < 0 and p = 0.242 Û, the null hypothesis is not rejected and there is insufficient evidence to conclude that there is a downward trend in concentration or instability of the PE sample at a significance level of 0.05.
If the within-batch component is less than 10% of the acceptance limits (i.e. 3F), the within-batch PE samples are considered sufficiently reproducible.
Prediction Intervals
For the USACE PE program, the prediction intervals containing the next result of a proficiency test with a confidence interval of 95% and 99% are used to determine the proficiency acceptance limits. Other procedures are also available for constructing prediction intervals that do not make assumptions about distribution type; however, they are beyond the scope of this Annex. Factors for determining two-tailed prediction intervals for the next observation given previous sample of size n.