The ability of the immune system to recognize and eliminate antigens, contributing to homeostasis, is well established. Immune tolerance is one process that favors a tumor to escape the immune response, leading to tumor progression. Tumor demonstration and depletion assays were performed once to confirm the success of the assays.
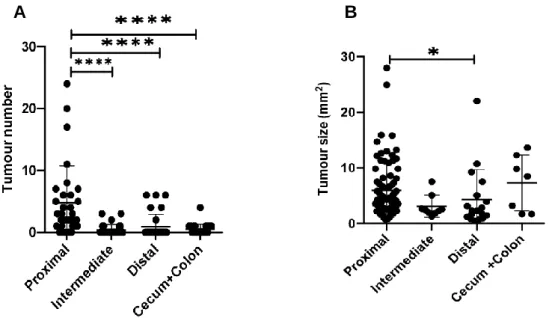
A portion of the animals were euthanized 120 days after induction, the other portion remained for survival when they were euthanized when they died. Each point represents a different animal (n=31); (B) Size of lesions in mm2 in each region of the intestine.
Introduction
- The immune System
- T lymphocyte development
- Inhibition of immune response by Regulatory T cells
- Natural Regulatory T cells
- Induced Regulatory T cells
- The immune System and Cancer
- Cancer Immunoediting
- Elimination Phase
- Equilibrium phase
- Escape phase
- Duality of Tregs cells in carcinogenesis
- Immunotherapy
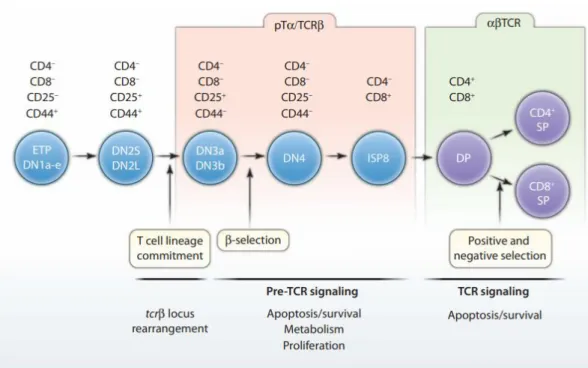
In the α:β lineage, T cells presenting the αβ TCR can differentiate into two functional subsets: CD4+ T cells and CD8+ T cells. In the next step (DN2), cells begin to express the CD25 protein and become irreversibly committed to the T cell line. CD25 is the α-chain of the interleukin 2 receptor (IL-2R), important in the maturation and maintenance of lymphoid cells.
Treg cells were first discovered in the 1970s with the description that these cells play a major role. Immature T cells go through several double-negative (DP) steps until they reach mature T cells (SP) and are ready to circulate in the periphery. In the peripheral blood of healthy humans, Treg cells constitute approximately 2–5 percent of the CD4+ T cell population [ 18 ].
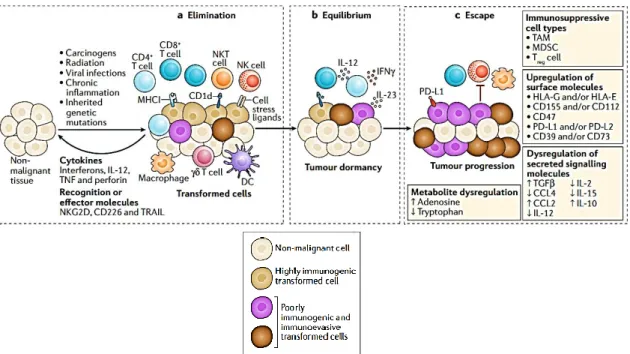
Several autoimmune diseases arising from deficiencies in various Treg cell functions demonstrate the crucial role of these cells in immune control [24]. One of the main roles of iTregs is the inhibition of inflammatory immune responses to the commensal microbiota, especially bacteria found in mucosal tissues such as the gut. Tumor cells that escape the elimination process and their growth is limited, with cellular immunogenicity edited by the immunoadaptive system, are in the equilibrium phase.
Tumor cells are detected by the immune system, which cooperates to eliminate these altered cells in the elimination phase and reflects the basic premise of immune surveillance [ 45 ]. In this way, the dynamic stability between the immune system fighting against tumor cells occurs in the equilibrium phase, which can last several years, even if there is no complete eradication. Immune selection causes cells that survive the immune system to become more resistant, allowing them to proliferate and create new clonal populations in the tumor [48].
Recently, monoclonal antibodies have been developed and used in the clinic, which bind to immune checkpoint molecules and inhibit them. Therefore, the role of regulatory T cells in the tumor and metastatic niche differs from what occurs naturally in the immune and circulatory systems.
Aim
Materials and Methods
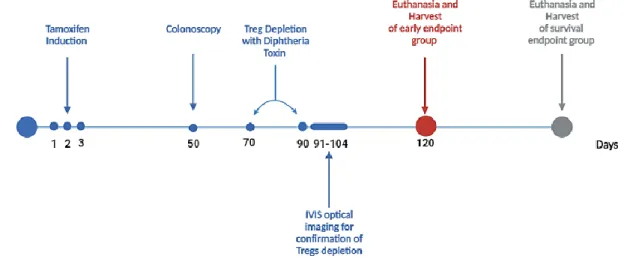
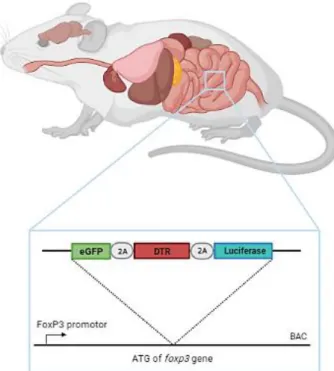
This animal model allows, in addition to the ablation of cells, the observation of the population through the bioluminescence emitted by the presence of luciferase in the presence of its substrate, D-luciferin. We first proceeded to characterize the animal model Lrig1CreERT2/+; Apcflox/+, which consisted of quantifying the number and area of tumor, developed along the intestinal tract. Following the characterization and better understanding of the animal model, we proceeded with the ablation of Tregs by diphtheria toxin injection at days 70 and 90 after tamoxifen-driven tumor induction.
Flow cytometry revealed fewer Treg cells in the treated animal compared to the untreated animal (Figure 12). The RLU obtained in D0 was approximately 60% in the whole body of the DT-treated animal. 41 When compared to the bioluminescence of the control animal; the emissions were much lower in DT-treated mice.
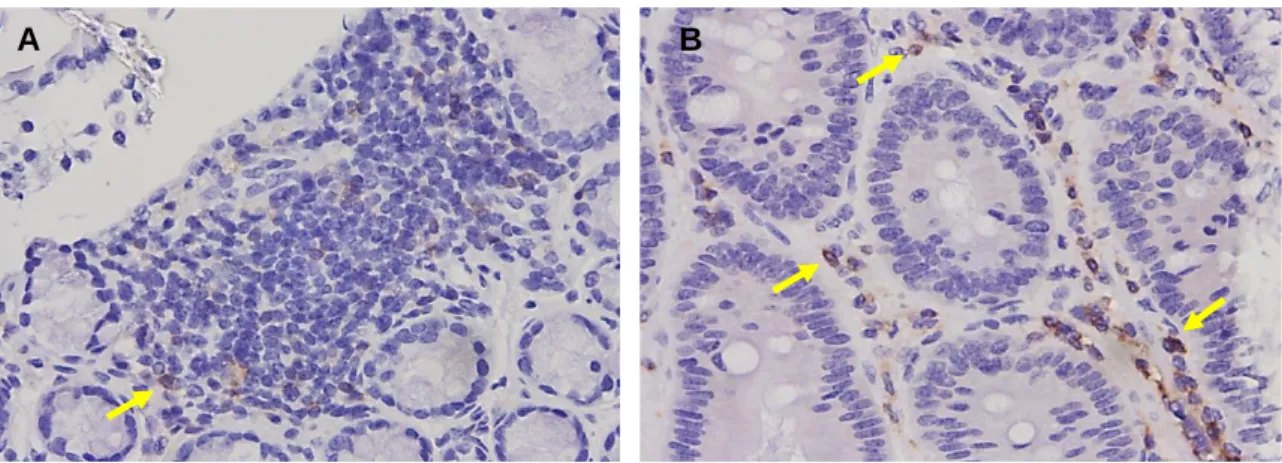
For statistical purposes, we pooled the total number of lesions along different regions of the intestinal tract. With this we can determine if the neoplastic development has an immunosuppressive effect, assessed by the number of immune cells present in the central and peripheral regions of the lesions. By IHC we saw significant infiltration by Tregs in normal tissues adjacent to the tumor, but not in the center of the tumor (Figure 20).
We promoted the depletion of Treg cells and investigated how this could affect the formation of lesions, with respect to their size, quantity and survival of the animals. Regarding the ex vivo image, we performed an analysis of the intestines of the untreated and DT-treated mice. In untreated mice, bioluminescence was medium to intense, reaching almost the entire length of the intestine.
Most likely, the extended lifespan of animals in the survival experiment allows DT-treated animals to recover enough of the population of Tregs that leads to a "catch-up". At the same time, the research can be extended to uncover the origin of the Tregs, specifically whether they originate in the thymus or peripherally.
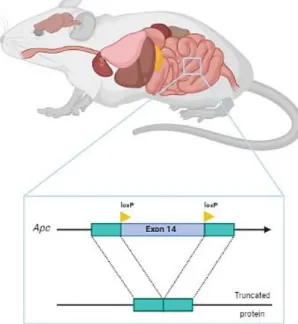
Mice model
Tumor induction
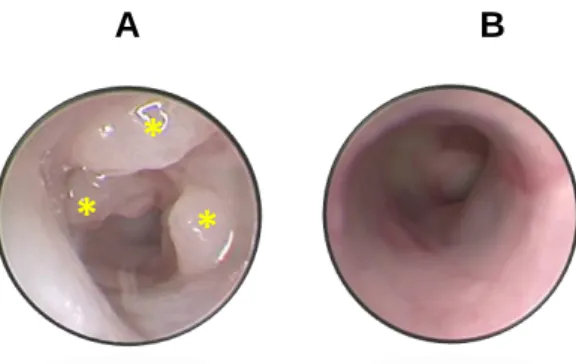
Tumor induction in Lrig1CreERT2/+; Apcflox/+; In FoxP3.LuciDTR animals, it was induced by a 100 µL injection of tamoxifen and was performed for three consecutive days by intraperitoneal administration. 100 mg of tamoxifen (Sigma Aldrich: T-5648) was added to 5 ml of pre-warmed corn oil (Sigma Aldrich C-8267) to obtain a final concentration of 20 mg/ml of tamoxifen solution and kept for 24 hours in a thermos at 37 °C . C. To confirm whether the animals developed tumors, a colonoscopy was performed on day 50 after induction using the Mainz Coloview miniendoscopy system (KARK STORZ, Tuttlingen, Germany).
Blood samples were collected 24 h after the second DT injection for flow cytometry analysis and observation of Treg cell depletion. All animals were euthanized at 120 post-induction or as soon as symptoms of anemia, weight loss, rectal prolapse due to asphyxiation in the CO2 chamber, and cervical dislocation appeared.
Collection of cells from tumor, LNs and Spleen
Immunohistochemistry assay
Immunophenotyping of T cells
Statistical Analysis
Results
Impact of tumor-infiltrating Tregs in an animal model of intestinal carcinogenesis
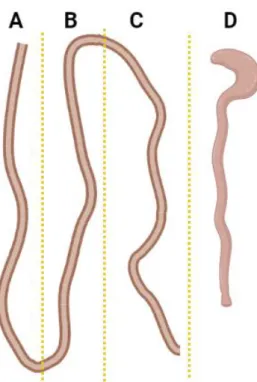
For the purpose of quantification of lesions, we divided and cut the small intestine into three regions of equal size: proximal, intermediate, and distal (Figure 9). We observed that the mean number of tumors in the proximal region of the small intestine is higher relative to other regions, including the cecum and colon (p<0.0001) (Figure 10). We also observed that three animals in the DT-treated group had a survival time of approximately 350 days, similar to two untreated animals. The mean number of lesions in the intestinal tract was higher in the untreated group with early terminal animals (p<0.01).
Larger tumors were observed in untreated (p<0.01); (B) Number of tumors in untreated (n=3) and DT-treated (n=5) animals in the survival group. The immunohistochemistry (IHC) test was performed to visually evaluate the infiltration of certain populations of immune cells in the neoplastic lesions collected from the small intestine, colon and cecum. Regarding CD3+ cells, we observed greater abundance in the tissues of animals treated with DT compared to the tissues of untreated mice (Figure 18).
In the early stages of human CRC, Treg cells can generate a pro-inflammatory environment that affects tumor progression. 49 In the second injection with DT, we collected peripheral blood from a DT-treated and untreated animal. For the in vivo images, we injected the luciferase substrate (D-Luciferin) into the untreated and DT-treated animals after the second dose of DT.
In the gate of CD4+ T cells, we observed the population of tumour-infiltrating Treg cells, as expected, but also a population of CD25-FoxP3+ T cells. In this study, the primary goal was to understand Treg cell activity in a preclinical model Lrig1CreERT2/+;Apcflox/+; Foxp3.LuciDTRthat develops multiple lesions in the gut. All animals used in this study developed tumors in the intestinal tract, but they were divided into two groups: non-treated and DT-treated animals.
The results showed the presence of tumor-infiltrating Tregs in non-depleted animals, with higher concentration in the peripheral region. Elkord, “Regulatory T cells in the tumor microenvironment and cancer progression: Role and therapeutic targeting,” Vaccines , vol.
Ablation of Tregs results in increased number of tumors in Lrig1 CreERT2/+ ;Apc flox/+ ;
Ablation of Treg cells results in distinctive tumor immunophenotypes
In the flow cytometry analysis, we first focused on CD3+ CD4+ populations (CD4 T cells) to finally visualize Treg cells as those labeling for FoxP3, and either positive or negative for the CD25 marker (Figure 21) CD25+FoxP3+ T cells are known as Tregs, while CD25-Foxp3+ T cells are considered a heterogeneous and unstable population with diverse and sometimes opposing functions, capable of acting as a reservoir of T cells. The emission of photons observed in the untreated animal almost reached its peak in regions where there are lymphoid organs such as the thymus, inguinal lymph node and peritoneal area, while the DT-treated animal emitted reduced bioluminescence. Changes in the microbiome can affect tumor growth kinetics and also in numbers, especially in intestinal tissues [75] [76].
We were able to confirm the presence of tiTregs in neoplastic lesions, despite observing a high density of staining in the tissue adjacent to the tumor tissue, a small population of tiTregs was identified in the intratumoral region. To overcome these obstacles, it is suggested to increase the number of animals per treatment group and to repeat the IHC tests for anti-CD3, anti-CD4, anti-CD8 and anti-FoxP3 antibodies to identify the cells present in the lesions. to better quantify. Kondo, "Cell interactions in the induction of tolerance: the role of thymic lymphocytes." Immunology, vol.
Nishikawa, "Regulatory T (Treg) celler i cancer: Kan Treg celler være et nyt terapeutisk mål?" Cancer Sci., vol. Terme et al., "VEGFA-VEGFR Pathway Blockade Inhibers Tumor-Induced Regulatory T-cell Proliferation in Colorectal Cancer," Cancer Res., vol. Liu et al., "IL-35 Regulates Function of Immune Cells in Tumor Microenvironment," Frontiers in Immunology, vol.
Vidotto et al., “PTEN-deficient prostate cancer is associated with an immunosuppressive tumor microenvironment mediated by increased IDO1 expression and infiltration of FoxP3+ T regulatory cells.” Prostate, vol. Chen et al., “Expression of CD4+CD25+ regulatory T cells and Foxp3 in peripheral blood of gastric carcinoma patients,” J. De Simone et al., “Transcriptional landscape of human tissue lymphocytes reveals tumor-infiltrating T regulatory uniqueness. Cells.,” Immunity, vol.
Tomkovich et al., "Locoregional Effects of Microbiota in a Preclinical Model of Colon Carcinogenesis," Cancer Res., vol. Komatsu et al., "Pathogenic Conversion of Foxp3+ T Cells to TH17 Cells in Autoimmune Arthritis." Wet.