Slums and Pandemics
Luiz Brotherhood, Universitat de Barcelona
Tiago Cavalcanti, University of Cambridge, FGV EESP & CEPR Daniel Da Mata, FGV EESP
Cezar Santos, Banco de Portugal, FGV EPGE & CEPR September 2020
1
Introduction
New coronavirus:
• Spread through close contact among people
• Recommendation: social distancing, more handwashing, face cover and avoid crowded places
• Problem in slums:
• High density; poorer individuals; low access to health care
• Over 1 billion people live in slums (UN, 2020)
This paper:
• Empirics: daily location of millions of mobile phones in Brazil
• Model: choice-theoretic heterogeneous-agent GE
• Quantitative:
• Role of slums
• Policies: lockdowns, cash transfers, public ICU beds
Introduction
New coronavirus:
• Spread through close contact among people
• Recommendation: social distancing, more handwashing, face cover and avoid crowded places
• Problem in slums:
• High density; poorer individuals; low access to health care
• Over 1 billion people live in slums (UN, 2020) This paper:
• Empirics: daily location of millions of mobile phones in Brazil
• Model: choice-theoretic heterogeneous-agent GE
• Quantitative:
• Role of slums
• Policies: lockdowns, cash transfers, public ICU beds
2
Source: Silvia Izquierdo/AP
Insights
Empirics:
• Daily location of phones in São Paulo and Rio de Janeiro
• Social distance increases with NPIs
• Social distance increases less in slums and more deaths
Model calibrated to Rio de Janeiro Role of slums:
• More deaths (30%) than fraction of population (22%)
• Without slums: similar deaths overall; more in other areas Policies:
• Public ICUs: both groups are better off
• Mild lockdowns mitigate demand for hospital beds
• Strict confinements mostly delay the pandemic
• Cash transfers: delay and benefits slum dwellers
4
Insights
Empirics:
• Daily location of phones in São Paulo and Rio de Janeiro
• Social distance increases with NPIs
• Social distance increases less in slums and more deaths Model calibrated to Rio de Janeiro
Role of slums:
• More deaths (30%) than fraction of population (22%)
• Without slums: similar deaths overall; more in other areas
Policies:
• Public ICUs: both groups are better off
• Mild lockdowns mitigate demand for hospital beds
• Strict confinements mostly delay the pandemic
• Cash transfers: delay and benefits slum dwellers
Insights
Empirics:
• Daily location of phones in São Paulo and Rio de Janeiro
• Social distance increases with NPIs
• Social distance increases less in slums and more deaths Model calibrated to Rio de Janeiro
Role of slums:
• More deaths (30%) than fraction of population (22%)
• Without slums: similar deaths overall; more in other areas Policies:
• Public ICUs: both groups are better off
• Mild lockdowns mitigate demand for hospital beds
• Strict confinements mostly delay the pandemic
• Cash transfers: delay and benefits slum dwellers 4
Modeling infectious diseases
SIRmodels in epidemiology (Kermack & McKendrick 1927,...):
• Susceptible (= initially healthy)
• Infected
• Recovered (or deceased)
Number of additional infections caused by an infected person:
• R≈ R0
|{z}
Basic Reproductive
Number
×Susceptiblet
• Covid-19: R0=1.4–5
Modeling infectious diseases
SIRmodels in epidemiology (Kermack & McKendrick 1927,...):
• Susceptible (= initially healthy)
• Infected
• Recovered (or deceased)
Number of additional infections caused by an infected person:
• R≈ R0
|{z}
Basic Reproductive
Number
×Susceptiblet
• Covid-19: R0=1.4–5
5
Economics and infectious diseases
Theory adding behavior to SIR models(seminal: Kremer (1996))
Earlier quantitative work:
• HIV: Greenwood, Kircher, Santos & Tertilt (2019, 2017, 2013), etc.
Economics and Covid-19 (fast-growing):
• Containment and behavior:
• Eichenbaum, Rebelo & Trabandt (2020), Farboodi, Jarosch &
Shimer (2020), Toxvaerd (2020), etc.
• Heterogeneity:
• Brotherhood, Kircher, Santos & Tertilt (2020), Alon, Kim, Lagakos
& VanVuren (2020), Kaplan, Moll & Violante (2020), Glover, Heathcote, Krueger & Rios-Rull (2020), etc.
Equilibrium models and slums:
• Cavalcanti, Da Mata & Santos (2019), Ferreira, Monge-Naranjo &
Pereira (2016)
Economics and infectious diseases
Theory adding behavior to SIR models(seminal: Kremer (1996))
Earlier quantitative work:
• HIV: Greenwood, Kircher, Santos & Tertilt (2019, 2017, 2013), etc.
Economics and Covid-19 (fast-growing):
• Containment and behavior:
• Eichenbaum, Rebelo & Trabandt (2020), Farboodi, Jarosch &
Shimer (2020), etc.
• Heterogeneity:
• Brotherhood, Kircher, Santos & Tertilt (2020), Alon, Kim, Lagakos
& VanVuren (2020), Kaplan, Moll & Violante (2020), Glover, Heathcote, Krueger & Rios-Rull (2020), etc.
Equilibrium models and slums:
• Cavalcanti, Da Mata & Santos (2019), Ferreira, Monge-Naranjo &
Pereira (2016)
7
Empirics
Data source:
• Provided by Inloco (inloco.com.br)
• Track mobile phones with 3-meter accuracy
• About 60 million mobile phones in Brazil, ensuring privacy Our data:
• Daily social distance index: % of phones away from home
• Feb 1 to May 30, 2020
• Non-overlapping hexagons for Sao Paulo (1,301) and Rio de Janeiro (841)
• Merge with socioeconomic data from census
Social distance and NPIs
Rio de Janeiro Sao Paulo
Day of first NPI = March 11
.2.3.4.5.6.7Social Distancing Index
feb mar apr may may
Days
Day of first NPI = March 13
.2.3.4.5.6.7Social Distancing Index
feb mar apr may may
Days
9
Social distance: slums and other areas (reduced form)
Rio de Janeiro Sao Paulo
-.06-.04-.020.02Effect
1-FEB 10-MAR 30-MAY
Days
-.06-.04-.020.02Effect
3-FEB 12-MAR 30-MAY
Days
Social distance: Share of slums (reduced form)
Rio de Janeiro Sao Paulo
-.15-.1-.050.05Effect
1-FEB 10-MAR 30-MAY
Days
-.15-.1-.050.05Effect
1-FEB 12-MAR 30-MAY
Days
11
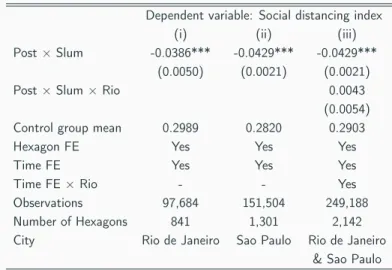
Social distance: slums and other areas (reduced form)
Table 1: Average impact of NPIs on social distancing
Dependent variable: Social distancing index
(i) (ii) (iii)
Post×Slum -0.0386*** -0.0429*** -0.0429***
(0.0050) (0.0021) (0.0021)
Post×Slum×Rio 0.0043
(0.0054)
Control group mean 0.2989 0.2820 0.2903
Hexagon FE Yes Yes Yes
Time FE Yes Yes Yes
Time FE×Rio - - Yes
Observations 97,684 151,504 249,188
Number of Hexagons 841 1,301 2,142
City Rio de Janeiro Sao Paulo Rio de Janeiro
& Sao Paulo
Slums and Covid-19 fatalities
Rio de Janeiro Sao Paulo
Sao Paulo: Hexagons with slums have 11% more hospitalizations and 10% more deaths by Covid-19 – and 36% more hospitalizations and 7% more deaths by other respiratory diseases
13
Model overview
Math
Model overview
Math 14
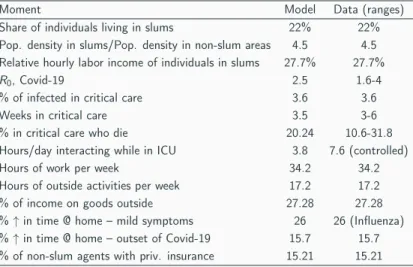
Fitting the Model to the Data - Model period is one week
Table 2: Moments – model vs. data
Moment Model Data (ranges)
Share of individuals living in slums 22% 22%
Pop. density in slums/Pop. density in non-slum areas 4.5 4.5 Relative hourly labor income of individuals in slums 27.7% 27.7%
R0, Covid-19 2.5 1.6-4
% of infected in critical care 3.6 3.6
Weeks in critical care 3.5 3-6
% in critical care who die 20.24 10.6-31.8
Hours/day interacting while in ICU 3.8 7.6 (controlled)
Hours of work per week 34.2 34.2
Hours of outside activities per week 17.2 17.2
% of income on goods outside 27.28 27.28
%↑in time @ home – mild symptoms 26 26 (Influenza)
%↑in time @ home – outset of Covid-19 15.7 15.7
% of non-slum agents with priv. insurance 15.21 15.21
15
Baseline results
0 20 40 60 80 100
0 0.2 0.4 0.6 0.8 1
0 20 40 60 80 100
0 0.05 0.1 0.15 0.2 0.25
0 20 40 60 80 100
0 2 4 6 10-3
0 20 40 60 80 100
0 0.2 0.4 0.6 0.8 1
0 20 40 60 80 100
0 0.005 0.01 0.015
0 20 40 60 80 100
0.14 0.16 0.18 0.2 0.22 0.24
16
Baseline results
0 20 40 60 80 100
0.5 0.55 0.6 0.65 0.7 0.75 0.8
0 20 40 60 80 100
0.1 0.15 0.2 0.25 0.3 0.35
0 20 40 60 80 100
0.06 0.08 0.1 0.12 0.14 0.16 0.18
Baseline results
0 20 40 60 80 100
-10 0 10 20 30 40 50
0 20 40 60 80 100
-12 -10 -8 -6 -4 -2 0
18
Baseline results
Homog. Homog. Homog.
Benchmark Epidem. No slum densities wage rates age struct.
Wks to peak srsly ill (slum) 10.00 9.00 – 15.00 10.00 10.00
Wks to peak srsly ill (other) 11.00 10.00 14.00 14.00 11.00 11.00
Dead p/ 1,000 1year (slum) 10.04 13.78 – 6.32 8.87 13.49
Dead p/ 1,000 1year (other) 6.35 15.43 6.87 6.86 6.78 6.57
Dead p/ 1,000 1year (all) 7.16 15.06 6.87 6.74 7.25 8.11
Dead p/ 1,000 LR (slum) 10.11 13.78 – 6.53 9.07 13.68
Dead p/ 1,000 LR (other) 6.57 15.43 7.47 7.30 7.13 6.83
Dead p/ 1,000 LR (all) 7.35 15.06 7.47 7.13 7.56 8.34
Immune in LR (slum), % 74.33 91.60 – 51.78 70.11 72.37
Immune in LR (other), % 39.69 77.66 46.01 44.72 43.03 40.76
Immune in LR (all), % 47.36 80.75 46.01 46.28 49.03 47.76
GDP at peak - rel to BM 1.00 1.82 1.48 1.23 1.29 1.03
GDP 1year - rel to BM 1.00 1.14 1.17 1.00 1.17 0.99
Hrs @ home (slum) - peak 80.95 60.48 – 69.19 86.38 83.22
Hrs @ home (other) - peak 86.28 60.48 78.00 80.00 82.26 84.90 Value - healthy (slum) 1968.10 1962.10 – 1976.60 4305.90 1960.20 Value - healthy (other) 4317.40 4283.10 4315.00 4315.30 4315.60 4316.50 Value - healthy (all) 3797.00 3769.00 4315.00 3797.20 4313.50 3794.50
Baseline Model versus Epidemiological Model
Homog. Homog. Homog.
Benchmark Epidem. No slum densities wage rates age struct.
Wks to peak srsly ill (slum) 10.00 9.00 – 15.00 10.00 10.00
Wks to peak srsly ill (other) 11.00 10.00 14.00 14.00 11.00 11.00
Dead p/ 1,000 1year (slum) 10.04 13.78 – 6.32 8.87 13.49
Dead p/ 1,000 1year (other) 6.35 15.43 6.87 6.86 6.78 6.57
Dead p/ 1,000 1year (all) 7.16 15.06 6.87 6.74 7.25 8.11
Dead p/ 1,000 LR (slum) 10.11 13.78 – 6.53 9.07 13.68
Dead p/ 1,000 LR (other) 6.57 15.43 7.47 7.30 7.13 6.83
Dead p/ 1,000 LR (all) 7.35 15.06 7.47 7.13 7.56 8.34
Immune in LR (slum), % 74.33 91.60 – 51.78 70.11 72.37
Immune in LR (other), % 39.69 77.66 46.01 44.72 43.03 40.76
Immune in LR (all), % 47.36 80.75 46.01 46.28 49.03 47.76
GDP at peak - rel to BM 1.00 1.82 1.48 1.23 1.29 1.03
GDP 1year - rel to BM 1.00 1.14 1.17 1.00 1.17 0.99
Hrs @ home (slum) - peak 80.95 60.48 – 69.19 86.38 83.22
Hrs @ home (other) - peak 86.28 60.48 78.00 80.00 82.26 84.90 Value - healthy (slum) 1968.10 1962.10 – 1976.60 4305.90 1960.20 Value - healthy (other) 4317.40 4283.10 4315.00 4315.30 4315.60 4316.50 Value - healthy (all) 3797.00 3769.00 4315.00 3797.20 4313.50 3794.50
20
Role of Slums
Homog. Homog. Homog.
Benchmark Epidem. No slum densities wage rates age struct.
Wks to peak srsly ill (slum) 10.00 9.00 – 15.00 10.00 10.00
Wks to peak srsly ill (other) 11.00 10.00 14.00 14.00 11.00 11.00
Dead p/ 1,000 1year (slum) 10.04 13.78 – 6.32 8.87 13.49
Dead p/ 1,000 1year (other) 6.35 15.43 6.87 6.86 6.78 6.57
Dead p/ 1,000 1year (all) 7.16 15.06 6.87 6.74 7.25 8.11
Dead p/ 1,000 LR (slum) 10.11 13.78 – 6.53 9.07 13.68
Dead p/ 1,000 LR (other) 6.57 15.43 7.47 7.30 7.13 6.83
Dead p/ 1,000 LR (all) 7.35 15.06 7.47 7.13 7.56 8.34
Immune in LR (slum), % 74.33 91.60 – 51.78 70.11 72.37
Immune in LR (other), % 39.69 77.66 46.01 44.72 43.03 40.76
Immune in LR (all), % 47.36 80.75 46.01 46.28 49.03 47.76
GDP at peak - rel to BM 1.00 1.82 1.48 1.23 1.29 1.03
GDP 1year - rel to BM 1.00 1.14 1.17 1.00 1.17 0.99
Hrs @ home (slum) - peak 80.95 60.48 – 69.19 86.38 83.22
Hrs @ home (other) - peak 86.28 60.48 78.00 80.00 82.26 84.90 Value - healthy (slum) 1968.10 1962.10 – 1976.60 4305.90 1960.20 Value - healthy (other) 4317.40 4283.10 4315.00 4315.30 4315.60 4316.50 Value - healthy (all) 3797.00 3769.00 4315.00 3797.20 4313.50 3794.50
Decomposing the Role of Slums: Population Density
Homog. Homog. Homog.
Benchmark Epidem. No slum densities wage rates age struct.
Wks to peak srsly ill (slum) 10.00 9.00 – 15.00 10.00 10.00
Wks to peak srsly ill (other) 11.00 10.00 14.00 14.00 11.00 11.00
Dead p/ 1,000 1year (slum) 10.04 13.78 – 6.32 8.87 13.49
Dead p/ 1,000 1year (other) 6.35 15.43 6.87 6.86 6.78 6.57
Dead p/ 1,000 1year (all) 7.16 15.06 6.87 6.74 7.25 8.11
Dead p/ 1,000 LR (slum) 10.11 13.78 – 6.53 9.07 13.68
Dead p/ 1,000 LR (other) 6.57 15.43 7.47 7.30 7.13 6.83
Dead p/ 1,000 LR (all) 7.35 15.06 7.47 7.13 7.56 8.34
Immune in LR (slum), % 74.33 91.60 – 51.78 70.11 72.37
Immune in LR (other), % 39.69 77.66 46.01 44.72 43.03 40.76
Immune in LR (all), % 47.36 80.75 46.01 46.28 49.03 47.76
GDP at peak - rel to BM 1.00 1.82 1.48 1.23 1.29 1.03
GDP 1year - rel to BM 1.00 1.14 1.17 1.00 1.17 0.99
Hrs @ home (slum) - peak 80.95 60.48 – 69.19 86.38 83.22
Hrs @ home (other) - peak 86.28 60.48 78.00 80.00 82.26 84.90 Value - healthy (slum) 1968.10 1962.10 – 1976.60 4305.90 1960.20 Value - healthy (other) 4317.40 4283.10 4315.00 4315.30 4315.60 4316.50 Value - healthy (all) 3797.00 3769.00 4315.00 3797.20 4313.50 3794.50
22
Decomposing the Role of Slums: Inequality
Homog. Homog. Homog.
Benchmark Epidem. No slum densities wage rates age struct.
Wks to peak srsly ill (slum) 10.00 9.00 – 15.00 10.00 10.00
Wks to peak srsly ill (other) 11.00 10.00 14.00 14.00 11.00 11.00
Dead p/ 1,000 1year (slum) 10.04 13.78 – 6.32 8.87 13.49
Dead p/ 1,000 1year (other) 6.35 15.43 6.87 6.86 6.78 6.57
Dead p/ 1,000 1year (all) 7.16 15.06 6.87 6.74 7.25 8.11
Dead p/ 1,000 LR (slum) 10.11 13.78 – 6.53 9.07 13.68
Dead p/ 1,000 LR (other) 6.57 15.43 7.47 7.30 7.13 6.83
Dead p/ 1,000 LR (all) 7.35 15.06 7.47 7.13 7.56 8.34
Immune in LR (slum), % 74.33 91.60 – 51.78 70.11 72.37
Immune in LR (other), % 39.69 77.66 46.01 44.72 43.03 40.76
Immune in LR (all), % 47.36 80.75 46.01 46.28 49.03 47.76
GDP at peak - rel to BM 1.00 1.82 1.48 1.23 1.29 1.03
GDP 1year - rel to BM 1.00 1.14 1.17 1.00 1.17 0.99
Hrs @ home (slum) - peak 80.95 60.48 – 69.19 86.38 83.22
Hrs @ home (other) - peak 86.28 60.48 78.00 80.00 82.26 84.90 Value - healthy (slum) 1968.10 1962.10 – 1976.60 4305.90 1960.20 Value - healthy (other) 4317.40 4283.10 4315.00 4315.30 4315.60 4316.50 Value - healthy (all) 3797.00 3769.00 4315.00 3797.20 4313.50 3794.50
Decomposing the Role of Slums: Age structure
Homog. Homog. Homog.
Benchmark Epidem. No slum densities wage rates age struct.
Wks to peak srsly ill (slum) 110.00 9.00 – 15.00 10.00 10.00
Wks to peak srsly ill (other) 11.00 10.00 14.00 14.00 11.00 11.00
Dead p/ 1,000 1year (slum) 10.04 13.78 – 6.32 8.87 13.49
Dead p/ 1,000 1year (other) 6.35 15.43 6.87 6.86 6.78 6.57
Dead p/ 1,000 1year (all) 7.16 15.06 6.87 6.74 7.25 8.11
Dead p/ 1,000 LR (slum) 10.11 13.78 – 6.53 9.07 13.68
Dead p/ 1,000 LR (other) 6.57 15.43 7.47 7.30 7.13 6.83
Dead p/ 1,000 LR (all) 7.35 15.06 7.47 7.13 7.56 8.34
Immune in LR (slum), % 74.33 91.60 – 51.78 70.11 72.37
Immune in LR (other), % 39.69 77.66 46.01 44.72 43.03 40.76
Immune in LR (all), % 47.36 80.75 46.01 46.28 49.03 47.76
GDP at peak - rel to BM 1.00 1.82 1.48 1.23 1.29 1.03
GDP 1year - rel to BM 1.00 1.14 1.17 1.00 1.17 0.99
Hrs @ home (slum) - peak 80.95 60.48 – 69.19 86.38 83.22
Hrs @ home (other) - peak 86.28 60.48 78.00 80.00 82.26 84.90 Value - healthy (slum) 1968.10 1962.10 – 1976.60 4305.90 1960.20 Value - healthy (other) 4317.40 4283.10 4315.00 4315.30 4315.60 4316.50 Value - healthy (all) 3797.00 3769.00 4315.00 3797.20 4313.50 3794.50
24
Policy experiments
• All ICU beds made public
• Shelter-at-home policies; i.e. lockdowns
• Cash transfers
All hospital beds used by the public system
All beds Benchmark public Wks to peak srsly ill (slum) 10.00 10.00 Wks to peak srsly ill (other) 11.00 11.00 Dead p/ 1,000 1year (slum) 10.04 6.84 Dead p/ 1,000 1year (other) 6.35 4.82 Dead p/ 1,000 1year (all) 7.16 5.27 Dead p/ 1,000 LR (slum) 10.11 6.85 Dead p/ 1,000 LR (other) 6.57 4.86
Dead p/ 1,000 LR (all) 7.35 5.30
Immune in LR (slum), % 74.33 77.03 Immune in LR (other), % 39.69 42.89
Immune in LR (all), % 47.36 50.46
GDP at peak - rel to BM 1.00 1.02
GDP 1year - rel to BM 1.00 1.04
Hrs @ home (slum) - peak 80.95 80.26 Hrs @ home (other) - peak 86.28 85.01 Value - healthy (slum) 1968.10 1974.90 Value - healthy (other) 4317.40 4325.80
Value - healthy (all) 3797.00 3805.10 26
Shelter-at-home policies
0 50 100 150
0 10 20 30 40 50
0 50 100 150
-6 -5 -4 -3 -2 -1 0
Shelter-at-home policies
6-week late
Immediate lockdown lockdown
25%, all 25%, slums 25%, non-slum 75%, all 25%, all Benchmark 26 weeks 26 weeks 26 weeks 35 weeks 26 weeks
Wks to peak srsly ill (slum) 10.00 14.00 13.00 11.00 66.00 11.00
Wks to peak srsly ill (other) 11.00 16.00 14.00 12.00 67.00 12.00
Dead p/ 1,000 1year (slum) 10.04 9.21 9.13 10.00 0.00 8.68
Dead p/ 1,000 1year (other) 6.35 5.84 6.92 5.28 0.00 5.26
Dead p/ 1,000 1year (all) 7.16 6.58 7.41 6.33 0.00 6.02
Dead p/ 1,000 LR (slum) 10.11 9.51 9.29 10.19 10.10 9.29
Dead p/ 1,000 LR (other) 6.57 6.48 7.22 5.91 6.56 6.34
Dead p/ 1,000 LR (all) 7.35 7.15 7.68 6.86 7.35 7.00
Immune in LR (slum), % 74.33 73.58 70.96 76.68 74.36 73.29
Immune in LR (other), % 39.69 40.32 42.96 38.18 39.67 40.57
Immune in LR (all), % 47.36 47.69 49.16 46.71 47.35 47.82
GDP at peak - rel to BM 1.00 0.96 1.12 0.86 0.99 0.95
GDP 1year - rel to BM 1.00 0.87 0.98 0.89 0.47 0.87
Hrs @ home (slum) - peak 80.95 83.18 84.40 79.79 80.19 83.76
Hrs @ home (other) - peak 86.28 85.87 81.83 89.56 85.95 86.16
Value - healthy (slum) 1968.10 1964.40 1964.20 1968.20 1863.20 1964.40 Value - healthy (other) 4317.40 4312.90 4315.30 4314.80 4213.00 4313.30 Value - healthy (all) 3797.00 3792.70 3794.50 3795.00 3692.50 3793.1028
Cash transfers
Only financial aid Aid and 25% lockdown for all 300R$, all 300R$, slums 600R$, slums 300R$, all 300R$, slums 600R$, slums Benchmark 26 weeks 26 weeks 26 weeks 26 weeks 26 weeks 26 weeks
Wks to peak srsly ill (slum) 10.00 15.00 14.00 32.00 32.00 32.00 32.00
Wks to peak srsly ill (other) 11.00 16.00 15.00 19.00 33.00 33.00 33.00
Dead p/ 1,000 1year (slum) 10.04 8.99 8.94 8.81 9.01 8.96 9.07
Dead p/ 1,000 1year (other) 6.35 6.40 6.94 6.89 5.49 5.98 5.88
Dead p/ 1,000 1year (all) 7.16 6.97 7.39 7.31 6.27 6.64 6.59
Dead p/ 1,000 LR (slum) 10.11 9.28 9.16 9.15 9.54 9.40 9.58
Dead p/ 1,000 LR (other) 6.57 6.91 7.30 7.36 6.48 6.72 6.70
Dead p/ 1,000 LR (all) 7.35 7.43 7.71 7.76 7.15 7.32 7.34
Immune in LR (slum), % 74.33 71.90 70.69 70.33 73.58 72.44 72.27
Immune in LR (other), % 39.69 41.95 43.41 43.96 40.35 41.39 41.55
Immune in LR (all), % 47.36 48.58 49.45 49.80 47.71 48.27 48.36
GDP at peak - rel to BM 1.00 1.16 1.24 1.30 1.10 1.20 1.12
GDP 1year - rel to BM 1.00 0.94 0.99 0.98 0.84 0.89 0.91
Hrs @ home (slum) - peak 80.95 78.61 80.46 77.55 78.85 77.99 80.36
Hrs @ home (other) - peak 86.28 77.74 77.99 80.32 83.88 82.00 84.49
Value - healthy (slum) 1968.10 1985.60 1985.70 1998.80 1982.40 1982.60 1996.70
Value - healthy (other) 4317.40 4322.20 4315.70 4315.60 4320.70 4315.10 4316.70
Value - healthy (all) 3797.00 3804.60 3799.60 3802.40 3802.80 3798.50 3802.80
Conclusions
Slums:
• High-density areas populated by poorer and younger individuals
• Faster spread of diseases such as Covid-19 - but not necessarily more death rates (although still higher in our model)
This paper:
• Rich daily location data: slum dwellers → less social distance
• Model:
• More infections (and deaths) in slums
• World wo slums: distributional health effects
• Policies:
• Reallocation of ICUs: all groups better off
• Shelter-at-home: delay; small overall effects, redistribution
• Cash transfers: delay; small effects (or backfire); redistribution
30
Extra slides
Model environment
Discrete time Back
Different groups (g): Slums/favelas (f) and others (o) Health status (j):
• healthy (h)
• infected (i): recovery (φ(0,g)) or serious symptoms (α(g))
• symptoms (s): recovery (φ(1,g)) or death (δt(g))
• recovered (r): immune forever Slums:
• Higher population density (ξg)
• Younger individuals: (φ(0,g)), (α(g)), (φ(1,g)), (δt(g))
• Poorer individuals (w(g))
• Harder access to ICU
• Death prob: δt(g)
32
Model environment
Discrete time Back
Different groups (g): Slums/favelas (f) and others (o)
Health status (j):
• healthy (h)
• infected (i): recovery (φ(0,g)) or serious symptoms (α(g))
• symptoms (s): recovery (φ(1,g)) or death (δt(g))
• recovered (r): immune forever Slums:
• Higher population density (ξg)
• Younger individuals: (φ(0,g)), (α(g)), (φ(1,g)), (δt(g))
• Poorer individuals (w(g))
• Harder access to ICU
• Death prob: δt(g)
Model environment
Discrete time Back
Different groups (g): Slums/favelas (f) and others (o) Health status (j):
• healthy (h)
• infected (i): recovery (φ(0,g)) or serious symptoms (α(g))
• symptoms (s): recovery (φ(1,g)) or death (δt(g))
• recovered (r): immune forever
Slums:
• Higher population density (ξg)
• Younger individuals: (φ(0,g)), (α(g)), (φ(1,g)), (δt(g))
• Poorer individuals (w(g))
• Harder access to ICU
• Death prob: δt(g)
32
Model environment
Discrete time Back
Different groups (g): Slums/favelas (f) and others (o) Health status (j):
• healthy (h)
• infected (i): recovery (φ(0,g)) or serious symptoms (α(g))
• symptoms (s): recovery (φ(1,g)) or death (δt(g))
• recovered (r): immune forever Slums:
• Higher population density (ξg)
• Younger individuals: (φ(0,g)), (α(g)), (φ(1,g)), (δt(g))
• Poorer individuals (w(g))
• Harder access to ICU
• Death prob: δ (g)
Households
Time: workn, leisure outside`, leisure at home d Time constraint (TC):n+`+d=1
Leisure goods outside the housea:
a(x, `) = [θxρ+ (1−θ)`ρ]1/ρ
Preferences:
u(c,a,d;j,g,p) = lnc+γlna+ [λd+λ(j)+λp(j,g)] ln(d) +b Discount factorβ
Budget constraint (BC):
c+x=wp(g) +w(g)n
33
Households
Time: workn, leisure outside`, leisure at home d Time constraint (TC):n+`+d=1
Leisure goods outside the housea:
a(x, `) = [θxρ+ (1−θ)`ρ]1/ρ Preferences:
u(c,a,d;j,g,p) = lnc+γlna+ [λd+λ(j)+λp(j,g)] ln(d) +b Discount factorβ
Budget constraint (BC):
c+x=wp(g) +w(g)n
Households
Time: workn, leisure outside`, leisure at home d Time constraint (TC):n+`+d=1
Leisure goods outside the housea:
a(x, `) = [θxρ+ (1−θ)`ρ]1/ρ Preferences:
u(c,a,d;j,g,p) = lnc+γlna+ [λd+λ(j)+λp(j,g)] ln(d) +b Discount factorβ
Budget constraint (BC):
c+x=wp(g) +w(g)n
33
Infections
Prob of infection:
π(n+`,Πt(g)) = (n+`)Πt(g) Details:
Πˆt(g) = (1−ζ)Π0
∑
˜
g∈{f,o},j∈{i,s}
(nt(j,g˜) +`t(j,g˜))Mt(j,g˜)
+ζΠ0
∑
j∈{i,s}
1 ξg
(nt(j,g) +`t(j,g))Mt(j,g).
Πt(g) =1−e−Πˆt(g)
Decision making
Healthy:
Vt(h,g) = max
c,x,n,`,du(c,a(x, `),d;h,g,pt) +
β{[1−π(n+`,Πt(g))]Vt+1(h,g) +π(n+`,Πt(g))Vt+1(i,g)}
subject to (TC) and (BC).
Infected:
Vt(i,g) = max
c,x,n,`,du(c,a(x, `),d;i,g,pt) +β φ(0,g)Vt+1(r,g) + β(1−φ(0,g))[α(g)Vt+1(s,g) + (1−α(g))Vt+1(i,g)] subject to (TC) and (BC).
35
Decision making
Healthy:
Vt(h,g) = max
c,x,n,`,du(c,a(x, `),d;h,g,pt) +
β{[1−π(n+`,Πt(g))]Vt+1(h,g) +π(n+`,Πt(g))Vt+1(i,g)}
subject to (TC) and (BC).
Infected:
Vt(i,g) = max
c,x,n,`,du(c,a(x, `),d;i,g,pt) +β φ(0,g)Vt+1(r,g) + β(1−φ(0,g))[α(g)Vt+1(s,g) + (1−α(g))Vt+1(i,g)]
subject to (TC) and (BC).
Decision making
Symptoms:
Vt(s,g) =β[φ(1,g)Vt+1(r,g) + (1−φ(1,g))(1−δt(g))Vt+1(s,g)]
subject to (TC) and (BC).
Recovered:
Vt(r,g) = max
c,x,n,`,hu(c,a(x, `),d;r,g,pt) +βVt+1(r,g) subject to (TC) and (BC).
36
Decision making
Symptoms:
Vt(s,g) =β[φ(1,g)Vt+1(r,g) + (1−φ(1,g))(1−δt(g))Vt+1(s,g)]
subject to (TC) and (BC).
Recovered:
Vt(r,g) = max
c,x,n,`,hu(c,a(x, `),d;r,g,pt) +βVt+1(r,g) subject to (TC) and (BC).
Hospital access and death probabilities
Hospital users (public and private):
Upub=Mt(s,f) + (1−ψ)Mt(s,o) Upriv =ψMt(s,o)
Death prob (measure of hospital bedsZ):
δ(f) = ˜δ1(f) min Zpub
Upub
,1
+ ˜δ2(f) max
Upub−Zpub Upub
,0
,
δ(o) =ψ
δ˜1(o) min Zpriv
Upriv,1
+ ˜δ2(o) max
Upriv−Zpriv
Upriv ,0
+ (1−ψ)
δ˜1(o) min Zpub
Upub,1
+ ˜δ2(o) max
Upub−Zpub Upub ,0
.
37
Aggregation
Output:
Qt=
∑
j,g
w(j,g)nt(j,g)Mt(j,g)
Laws of motion:
Mt+1=T(Mt,Nt,Πt(o),Πt(f)).
Example: law of motion for healthy individuals of a groupg Mt+1(h,g) =Mt(h,g) [1−π(nt(h,g) +`t(h,g),Πt(g))].
Equilibrium
A rational-expectations equilibriumin this economy with initial number of agentsM0(j,g)consists of a sequence of infection and death rates{Πt(g),δt(g)}∞t=0 and equilibrium time allocations {nt(j,g), `t(j,g)}∞t=0 such that:
• these time allocations are part of the solutions to the individual optimization problems, and
• the resulting laws of motion and their aggregation indeed give rise to the sequence{Πt(g),δt(g)}∞t=0.
39
Parameters (Rio de Janeiro) - City Parameters
Parameter Value Interpretation
Panel A: City parameters (6 parameters)
∑jM0(j,f) 0.222 Fraction of people living in slums (calibrated) w(o) 1 Wage rate of non-slum agents (calibrated) w(f) 0.277 Wage rate of slum agents (calibrated)
ξf 0.065 Frac. of space assigned to slums (calibrated)
ξo 0.934 Frac. of space assigned to areas wo slums (calibrated) ζ 0.334 Prop. of time spent within group (calibrated)
Parameters (Rio de Janeiro) - Disease Parameters
Parameter Value Interpretation Panel B: Disease parameters (15 parameters)
Π0 11.43 Infectiousness of Covid-19 (internatlly estimated)
α(o),α(f) 1 Prob. (serious symptoms|no recovery from mild) (calibrated) φ(0,o) 0.971 Prob. of recovery from mild Covid-19, other (calibrated) φ(0,f) 0.979 Prob. of recovery from mild Covid-19, slum (calibrated) φ(1,o),φ(1,f) 0.284 Prob. of recovery from serious Covid-19 (calibrated)
δ˜1(o) 0.118 Wkly death rate, other; critically ill with ICU (calibrated) δ˜1(f) 0.073 Wkly death rate, slum; critically ill with ICU (calibrated) δ˜2(o),δ˜2(f) 1.0 Wkly death rate; critically ill wo ICU (calibrated)
`¯ 0.158 Infections through the health care system (calibrated) ψ 0.152 Prop. non-slum agents with priv. insurance (calibrated) Zpub 8.12e-5 Measure of beds in public system (calibrated)
41
Parameters (Rio de Janeiro) - Preference Parameters
Parameter Value Interpretation
Panel C: Preference parameters (7 parameters)
ρ -1.72 Elast. of subst. bw leisure time and goods (calibrated) θ 0.108 Production of leisure goods (internally estimated) γ 1.089 Rel. utility weight–leisure goods (internally estimated) λd 2.453 Rel. utility weight–leisure at home (internally estimated) λa 1.995 Rel. utility weight–leisure at home; infected (calibrated)
β 0.961/52 Discount factor (calibrated)
b 8.575 Value of being alive (internally estimated)
Back
Different hospitalization rates
Benchmark
1−φ(0,g) 1
1−φ(0,g) 2
1−φ(0,g) 5
1−φ(0,g) 10
Wks to peak srsly ill (slum) 10.00 10.00 11.00 11.00 Wks to peak srsly ill (other) 11.00 12.00 12.00 12.00 Srsly ill p/ 1,000 @ peak (slum) 1.88 1.28 0.73 0.47 Srsly ill p/ 1,000 @ peak (other) 0.77 0.64 0.46 0.32 Dead p/ 1,000 1year (slum) 10.04 5.07 2.00 0.92 Dead p/ 1,000 1year (other) 6.35 3.43 1.52 0.76 Dead p/ 1,000 1year (all) 7.16 3.80 1.63 0.80
Dead p/ 1,000 LR (slum) 10.11 5.08 2.00 0.92
Dead p/ 1,000 LR (other) 6.57 3.44 1.52 0.76
Dead p/ 1,000 LR (all) 7.35 3.80 1.63 0.80
Immune in LR (slum), % 74.33 76.44 80.58 83.14 Immune in LR (other), % 39.69 42.16 48.96 54.46 Immune in LR (all), % 47.36 49.75 55.97 60.81 Hrs @ home (slum) - peak 80.95 76.57 70.04 67.00 Hrs @ home (other) - peak 86.28 82.04 74.34 69.59 Hrs @ home (slum) - 6m 66.03 61.60 60.59 60.50 Hrs @ home (other) - 6m 69.40 62.80 60.73 60.52 Value - healthy (slum) 1968.10 1979.00 1985.60 1987.80 Value - healthy (other) 4317.40 4333.40 4343.10 4346.70
Value - healthy (all) 3797.00 3811.90 3820.90 3824.20 43