These assignments were legacies from previous years and were replaced in subsequent versions of the course by similar exercises using Processing6. In the second year, we tried to solve the problems identified at the end of the previous delivery.
Design Rationale
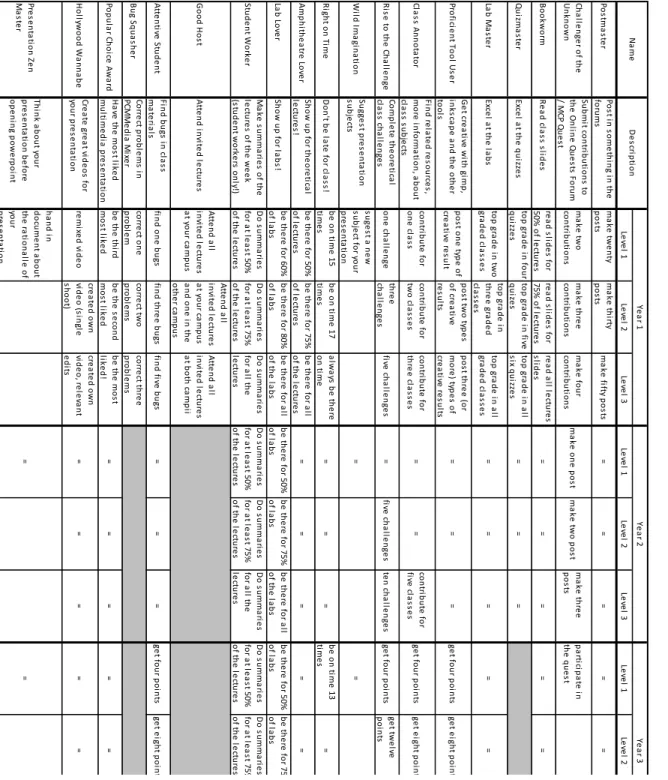
The main goal was to allow students to develop a sense of identity, customize their learning experience and be creative while still applying what they learned in the classroom. Examples of these were the Skill Tree, which had multiple combinations of paths to reach the maximum XP awarded, achievements with additional XP that created alternative paths to completion, and challenges starting in third year, allowing students to complete up to three of the same kind.
STUDENT CLUSTERING
The First Year
This encouraged us to rethink some achievements and improve their balance in the next year. Performance measures with significant mean differences between one cluster and all others in the first year.
The Second Year
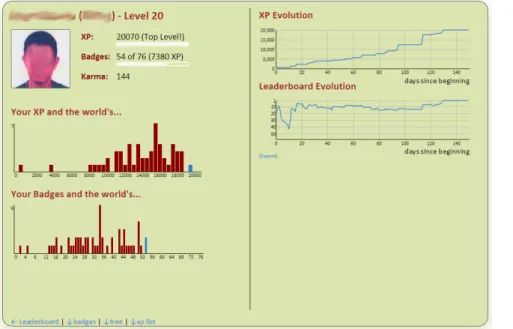
The average leaderboard position of this group is similar to that of depressed students, which translates into what appears to be a rapid loss of ranking at the beginning of the course followed by a progressive recovery (see Figure 10). . Desperate students also differed significantly from other students in the amount of badges collected from post-master's achievement (make a lot of posts). Several features significantly differentiated Underachievers from other groups, such as the number of posts, answer posts, challenge posts, and theory challenge posts, the amount of XP earned from Challenges and Theory Challenges, and the number of badges earned in Postmaster and Rise to challenge achievements (Full Theory Challenges).
Students felt that the distribution of the amount of work required of them during the semester was even, and they also took into account the amount of work they put into the course. Performance measures with significant differences in their mean value, between one cluster and all others, in the second year. However, 50% of achievers and 42% of discouraged students believed that the XP distribution should remain the same.
Rating of the skills tree was the only item in the questionnaire where the differences between a group's response (the Achievers in this case) and that of the other three were significant.
The Third Year
Another new group consisted of 13 students who presented the XP gained between the regular students and the underachievers. It is also noticeable that there are some in which the differences are not significant between Successful and Regular students, but are significant between these two and Half and Failed (and also between these two), such as finals. This suggests that Achievers and Regulars have comparable levels of performance on these two measures.
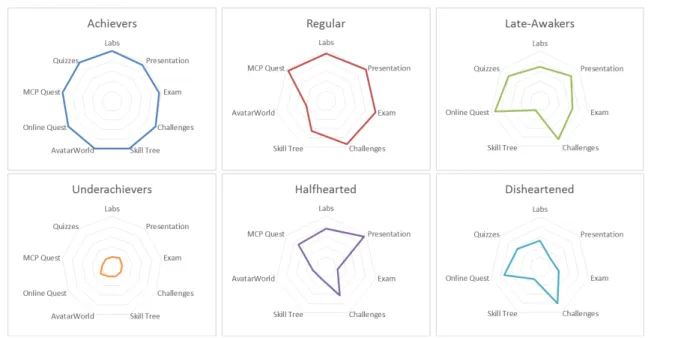
We also found that attributes such as the number of posts, submissions, and XP earned from AvatarWorld, and the number of badges collected from the Blacksmith, Master Build, and Squire achievements showed significant differences between the Achievers and all other clusters. Interestingly, a closer look at Table B.3 shows that the number of badges earned from the performer's performance seems to separate the achievers and regulars from the half-hearted and underachievers. Most students found the MCP Quest interesting, although the Overachievers and Underachievers seem to find it only slightly interesting.
The skill tree, now in a more mature form, was explored by all student types, especially the achievers and the regular students.

ENGAGEMENT ASSESSMENT
Analysis of Variance
Before we could compare the average of the students' responses using a parametric test, we verified the normality of the responses from all clusters to both instances of the questionnaire using both the Kolmogorov-Smirnov and Shapiro-Wilk tests (see Table 9). We then performed Repeated Measures Analysis of Variance (ANOVA), where responses to the first and second instance of the questionnaire were the within-subjects variables (coded as the time factor) and Student Type was the between-subjects factor. Looking at the results of the multivariate tests, there was no apparent interaction effect between Time and Student Type, as none of the multivariate tests were statistically significant.
However, tests between subjects showed that the differences between the mean values of the student types were significant, as shown in Table 10 (p < .01). Post-hoc tests using the Fishers Least Significant Difference (LSD) found significant differences between the Achievers and Halfhearted (p < .05) and between Regular and Halfhearted (p < .01). These tests showed that there were only significant differences between the normal and the sober students (p < .05).
We believe this happened because we only had 6 cases on this group, as only about 50% of the Underperformers responded.
Discriminant Function Analysis
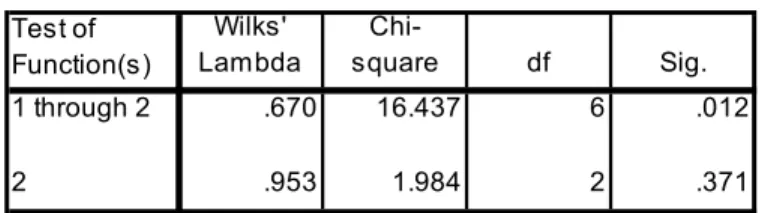
To have a more discriminatory view of the differences between student types for both SCEQ measures, we conducted a One-way ANOVA where SCEQ results were the two dependent variables and the factor was student type. To solve this problem, we performed post-hoc tests using Bonferroni correction, which is a conservative method of controlling the family-wise error rate. These findings seem to complement those of our ANOVA analyses, which suggest that Achievers and Regular Learners have similar levels of engagement, superior to that of Half-hearted and.
DISCUSSION
- Student Type Overview
- Cluster Dynamics and Engagement
- All Different, All Equal
- Study Overview and Design Implications
- Study Limitations
Together with the previous findings, this suggests that the discouraged students were less engaged in our second gamified instance of the course. We believe that the emergence of the Late Awakeners in the second year may be partly responsible for the changes observed in the discouraged students between the first two years. This would have put some students who would otherwise have been counted among the discouraged students or even the underachievers back to work.
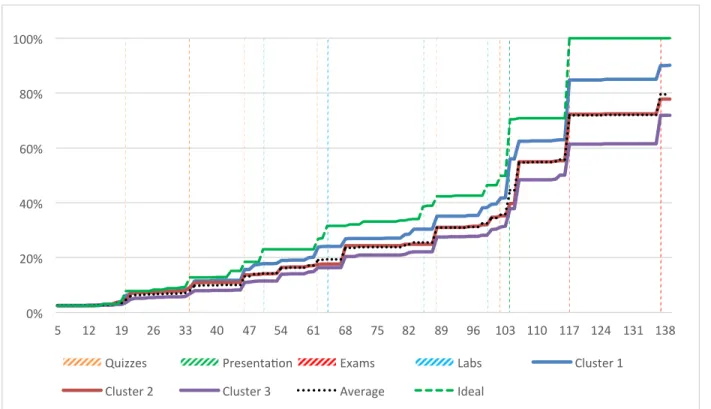
They neglected the Skill Tree and, in the case of the Halfhearted, the AvatarWorld as well. On the other hand, most of the participation in the Skill Tree was performed only by Achievers and Regular students. The second effect consists of how the Achievers were ahead of the Ideal student for two thirds of the course in the third year and were dragged along by the Multimedia Presentation and the exams.
This led us to believe that these students still did not pay attention to the game aspects of the course.
CONCLUSION
For example, we could not control for the number of students enrolled nor the nature of the student population, which could have influenced the observed differences between years. In addition, some of the course materials had to change to keep the course up-to-date, according to university policy, and the composition of the faculty staff also changed from year to year. Student engagement may also have been affected by these factors, differently across the three years.
The perceived nature of the identified clusters may also have been influenced by population size. This can be achieved by creating different opportunities for students to learn and score, throughout the duration of the course, and by offering alternative pathways. Reaching every student was one of the toughest challenges in our gamified experiment.
This study provides a means to better understand what different kinds of behavior can occur in gamified learning environments and how different students are engaged in the game.
ACKNOWLEDGMENTS
Just like games, it is of utmost importance to allow players to learn from trial and error and be able to choose their own path. As the course has evolved over time, we've learned that as achievements become more prominent and better rewarded, the experience becomes more competitive. Therefore, it becomes important to create new opportunities for students to work together and balance the competitive pressure.
Thus, we believe that our findings contribute to enriching the knowledge about gamified education and provide valuable hypotheses for future research in the field. We hope our results can be used to guide other gamified learning efforts so that each student can learn better while enjoying the experience. As for future work, we would like to use our findings on student differentiation along with machine learning techniques to develop adaptive gamified learning environments.
We envision that such approaches will allow us to discover a student's profile very early in the game so that content and delivery can be automatically tailored to participants to make their learning experience enjoyable, enriching and productive. .
Scott-Parker, Driven to drive: Designing gamification for a learner logbook smartphone application, in: Proceedings of the 2013 Symposium on Gameful Design, Research, and Applications, Gamification 2013, Stratford, ON, Canada, 2013, p. Denny, The effect of virtual achievement on student engagement, in: Proceedings of the SIGCHI Conference on Human Factors in Computing Systems, CHI '13, ACM, New York, NY, USA, 2013, p. Gonçalves, Improving participation and learning with gamification, in: Proceedings of the First International Conference on Game Design, Research and Applications, Gamification '13, ACM, New York, NY, USA, 2013, p.
Higginbotham, Electromagnetism supercharged!: learning physics with digital simulation games, in: Proceedings of the 6th international conference on Learning sciences, ICLS '04, International Society of the Learning Sciences, 2004, p. Tuch, Do Points, Levels, and Leaderboards Harm Intrinsic Motivation?: An Empirical Analysis of Common Elements of Gamification, in: Proceedings of the First International Conference on Gameful Design, Research, and Applications, ACM, 2013, p. Fishman, Gradecraft: what can we learn from a game-inspired learning management system?, in: Proceedings of the Third International Conference on Learning Analytics and Knowledge, ACM, 2013, pp.
Gonçalves, Enhancing student creativity through gamification and virtual worlds, in: Proceedings of the First International Conference on Gameful Design, Research, and Applications, Gamification '13, ACM, New York, NY, USA, 2013, p. Tukey, Performance of some robust rules for flagging deviations, Journal of the American Statistical Association. Currently, different levels of the same achievement have diminishing returns (level 1 will get you more XP than level 2 and more than level 3).